

| Gastroenterology Research, ISSN 1918-2805 print, 1918-2813 online, Open Access |
| Article copyright, the authors; Journal compilation copyright, Gastroenterol Res and Elmer Press Inc |
| Journal website http://www.gastrores.org |
Original Article
Volume 10, Number 2, April 2017, pages 70-77
Changing Trends in Age, Gender, Racial Distribution and Inpatient Burden of Achalasia
Vaibhav Wadhwaa, Prashanthi N. Thotab, Malav P. Parikhb, Rocio Lopezc, Madhusudhan R. Sanakab, d
aDepartment of Internal Medicine, Fairview Hospital, Cleveland Clinic, OH, USA
bDepartment of Gastroenterology and Hepatology, Digestive Disease Institute, Cleveland Clinic, OH, USA
cDepartment of Biostatistics and Quantitative Health Sciences, Cleveland Clinic, OH, USA
dCorresponding Author: Madhusudhan R. Sanaka, Center for Advanced Endoscopy, Desk Q3, Digestive Disease Institute, Cleveland Clinic, 9500 Euclid Avenue, Cleveland, OH 44106, USA
Manuscript accepted for publication December 15, 2017
Short title: Trends in Hospitalizations for Achalasia
doi: https://doi.org/10.14740/gr723w
| Abstract | ▴Top |
Background: Achalasia is an idiopathic esophageal motility disorder characterized by dysphagia, regurgitation, chest discomfort and weight loss. The aim of this study was to evaluate the temporal trends in demographic variables, interventions, and inpatient burden in achalasia-related hospitalizations.
Methods: We evaluated the National Inpatient Sample Database (NIS) for all patients in whom achalasia (ICD-9 code: 530.0) was the principal discharge diagnosis from 1997 to 2013. Data regarding the patient demographics, number of hospitalizations, length of stay, associated hospital costs and temporal trends over the study period were obtained.
Results: In 1997, there were 2,493 admissions with a principal discharge diagnosis of achalasia as compared to 5,195 in 2013 with an average increase of 4% per year (P < 0.001). In 1997, the proportion of patients under 65 years of age was 53.8% versus 60.1% in 2013. Increasing prevalence in African Americans was noted (11.1% to 17.1%). Inflation-adjusted hospital charges related to achalasia showed a mean increase of $2,521 per year (P < 0.001). There was an increase in Heller myotomy procedures over the study period (P < 0.001).
Conclusions: The number of hospitalizations for achalasia and associated costs has significantly increased significantly over the last 16 years in the United States with disproportionate increase in patients under 65 years of age and racial minorities. Further research on cost-effective evaluation and management of achalasia is required.
Keywords: Inpatient admission rates; Achalasia; Epidemiology; Trends; Race
| Introduction | ▴Top |
Achalasia is a rare, primary esophageal motility disorder characterized by aperistalsis of esophageal body and abnormal relaxation of lower esophageal sphincter. Common symptoms include dysphagia, regurgitation, chest pain and weight loss [1-3]. The reported incidence of achalasia is 1 in 100,000 individuals annually with a prevalence of 10 in 100,000 [4, 5]. It affects men and women equally and there does not appear to be a racial predilection either. The peak incidence is between 30 and 60 years of age. The inciting factor is not known but the motility abnormalities are due to loss of inhibitory neurons in esophageal myenteric plexus. It is most likely an autoimmune phenomenon triggered by a viral infection in a genetically predisposed host [6].
Although patients with achalasia are frequently managed in outpatient setting, some patients require inpatient care for complications such as aspiration pneumonia, severe dysphagia leading to dehydration or malnutrition, and for therapeutic surgical interventions.
Several studies have been published in the past decade on achalasia-related hospitalizations based on national inpatient sample [7-10], but there are limited data on changes in patient demographics and hospitalizations over time. The purpose of this study was to assess the frequency of inpatient discharges for a principal diagnosis of achalasia within the United States (US) from January 1, 1997 to December 31, 2013 and to assess patient and hospital characteristics in achalasia-related hospitalizations.
| Methods | ▴Top |
Study cohort
We used the National Inpatient Sample also known as Nationwide Inpatient Sample (NIS) to obtain a population-based estimate of national trends. The NIS is part of the Healthcare Cost and Utilization Project (HCUP) sponsored by the Agency for Healthcare Research and Quality (AHRQ), Rockville, MD. It is the largest publicly available all-payer inpatient care database in the US and was designed to approximate a 20% sample of US non-federal hospitals. It estimates more than 36 million hospitalizations nationally each year. It is stratified according to geographic region, ownership, location, teaching status and bed size. The 1997 NIS is drawn from 22 states and contains information on all inpatient stays from over 1,000 hospitals, totaling about 7.1 million records. The 2013 NIS contains discharge data from over 4,000 hospitals in 44 states, totaling about 8 million hospital admissions. This large database is an excellent representative sample of the general US population, representing more than 95% of the US population and useful for analyzing health care utilization, access, charges, quality, and outcomes [11, 12]. The NIS database provides only administrative data for analysis. Patient specific clinical data (i.e. laboratory tests, procedures) are not available [13].
To identify cases of achalasia, we queried the NIS database for hospitalization data on all discharge diagnoses with a principal ICD-9-CM diagnosis code of 530.0 (achalasia and cardiospasm) (Supplementary 1, www.gastrores.org). According to the HCUPnet, principal diagnosis is defined as “the condition established after study to be chiefly responsible for occasioning the admission of the patient to the hospital for care” (definition according to the Uniform Bill (UB-92)). Therefore, we believe that we captured data regarding hospitalizations due to achalasia.
In addition, all diagnostic and procedure codes were queried to identify comorbidities and procedures of interest such as pneumonia (481, 482.0-482.4, 482.8-482.9, 483, 484, 485, 486, 507.0, 482.40, 482.41, 482.42, 482.49), sepsis (998.0, 995.9, 995.90, 995.91, 995.92, 038), esophageal perforation (862.22, 862.32), dehydration (276.51), malnutrition (262, 263), esophageal dilation (42.92), Heller myotomy (42.7) and esophagectomy (42.4, 42.41, 42.42, 42.5, 42.51-59, 42.6, 42.61-69).
The query parameters were configured for the period 1997 - 2013. NIS data are available from 1988 to 2013; however, in 1997, there was a change in the NIS dataset to include details of the patient and hospital characteristics allowing in-depth analysis of trends over time. Therefore, this particular period was chosen for our study.
Data collection
Patient data in the database included age, gender, median income (1 ($1 - $38,999); 2 ($39,000 - $47,999); 3 ($48,000 -$62,999) and 4 ($63,000 or more)), location of patient’s residence (metropolitan vs. non-metropolitan area), and payer status (medicare, medicaid, private insurance and uninsured). Hospital characteristics recorded were location (northeast, midwest, south and west), ownership (public, for-profit and not-for-profit), type (teaching vs. non-teaching) and bed size (small, medium, and large) [13].
As per the HCUPnet definitions, metropolitan areas are the ones with population of at least 50,000 people. Areas with population less than that are the non-metropolitan areas. A hospital is considered to be a teaching hospital if the American Hospital Association Annual Survey indicates it has an AMA-approved residency program, is a member of the Council of Teaching Hospitals, or has a ratio of full-time equivalent interns and residents to beds of 0.25 or higher. The definition of bed size varied according to the geographical location of the hospital, rural vs. urban hospital and teaching status. The range for small hospitals was from 1 to 249 beds. The bed size range for medium hospitals was from 50 to 449 and the bed size range for large hospitals was from 100 to 450 and more (https://www.hcupus.ahrq.gov/db/vars/hosp_bedsize/nisnote.jsp).
“Hospital charges” is defined as the amount the hospital charged for the entire hospital stay. It does not include professional (MD) fees. “Length of stay” (LOS) is defined as the number of nights the patient remained in the hospital for this stay [13].
The HCUP Comorbidity Software was used to generate Elixhauser comorbidities from ICD-9 CM diagnosis codes (https://www.hcup-us.ahrq.gov/toolssoftware/comorbidity/comorbidity.jsp). A modified Charlson comorbidity index (CCI) was calculated using the NIS Disease Severity Measure files. Several modifications were performed because not all 22 comorbidities are coded into the NIS database: 1) history of myocardial infarction was omitted and 2) liver disease was given an adjusted weight of 2 points rather than 1 for mild disease and 3 points for moderate to severe disease.
Costs were adjusted for inflation to 2013 dollars using the gross domestic product deflator (Table 1.1.4 Price Indexes for Gross Domestic Product, US Department of Commerce, Bureau of Economic Analysis. http://www.bea.gov/iTable/iTable.cfm?reqid=9&step=3&isuri=1&903=13#reqid=9&step=3&isuri=1&904=1998&903=4&906=a&905=2013&910=x&911=0).
Statistical analysis
The trends for the annual point estimates of the frequency of achalasia for the data sample were plotted and analyzed. The annual frequency of discharges with achalasia was computed by dividing the annual number of discharges with achalasia listed in the NIS database in a given year by the total number of all discharges listed in the NIS for the same year.
Survey procedures, which facilitate the unbiased assessment of population estimates based on the complex sampling design that includes stratification, clustering and weighting, were used to obtain yearly discharge frequencies and mean LOS and costs. The trend weights provided by NIS for the years 2002 - 2011 which are consistent with the redesigned NIS (beginning in 2012) were used (https://www.hcup-us.ahrq.gov/db/nation/nis/trendwghts.jsp).
The temporal trend in achalasia discharges rates, LOS, hospital charges, in-hospital mortality rates and comorbidity rates in subjects with achalasia was assessed by linear and polynomial regression. Poisson regression was used to model rates and linear regression was used to model LOS and costs. The most appropriate functional form for the trend was assessed by examination of regression diagnostic plots. All analyses were performed using SAS (version 9.4, The SAS Institute, Cary, NC) and a P < 0.05 was considered statistically significant.
In addition to the percentages available adjacent to the data in the table, the frequency per 10,000 admissions for each categorical variable was also calculated. These numbers represent the density of patients diagnosed with achalasia compared with the total number of hospital discharges per category. Each frequency was calculated by dividing the number of patients with achalasia by the total discharges in a specific categorical variable for each year and multiplying the number by 10,000. We view the counts as arising from a Poisson distribution and the total discharges as an off set, yielding Poisson rates that have been compared over time using Poisson regression, which yields relative rates (RRs) that express the ratio of rate per 10,000 in 2013 to that in 1997. These values differ from the percentages, which describe each category exclusively for either patients with achalasia or for total discharges. The percentages distinguished differences among the variables for each specific year, whereas the frequencies were vital in comparing trends from 1997 to 2013, especially for age group and region.
| Results | ▴Top |
Overview of hospitalizations for achalasia
There has been a significant increase in number of hospitalizations due to achalasia with an average increase of 183 hospitalizations per year. In 1997, there were 2,493 admissions with a principal discharge diagnosis of achalasia as compared to 5,195 in 2013 (P < 0.001, Fig. 1). The number of total discharges with achalasia (ICD-9: 530.0) as either a primary or secondary diagnosis was 7,690 in 1997 and 16,850 in 2013. The discharge frequency (number of hospital discharges for achalasia/total hospital discharges) also increased from 0.8% in 1997 to 1.5% in 2013.
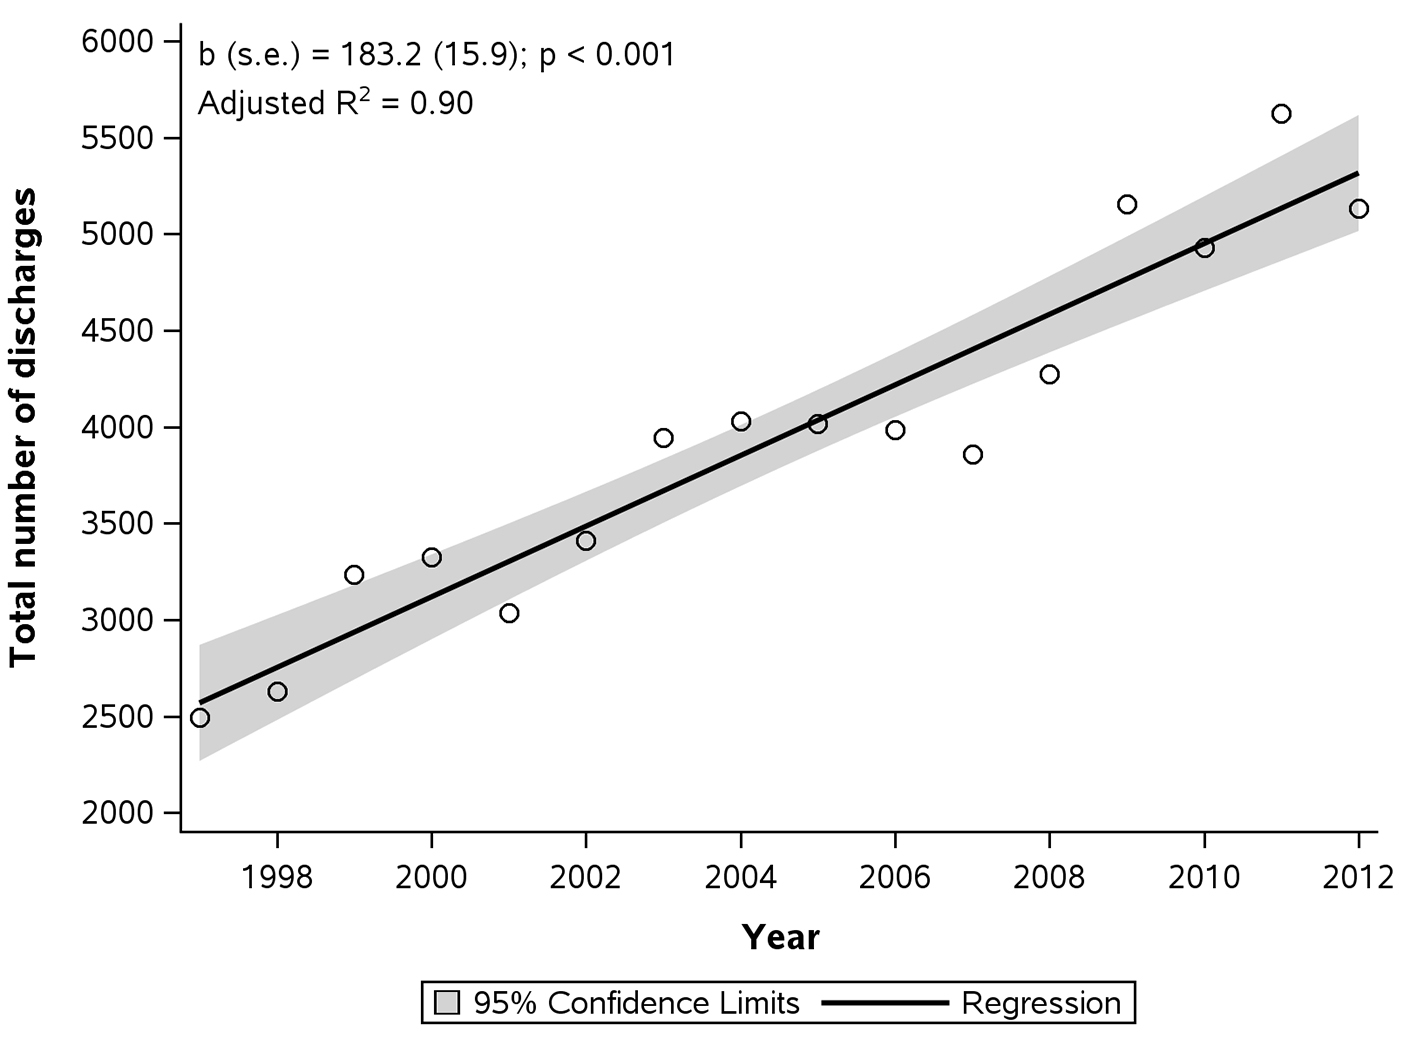 Click for large image | Figure 1. Total number of hospital discharges with principal diagnosis of achalasia. |
The mean LOS for achalasia decreased by 20% between 1997 and 2013 from 5.0 ± 0.2 to 4.1 ± 0.2 days (P < 0.01, Fig. 2). There was a slight decrease in LOS in the late 90s followed by a period of stabilization and a sharp decline around 2009; this trend followed a cubic shape (Fig. 2).
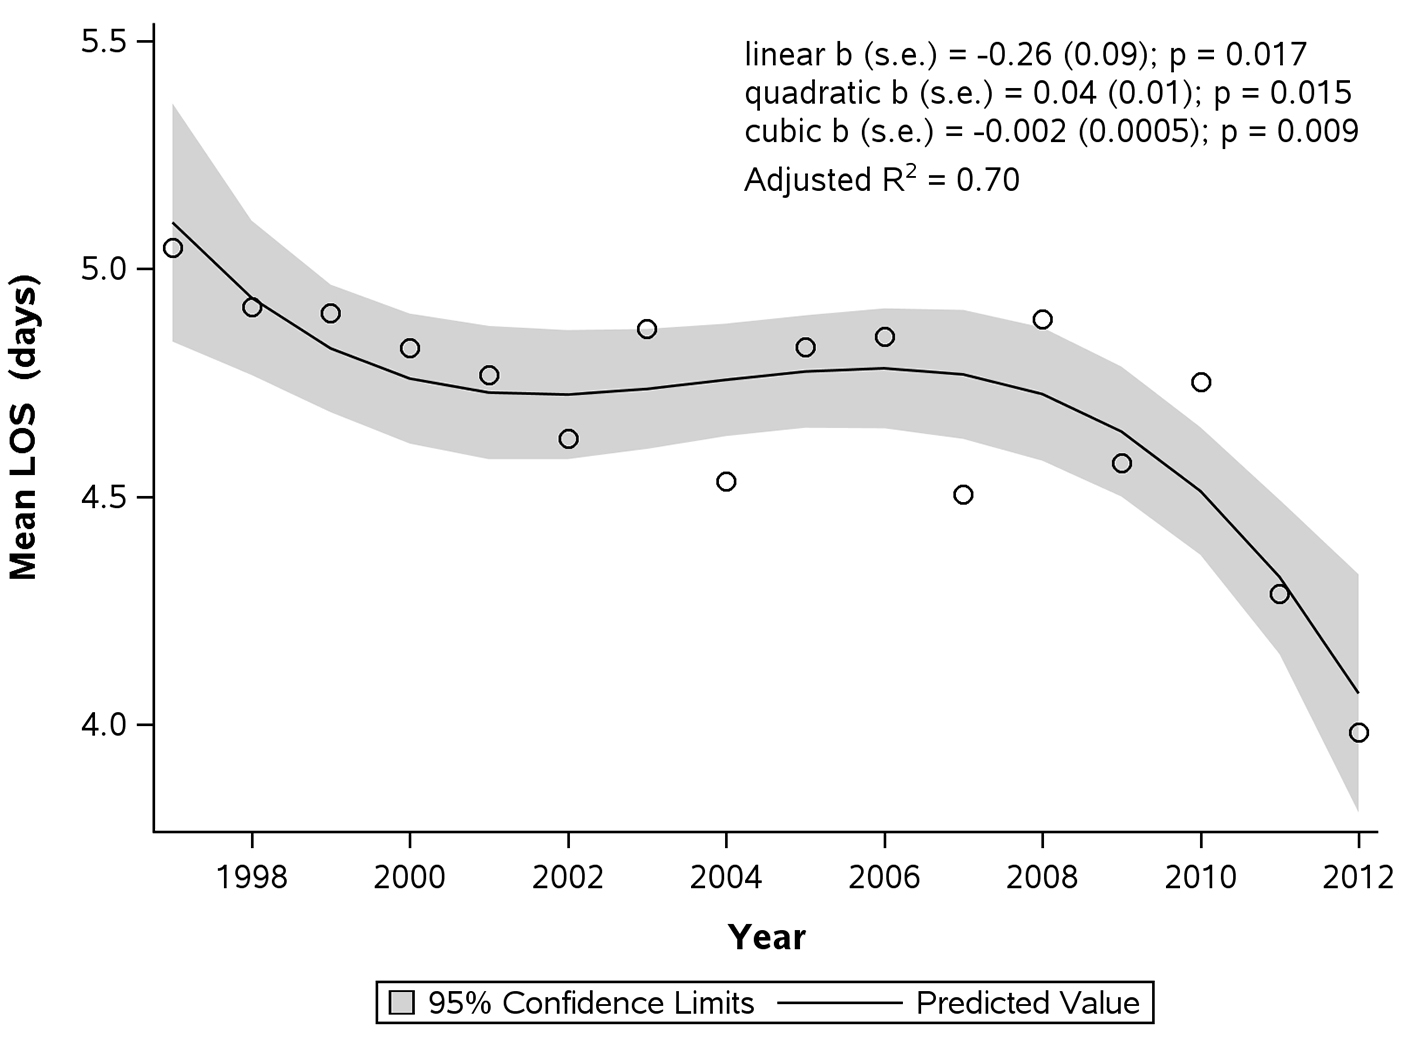 Click for large image | Figure 2. Average total length of stay (LOS) per hospitalization due to achalasia. |
During this period, the mean hospital charges (adjusted for inflation) increased by 413.5% from $9,290 ± 672 in 1997 to $47,707 ± 2,933 in 2013, with a mean increase of $2,521 per year (P < 0.001, Fig. 3). The national bill for achalasia increased by 675.2% from $32,020,083 ± 3,424,012 in 1997 to $248,215,416 ± 19,066,436 in 2013 (P < 0.001).
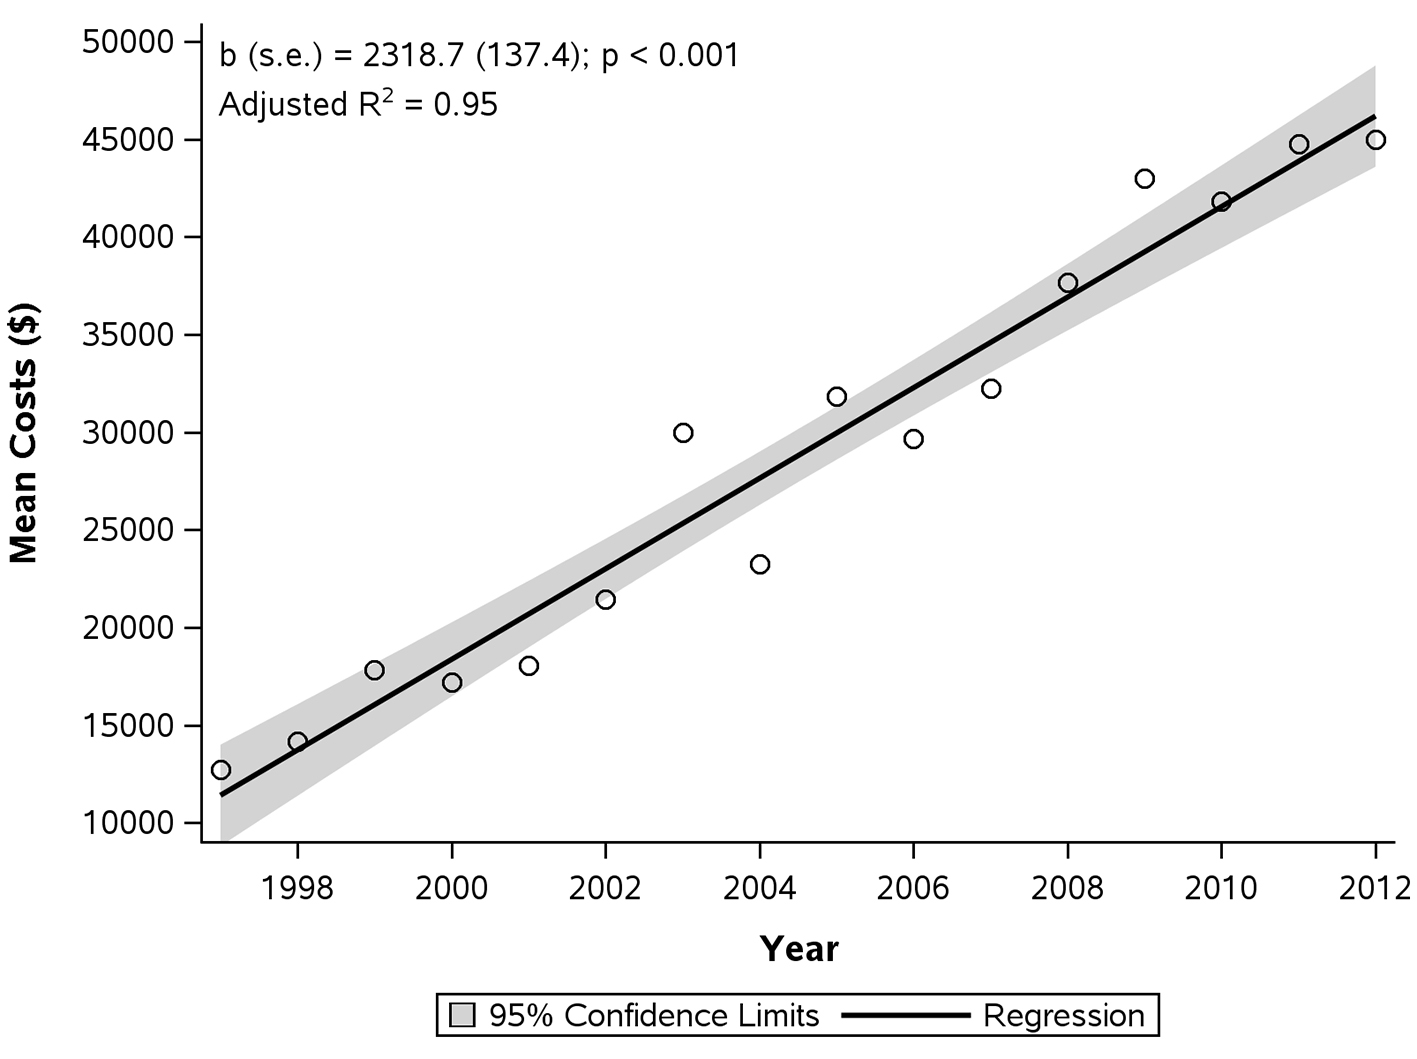 Click for large image | Figure 3. Average total hospital charges per hospitalization due to achalasia. |
The best fit for death frequencies was a linear fit but the adjusted r-square was low (0.30). There seems to be more variation in death frequency but there has been a steady decline through the years with an average 0.03% reduction per year (Fig. 4).
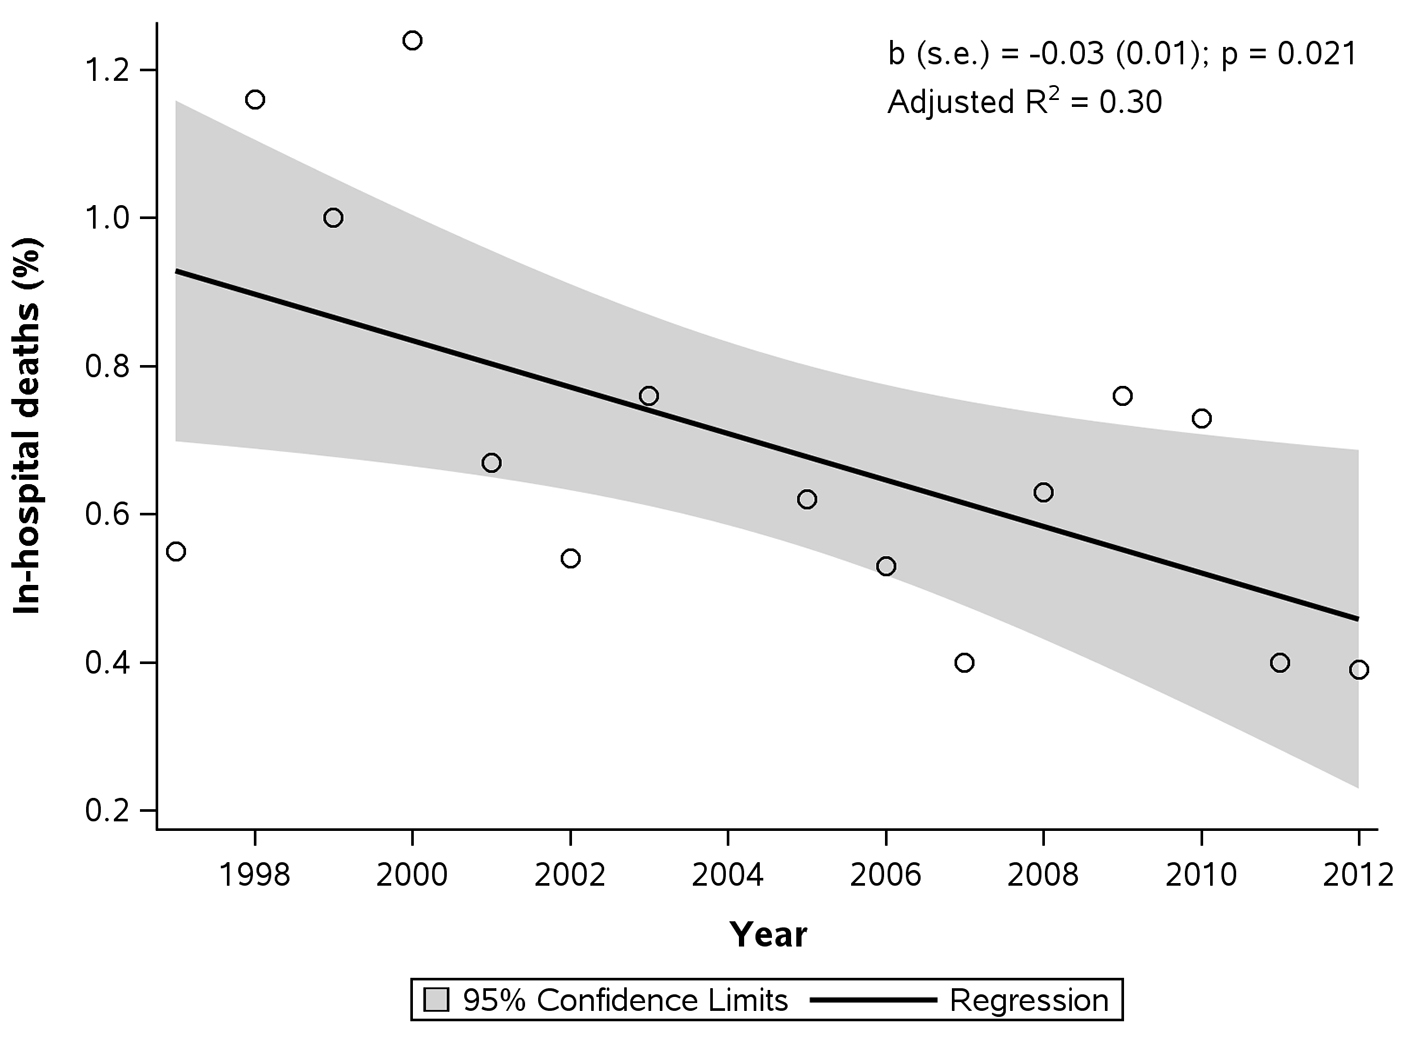 Click for large image | Figure 4. Frequency of in-hospital deaths for hospitalizations with principal diagnosis of achalasia. |
Hospitalizations for achalasia based on patient characteristics
The 65- to 84-year-old age group had the highest rate of discharges for achalasia in 1997 with the trend changing in 2013 towards the slightly younger age group of 45- to 64-year-old age group having the highest discharges (Table 1). The percent distribution of patients discharged with achalasia saw a very significant increase in the 45- to 64-year-old age group (RR: 2.13 (1.93 - 2.34); P < 0.001). The percent distributions for all the other age groups saw slight, however statistically significant, decline in the number of discharges (Table 1).
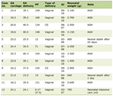 Click to view | Table 1. Demographic Characteristics and Trends of Patients Hospitalized With Achalasia in 1997 and 2013 |
The frequency of hospital admissions for achalasia was similar in women and men in both 1997 and 2013. In women, it increased from 0.70/10,000 discharges in 1997 to 1.40/10,000 discharges in 2013 (RR: 2.05 (1.93 - 2.19); P < 0.001). This increase was similar to that for men, which increased from 0.82/10,000 discharges in 1997 to 1.5/10,000 discharges in 2013 (Table 1, RR: 1.8 (1.7 - 1.9); P < 0.001).
In terms of race, white race was associated with the most discharges in 1997 (0.82/10,000) and 2013 (1.5/10,000) (RR: 1.83 (1.72 - 1.94); P < 0.001). However, there was a significant increase seen in the black population from 0.61/10,000 discharges in 1997 to 1.70/10,000 discharges in 2013 (RR: 2.76 (2.38 - 3.20); P < 0.001). Hispanic race also saw a significant increase over the study period (RR: 1.8 (1.5 - 2.2); P < 0.001).
In terms of socioeconomic status, a significant increase was seen in the third quartile ($48,000 - 62,999) group over the study period (RR: 2.3 (2.1 - 2.6); P < 0.001). Also, a significant decrease was seen in the high socioeconomic status group, i.e., fourth quartile ($63,000 or more) (RR: 2.03 (1.86 - 2.22); P < 0.001).
The relative frequency of achalasia discharges increased significantly for all forms of payment over the study span. Medicare had the highest frequency of discharges in 1997 with 0.95/10,000 discharges, whereas private insurance had the highest frequency of achalasia discharges in 2013 with 1.8/10,000 discharges in 2013.
A modified CCI was also calculated for patients admitted with achalasia. Mean CCI for discharges in 1997 was 2.2 ± 0.13 as compared to the mean CCI for in 2013 which was 2.5 ± 0.08. The difference was not statistically significant.
Hospitalizations for achalasia based on hospital characteristics
Non-metropolitan areas had similar frequencies of achalasia hospitalizations when compared to metropolitan areas (0.66/10,000 discharges vs. 0.77/10,000 discharges) in 1997. However, there was a significant difference noticed between them in 2013 with the non-metropolitan frequency remaining the same as 1997 (0.66/10,000 discharges) and the metropolitan frequency increasing significantly (0.7/10,000 discharges vs. 1.6/10,000 discharges) (Table 1).
The South had the highest absolute number of both achalasia discharges and total discharges when compared with those of other regions in both 1997 and 2013 (Table 1). However, the northeast region had the highest frequency of discharges both in 1997 with 0.9/10,000 discharges and in 2013 with 1.7/10,000 discharges (P < 0.001). The rate of achalasia discharges at least doubled for all regions.
In 1997, patients with achalasia were equally likely to be diagnosed in a hospital with a medium and a large bed size, whereas in 2013, patients with achalasia were more likely to be diagnosed in a hospital with a large bed size (1.8/10,000 discharges; P < 0.01; Table 1).
| Discussion | ▴Top |
Even though achalasia is a rare condition which is mostly managed in an outpatient setting, our study findings show that it is not an uncommon primary discharge diagnosis with more than 5,000 inpatient hospitalizations per year in the US in 2013. The number of discharges has more than doubled during our study period.
The highest number of achalasia discharges was in the age group 65 - 84 years in 1997 and in the age group 45 - 64 years in 2013. These findings suggest either earlier age onset of achalasia or patients seeking medical attention at an earlier age. Sonnerberg in his study in 2009 demonstrated a relatively stable distribution in different age groups over time with older age being associated with more hospitalizations [8]. It was also concluded that there was no variation by demographics, time or geography. In contrast, our study clearly shows a rise in hospitalizations in the 44 - 65 years age group with a decrease in all the other age groups. This difference could be due to the fact that our study period was longer allowing for a better understanding of the trends for achalasia. Another factor could be due to improvement in diagnostic technologies for achalasia which may have increased the diagnosis of achalasia.The rate of hospitalization in both men and women increased from 1997 to 2013; however, the distribution of disease was similar in both genders.
There has also been a significant increase in hospitalizations in black population over the study period. Enestvedt et al showed a non-significant differnce between white and non-white population regarding prevalence of achalasia; however, there was no mention of prevlance in black population exclusively [14].
Achalasia is also associated with significant health care costs. Our study shows that number of discharges and mean hospital charges per discharge increased significantly from 1997 to 2013. However, the mean length of hospital stay has decreased slightly over this time period.
Between 1997 and 2013, frequency of achalasia-related hospital discharges increased by 108% (from 2,493 to 5,195). It is difficult to assess the cause for this significant increase in the number of hospital admissions from our study, since the specific details of the admissions are not available in the NIS database. Possible causes include increase in the incidence of achalasia, increase in the incidence of complications from achalasia requring hospitalizations or an increase in the rate of surgical therapy, i.e., Heller myotomy [1, 15]. The increasing use of high resolution esopahegal manometry may have contributed to increasing recognition of cares.The average length of hospital stay due to achalasia-related discharges decreased marginally from 1997 to 2013. This could be explained by advances and improvement in the efficacy of treatments for achalasia.
However, the average hospital charges per patient increased substantially by 413.5%. This substantial increase in the costs could be driven by more number of patients undergoing surgical treatment for achalaisa (Heller myotomy) and increased rate of complications of the primary disease process (pneumonia, dehydration, and malnutrition) or related to its treatment (esophageal perforation).
Achalasia-related discharges increased for all types of payers during the study period. The increase was highest in the medicaid population. This substantial increase in medicaid population may be secondary to these patients being less likely to seek care at the onset of a health concern because of limited or hindered access to health care [16]. These patients tend to seek medical attention at an advanced stage ncessitating inpatient management rather than outpatient management. There was more pronounced increase in achalasia-related hospitalizations in metropolitan hospitals and larger hospitals compared to non-metroplitan and smaller hospitals resectively from 1997 to 2013. This could be explained by increasing density of population in metropolitan areas and treatment for achalasia being offered more preferentially in larger specialized hospitals.
One might argue that the findings of our analysis reflect the admissions for surgical management rather than for any other reasons. For this purpose, we queried into the NIS database for discharges related to the surgical management of achalasia. Since there are no ICD-9 codes which correlate to Heller’s myotomy or peroral endoscopic myotomy (POEM), we used the specific ICD-9 CM procedure code 42.7, which is the code for esophageal myotomy. We found that in 1997, there were 1,458 procedures done on achalasia patients (58.5%) and 3,755 procedures done on achalasia patients in 2013 (72.3%). Hence, we can conclude that there is significant increase in the number of patients being admitted to the hospital for other reasons such as medical management of complications.
Our study has several limitations inherent to the study database. Since this is an administrative database not a clinical database, patient specific informtation is not available. Hence details as to factors contributing to increased costs and increased number of discharges cannot be ascertained. Since it records hospitalizations but not each individual patient, it may result in either underestimation or overestimation of the incidence of achalasia-related discharges. In addition, there is no control over data entry errors. The geographic variations observed may be due to differences in access to healthcare and different patterns of healthcare utilizations in various populations. Despite these shortcomings, NIS database is designed to provide precise estimates of these uncommon diagnoses in the population.
In conclusion, both the number of inpatient discharges for achalasia and associated costs have significantly increased from 1997 to 2013 in the US. Inpatient costs associated with achalasia contribute significantly to the total healthcare bill. Further research on cost-effective evaluation and management of achalasia in the out-patient setting is required to reduce costs.
Author Contributions
Vaibhav Wadhwa: guarantor of the article. Vaibhav Wadhwa: study concept and design, acquisition of data, analysis and interpretation of data, and drafting of the manuscript. Rocio Lopez: acquisition of data, statistical analysis and interpretation of data. Prashanthi Thota: study concept and design, and drafting of the manuscript. Malav P. Parikh: study concept and design, drafting of the manuscript, critical review and editing of the manuscript. Madhusudhan R. Sanaka: study concept and design, drafting of the manuscript and critical revision of the manuscript. All authors approved the final version of the manuscript.
Disclosures
None of the authors have any potential conflicts relevant to the manuscript.
| References | ▴Top |
- Boeckxstaens GE, Zaninotto G, Richter JE. Achalasia. Lancet. 2014;383(9911):83-93.
doi - Richter JE, Boeckxstaens GE. Management of achalasia: surgery or pneumatic dilation. Gut. 2011;60(6):869-876.
doi pubmed - Vantrappen G, Hellemans J, Deloof W, Valembois P, Vandenbroucke J. Treatment of achalasia with pneumatic dilatations. Gut. 1971;12(4):268-275.
doi pubmed - Vaezi MF, Pandolfino JE, Vela MF. ACG clinical guideline: diagnosis and management of achalasia. Am J Gastroenterol. 2013;108(8):1238-1249; quiz 1250.
doi pubmed - Francis DL, Katzka DA. Achalasia: update on the disease and its treatment. Gastroenterology. 2010;139(2):369-374.
doi pubmed - Pandolfino JE, Kahrilas PJ. Presentation, diagnosis, and management of achalasia. Clin Gastroenterol Hepatol. 2013;11(8):887-897.
doi pubmed - Wang YR, Dempsey DT, Friedenberg FK, Richter JE. Trends of Heller myotomy hospitalizations for achalasia in the United States, 1993-2005: effect of surgery volume on perioperative outcomes. Am J Gastroenterol. 2008;103(10):2454-2464.
doi pubmed - Sonnenberg A. Hospitalization for achalasia in the United States 1997-2006. Dig Dis Sci. 2009;54(8):1680-1685.
doi pubmed - Molena D, Mungo B, Stem M, Feinberg RL, Lidor AO. Outcomes of esophagectomy for esophageal achalasia in the United States. J Gastrointest Surg. 2014;18(2):310-317.
doi pubmed - Molena D, Mungo B, Stem M, Lidor AO. Hospitalization for esophageal achalasia in the United States. World J Gastrointest Endosc. 2015;7(13):1096-1102.
doi pubmed - Sethi S, Wadhwa V, LeClair J, Mikami S, Park R, Jones M, Sethi N, et al. In-patient discharge rates for the irritable bowel syndrome - an analysis of national trends in the United States from 1997 to 2010. Aliment Pharmacol Ther. 2013;38(11-12):1338-1346.
doi pubmed - Sethi S, Mikami S, Leclair J, Park R, Jones M, Wadhwa V, Sethi N, et al. Inpatient burden of constipation in the United States: an analysis of national trends in the United States from 1997 to 2010. Am J Gastroenterol. 2014;109(2):250-256.
doi pubmed - Healthcare cost and utilization project online (internet), Rockville, MD: Agency for healthcare research and quality [cited 2015 May 5]. Available from: http://www.hcup-us.ahrq.gov/nisoverview.jsp.
- Enestvedt BK, Williams JL, Sonnenberg A. Epidemiology and practice patterns of achalasia in a large multi-centre database. Aliment Pharmacol Ther. 2011;33(11):1209-1214.
doi pubmed - O'Neill OM, Johnston BT, Coleman HG. Achalasia: a review of clinical diagnosis, epidemiology, treatment and outcomes. World J Gastroenterol. 2013;19(35):5806-5812.
doi pubmed - Temkin-Greener H. Medicaid families under managed care. Anticipated behavior. Med Care. 1986;24(8):721-732.
doi pubmed
This article is distributed under the terms of the Creative Commons Attribution Non-Commercial 4.0 International License, which permits unrestricted non-commercial use, distribution, and reproduction in any medium, provided the original work is properly cited.
Gastroenterology Research is published by Elmer Press Inc.