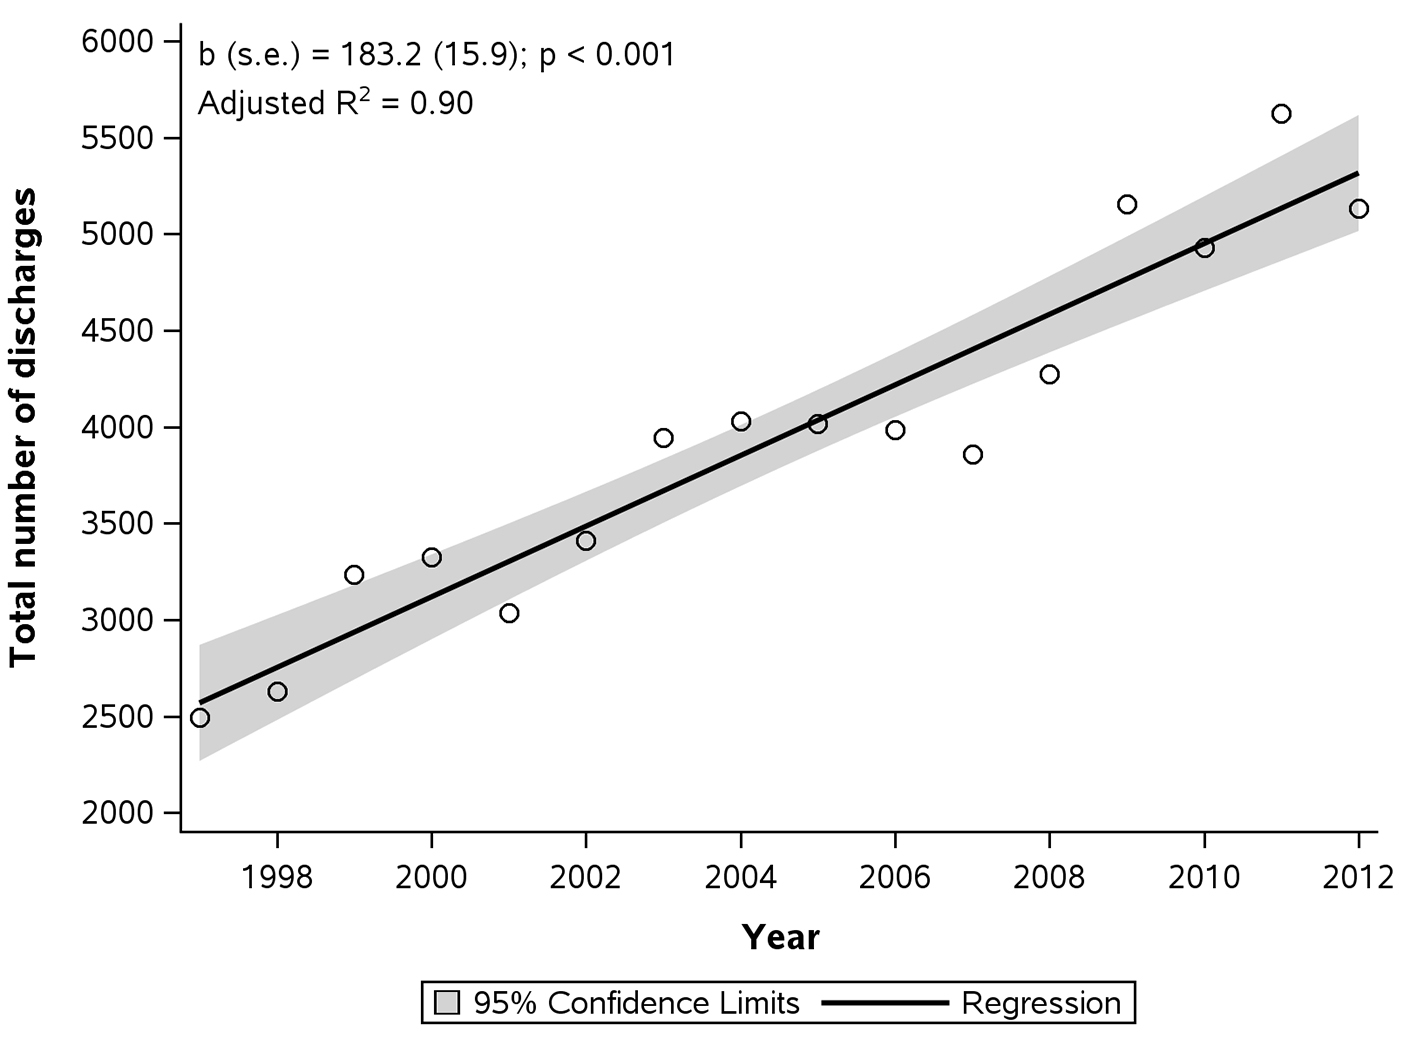
Figure 1. Total number of hospital discharges with principal diagnosis of achalasia.
| Gastroenterology Research, ISSN 1918-2805 print, 1918-2813 online, Open Access |
| Article copyright, the authors; Journal compilation copyright, Gastroenterol Res and Elmer Press Inc |
| Journal website http://www.gastrores.org |
Original Article
Volume 10, Number 2, April 2017, pages 70-77
Changing Trends in Age, Gender, Racial Distribution and Inpatient Burden of Achalasia
Figures
Table
| Factor | 1997 | 2013 | P-value | ||
|---|---|---|---|---|---|
| Achalasia | Achalasia per 10,000 discharges | Achalasia | Achalasia per 10,000 discharges | ||
| CCI: Charleston comorbidity index; SE: standard error. Data are presented as frequency (%) unless otherwise specified. | |||||
| Total discharges, n | 2,493 | 0.8 | 5,195 | 1.5 | |
| Age (years), mean ± SE | 58.0 ± 1.4 | 57.2 ± 0.71 | 0.39 | ||
| Age (years) | 0.017 | ||||
| < 1 | 8 (0.33) | 0.02 | 10 (0.19) | 0.02 | |
| 1 - 17 | 96 (3.9) | 0.54 | 160 (3.1) | 1.1 | |
| 18 - 44 | 664 (26.6) | 0.73 | 1,235 (23.8) | 1.4 | |
| 45 - 64 | 573 (23.0) | 0.92 | 1,715 (33.0) | 2 | |
| 65 - 84 | 833 (33.4) | 0.86 | 1,580 (30.4) | 1.6 | |
| 85+ | 319 (12.8) | 1.4 | 495 (9.5) | 1.7 | |
| Gender | 0.59 | ||||
| Male | 1,120 (44.9) | 0.82 | 2,255 (43.4) | 1.5 | |
| Female | 1,373 (55.1) | 0.7 | 2,940 (56.6) | 1.4 | |
| Race | 0.004 | ||||
| White | 1,569 (78.6) | 0.82 | 3,305 (68.2) | 1.5 | |
| Black | 221 (11.1) | 0.61 | 830 (17.1) | 1.7 | |
| Hispanic | 142 (7.1) | 0.59 | 435 (9.0) | 1.07 | |
| Other | 64 (3.2) | 0.57 | 275 (5.7) | 1.2 | |
| Primary payer | 0.4 | ||||
| Medicare | 1,146 (46.0) | 0.95 | 2,270 (43.7) | 1.6 | |
| Medicaid | 201 (8.1) | 0.37 | 460 (8.9) | 0.62 | |
| Private insurance | 979 (39.3) | 0.76 | 1,970 (37.9) | 1.8 | |
| Other | 167 (6.7) | 0.59 | 495 (9.5) | 1.5 | |
| Median household income (quartile) | < 0.001 | ||||
| 1 | 706 (29.8) | 0.66 | 1,325 (25.9) | 1.3 | |
| 2 | 518 (21.9) | 0.81 | 1,260 (24.6) | 1.4 | |
| 3 | 313 (13.2) | 0.66 | 1,290 (25.2) | 1.5 | |
| 4 | 830 (35.1) | 0.88 | 1,250 (24.4) | 1.8 | |
| Therapeutic interventions | |||||
| Esophageal dilation | 547 (22.0) | 710 (13.7) | < 0.001 | ||
| Heller myotomy | 1,458 | 3,755 | < 0.001 | ||
| Esophagectomy | 41 (1.6) | 110 (2.1) | 0.49 | ||
| CCI, mean ± SE | 2.2 ± 0.13 | 2.5 ± 0.08 | 0.078 | ||
| CCI | |||||
| 0 - 1 | 1,149 (46.1) | 0.66 | 2,280 (43.9) | 1.4 | |
| 2 - 3 | 609 (24.4) | 0.96 | 1,295 (24.9) | 1.8 | |
| 4 - 5 | 569 (22.8) | 0.88 | 1,025 (19.7) | 1.5 | |
| 6 - 7 | 148 (5.9) | 0.65 | 425 (8.2) | 1.2 | |
| 8+ | 19 (0.77) | 0.22 | 170 (3.3) | 0.95 | |
| Inflation-adjusted costs (2013 $) | 9,290.2 ± 672.3 | 47,706.9 ± 2933.3 | < 0.001 | ||
| Hospital region | 0.77 | ||||
| Northeast | 607 (24.4) | 0.89 | 1,160 (22.3) | 1.7 | |
| Midwest | 500 (20.0) | 0.65 | 1,185 (22.8) | 1.5 | |
| South | 878 (35.2) | 0.71 | 1,745 (33.6) | 1.3 | |
| West | 508 (20.4) | 0.8 | 1,105 (21.3) | 1.6 | |
| Hospital bed size | < 0.001 | ||||
| Small | 302 (12.2) | 0.57 | 470 (9.0) | 0.96 | |
| Medium | 860 (34.6) | 0.78 | 955 (18.4) | 1 | |
| Large | 1,322 (53.2) | 0.79 | 3,770 (72.6) | 1.8 | |
| Hospital location | < 0.001 | ||||
| Non-metropolitan | 339 (13.6) | 0.66 | 275 (5.3) | 0.7 | |
| Metropolitan | 2,144 (86.4) | 0.77 | 4,920 (94.7) | 1.6 | |
| Hospital teaching status | < 0.001 | ||||
| Non-teaching hospital | 1,216 (49.0) | 0.58 | 1,390 (26.8) | 0.81 | |
| Teaching hospital | 1,267 (51.0) | 1.04 | 3,805 (73.2) | 2.1 | |