

| Gastroenterology Research, ISSN 1918-2805 print, 1918-2813 online, Open Access |
| Article copyright, the authors; Journal compilation copyright, Gastroenterol Res and Elmer Press Inc |
| Journal website https://www.gastrores.org |
Original Article
Volume 16, Number 6, December 2023, pages 318-333

Identifying Key Genes to the Early Diagnosis of Inflammatory Bowel Disease by Integrating Analysis at the Blood and Tissue Levels
Xin Yu Wanga, Dan Zhanga, b
aKey Laboratory of Medical Electrophysiology, Ministry of Education & Medical Electrophysiological Key Laboratory of Sichuan Province, Institute of Cardiovascular Research, Southwest Medical University, Luzhou 646000, China
bCorresponding Author: Dan Zhang, Key Laboratory of Medical Electrophysiology, Ministry of Education & Medical Electrophysiological Key Laboratory of Sichuan Province, Institute of Cardiovascular Research, Southwest Medical University, Luzhou 646000, China
Manuscript submitted November 2, 2023, accepted December 9, 2023, published online December 28, 2023
Short title: Biomakers and Mechanism of IBD
doi: https://doi.org/10.14740/gr1683
| Abstract | ▴Top |
Background: Inflammatory bowel disease (IBD) encompasses Crohn’s disease (CD) and ulcerative colitis (UC), is challenging to diagnose, and frequently relapses, significantly affecting patients’ quality of life. Despite extensive efforts, the pathogenesis of IBD remains unclear.
Methods: In this study, we integrated bioinformatics analysis and animal disease model to investigate IBD from two dimensions to identify potential diagnostic biomarkers and explore the pathogenesis of distinct conditions at tissue-specific levels.
Results: Firstly, we identified dysferlin (DYSF) and C-X-C motif chemokine ligand 2 (CXCL2) as crucial biomarkers for IBD, with 11 and 13 putative biomarkers for CD and UC, respectively, identified by peripheral blood testing only. CXCL8 and S100 calcium-binding protein A8 (S100A8) were determined to be critical hub genes and validated by real-time polymerase chain reaction (RT-PCR). Secondly, in CD, the differentially expressed genes (DEGs) were mainly associated with immunity based on Gene Ontology (GO) and Kyoto Encyclopedia of Genes and Genomes (KEGG) pathways, while the metabolism of multiple substances and substance transport activity were dominant in UC. Thirdly, essential genes in the pathological progression of CD and UC were identified through protein-protein interaction networks and molecular complex detection (MCODE) analysis. Finally, pathological examination and quantitative analysis of IBD models confirmed the above results.
Conclusions: Our findings could contribute to understanding the molecular mechanism of IBD, hold clinical significance for early diagnosis and prevention, and provide effective targets for treating IBD.
Keywords: Inflammatory bowel disease; Crohn’s disease; Ulcerative colitis; Differentially expressed genes; Integrated analysis; IBD models
| Introduction | ▴Top |
Crohn’s disease (CD) and ulcerative colitis (UC) are two prominent manifestations of inflammatory bowel disease (IBD), which are chronic, recurrent inflammatory disorders caused by complex factors such as genetic influences, the immune system, and environmental factors [1, 2]. The incidence and prevalence of IBD in high-incidence areas such as northern Europe and North America are beginning to stabilize, while low-incidence areas such as southern Europe, Asia, and much of the developing world continue to see a rise in IBD cases [3, 4]. Recent evidence indicates a close relationship between IBD and most human cancers’ development and malignant progression. For example, IBD predisposes patients to colorectal cancer (CRC), one of the most frequent and fatal cancers worldwide [5]. Although IBD shares some clinical and demographic characteristics, such as abdominal pain, rectal bleeding, diarrhea, severe internal muscle spasms, vomiting, and weight loss, critical differences in tissue damage and prognosis suggest distinctive pathogenic processes [6]. UC is a chronic immune-mediated inflammatory disease whose pathogenesis is unclear. The pathological changes mainly occur in the mucosa and submucosa of the rectum and colon, often associated with rectum inflammation but usually extending proximally to other areas of the colon [7]. In contrast, CD is a chronic complex inflammatory disease that involves the digestive tract from the mouth to the anus and has a segmental or leaping distribution. The inflammation in CD, characterized by segmental asymmetry, penetrates from the mucosal layer of the intestine to the serous layer [2, 8]. The most striking difference between UC and CD is that UC is characterized by relapsing and remitting mucosal inflammation extending from the rectum to proximal colon segments. By contrast, CD may impact the entire digestive tract and cause transmural inflammation [9, 10].
Currently, the diagnosis of UC and CD mainly depends on endoscopy and pathology. However, distinguishing between CD and UC poses a challenge due to their atypical clinical manifestations, ambiguous endoscopy results, and limited biopsy depth under enteroscopy [11]. Therefore, more efficient and accurate diagnosis technology is urgently needed. Molecular markers that are accurate and specific have the potential to be used as differentiators for diagnosing and monitoring IBD activity and could be more convenient and less invasive than colonoscopy. Furthermore, minimally invasive interventions to screen and monitor disease activity and therapeutic efficacy using peripheral blood could benefit patients [12]. With the continuous development of bioinformatics and molecular biology, gene chips have played an increasingly important role in life science. Microarray technology, in particular, has been widely explored in various diseases’ molecular mechanisms [13, 14]. The regulation of homeostasis between the intestinal epithelial cells, mucosal surface, and the immune system that contributes to exacerbated inflamed response is less well characterized. The posterior knowledge of the global “omics” approach would benefit from exploring emerging causal and reactive genes and proteins.
Genetic studies have found some potential genetic susceptibility sites for IBD. Some mutations are common risk factors for IBD, while others are specific risk factors for CD or UC. For example, nucleotide-binding oligomerization domain-containing protein 2 (NOD2)/caspase activation and recruitment domain 15 (CARD15) and leucine-rich repeat (LRR) genes are only related to CD but not UC, while DRB1 has been identified as a candidate gene for UC [15]. The risk of CD in individuals with only one copy defect of the NOD2 gene was 2 - 4 times higher than that in normal individuals, while that in homozygous individuals was 30 times higher [16]. Although significant efforts have been made to discover the treatment and pathogenesis of IBD, the present knowledge seems insufficient. Previous studies mainly focused on comparing CD and UC in the same tissue. There are few integrated analyses for horizontal comparisons between tissues.
This study aimed to identify efficient biomarkers that a blood test could detect CD and UC and explore communal and separate mechanisms of the two conditions. We investigated the characteristics and interactions of the differentially expressed genes (DEGs) in tissue-specific and disease-specific contexts by combining the experiments with comprehensive bioinformatics analysis. Additionally, drug-induced IBD mice models were used to verify our findings. The present research will provide further insight into the pathogenesis of CD and UC at the molecular level, which may provide potential molecular targets for IBD and provide the molecular basis for diagnosis and gene therapy.
| Materials and Methods | ▴Top |
Acquisition of gene expression profiling data
The Gene Expression Omnibus (GEO) database stores abundant original records and curated datasets. We used the keywords “IBD blood/PBMC” and “IBD mucosa” to search on the GEO datasets in the NCBI database for attaining datasets of blood and mucosal samples, respectively. Finally, gene expression profiling data with the series numbers GSE3365, GSE75214, and GSE1141 were obtained and screened from the GEO database. The GSE3365 dataset (called blood) was from 137 blood samples in platform GPL96 (hgu133a) and contained 59 CD, 26 UC, and 42 normal individuals [17]. The GSE75214 dataset (called mucosa-1) was from 197 mucosa samples in platform GPL6244 (hugene10sttranscriptcluster) and consisted of 97 UC, 75 CD, and 22 normal samples [18]. The GSE1141 dataset (called mucosa-2) was also from mucosa samples in platform GPL96 (hgu133a) and contained two CD, two UC, and two normal individuals [19]. We downloaded the mucosa sample data from two datasets, GPL96 and GPL6244, to eliminate the impact of the sampling locations and sequencing platform. The dataset information is shown in Table 1 [17-19]. The R software package was used to process the downloaded files and to convert and reject the unqualified data [20].
 Click to view | Table 1. Details for GEO Data |
Identification of DEGs
We downloaded the matrix files, platform, and annotation information from GEO datasets. At first, the data were calibrated, standardized, and log2 transformed. After removing the gene segment without a corresponding probe set and the duplicate probes, we used the bioinformatic dataset and R packages to annotate the expression matrix. Then, delete the probe corresponding to more than one gene and keep the probe with the highest expression if it corresponds to more than one gene. The DEGs were identified using the “limma” package in R language, which is based on a Bioconductor specially used for processing chip data of expression spectrum [21]. The cut-off criteria of |fold change| > 1.5 and adj.P < 0.05 were considered statistically significant. DEGs were screened in the blood and mucosal tissues of CD and UC, respectively.
Principal component analysis (PCA) and heatmap of DEGs
We performed PCA based on the identified DEGs. A volcano plot was drawn using the “EnhancedVolcano” package in R software, and the top DEGs were highlighted [22]. Heat maps of DEGs in different diseases were drawn using the “pheatmap” package in R software [20].
Gene Ontology (GO) and Kyoto Encyclopedia of Genes and Genomes (KEGG) enrichment analysis of DEGs
GO analysis provides biological processes (BPs), cellular components (CCs), and molecular functions (MFs) of the target genes [23]. KEGG is one of the most commonly used biological information databases in the world, which helps to study genes and expression information as a whole network. To analyze the screened DEGs at the functional and pathway levels, we performed GO and KEGG pathway analyses to highlight the most relevant GO terms and signaling pathways associated with DEGs using the “clusterProfiler” package in R language [24]. A corrected P-value < 0.05 was considered to indicate a statistically significant difference.
Network construction and molecular complex detection (MCODE) analysis
A protein-protein interaction (PPI) network analysis was used to further evaluate the functional interactions among DEGs. The STRING database [25] is a software system that identifies known and predicted proteins’ interactions. The present study’s PPI analysis of DEGs was based on the STRING database and was presented using Cytoscape v.3.6.1 [26]. An interaction with a combined score of > 0.4 was considered statistically significant. The MCODE (version 1.4.2) Cytoscape plugin allows the clustering of a given network based on the topology to identify densely connected regions. The top modules of the PPI networks for CD and UC were selected using the selection criteria: “degree cut-off = 2, node score cut-off = 0.2, max depth = 100, and k-score = 2”. For two mucosa sample datasets, we used separate datasets and the intersection of the DEGs to construct the PPI networks for CD and UC, respectively.
Mice and diet in experimental design
Thirty 8-week-old male C57BL/6 mice weighing 20 ± 2 g were included in this study (Animal Center of Southwest Medical University). The animals were maintained under standard conditions (with a temperature of 26 °C, 12 h/12 h light/dark cycle, and adequate diet and water). Throughout the experiment, the mice were randomly divided into three groups: the control group, the trinitrobenzene sulfonic acid (TNBS) group, and the dextran sulfate sodium salt (DSS) group; each group had at least 10 mice. The 3% DSS drinking water was prepared with sterile water and filtered with a 0.22 µm filter membrane. The mice were fed with DSS for 7 days until significant weight loss. The TNBS group fasted for 12 h before the operation and drank freely. When the mice were anesthetized with isoflurane, a silica gel tube with a diameter of 1 mm and a length of about 5 cm was gently inserted from the anus, and 50% ethanol solution containing 150 mg/kg TNBS was slowly pushed into the colon to induce CD. The mouse’s tail was lifted after injection and kept inverted for 30 s to ensure that the injected TNBS solution could diffusely distribute in the large intestine, repeated for 14 days. The control group was given water for 14 days. Each mouse’s weight, diarrhea, and bleeding were recorded simultaneously daily. The experiment finished, mice were all sacrificed by cervical dislocation, and colonic biopsies were taken for macroscopic scoring, histopathological examination, and biochemical studies.
Histological analysis
The colon was washed with phosphate-buffered saline and fixed in 4% formaldehyde. Then, the fixed colons were embedded in paraffin and cut into 5 µm sections. Histopathological examination was performed using the sections stained with hematoxylin and eosin (H&E). The assessment criteria of the histological score were according to a previous protocol in Supplementary Material 1 (www.gastrores.org) [27].
Quantitative real-time polymerase chain reaction (qRT-PCR)
Total RNA was extracted from a fresh colon sample with Trizol reagent (Invitrogen Life Technologies Co., Ltd, USA) following the manufacturer’s protocol. cDNA was generated using a Takara RT-PCR kit, and qRT-PCR was performed following standard procedures. Relative mRNA expression of genes was estimated using the 2-ΔΔCt method and normalized using the housekeeper gene glyceraldehyde-3-phosphate dehydrogenase (GAPDH) as an internal control. The specific primers used for C-X-C motif chemokine ligand 8 (CXCL8) were: forward primer 5'-cagccttcctgatttctgc-3' and reverse primer 5'-acttctccacaaccctctgc-3'. The primers for S100 calcium-binding protein A8 (S100A8) were: forward primer 5'-caaggaaatcaccatgccctc-3' and reverse primer 5'-tttgtgagatgccacacccact-3'. The primers for GAPDH were: forward 5'-aggtcggtgtgaacgatttg-3' and reverse primer 5'-ggggtcgttgatggcaaca-3'.
Data analysis of H&E and qRT-PCR
Experimental data were analyzed using GraphPad Prism 7 and presented as mean ± standard deviation (SD) (La Jolla, CA, USA). Differences between the three groups were analyzed by one-way analysis of variance (ANOVA) followed by a post hoc test (Bonferroni) for body weight and H&E scoring. Unpaired Student’s t-test was employed to compare relative quantifying gene expression for CXCL8 and S100A8, respectively. P-values < 0.05 were considered significant.
Ethics
All animal welfare and experimental procedures were under the approval of the ethical regulations of Southwest Medical University (Permission number: 2020324). Animals cared for in the National Research Council’s Guide for the Care and Use of Laboratory Animals.
| Results | ▴Top |
Microarray data information and identification of DEGs in CD and UC
The different disease-specific samples of blood and mucosa expression microarray datasets, GSE3365, GSE75214, and GSE1141, were standardized, and the results are shown in Supplementary Material 2 (www.gastrores.org). The “limma” package was used to screen DEGs in three datasets. As presented in Figure 1a, b, 955 DEGs, including 502 up-regulated and 453 down-regulated DEGs, were identified in the CD group using the threshold of |fold change| > 1.5 and P-value < 0.05. Similarly, 572 DEGs (328 up- and 244 down-regulated) were identified in the UC group using the same criteria. The two diseases shared 350 DEGs in blood samples (Fig. 1c). For the mucosa samples, 963 DEGs (642 up- and 321 down-regulated) were screened in the CD group. At the same time, 2,192 DEGs (1,214 up- and 978 down-regulated) were identified in the UC group in the GSE75214 dataset (Fig. 1d, e). Analogously, 1,361 DEGs (699 up- and 662 down-regulated) were screened in the CD group. Moreover, 811 DEGs (344 up- and 467 down-regulated) were filtered in the UC group from the GSE1141 dataset (Fig. 1g, h). In addition, the gene expression in the three microarray datasets is shown in Supplementary Material 2 (www.gastrores.org). The CD group shared 708 and 365 DEGs with the UC group in the two mucosa datasets (Fig. 1f, i).
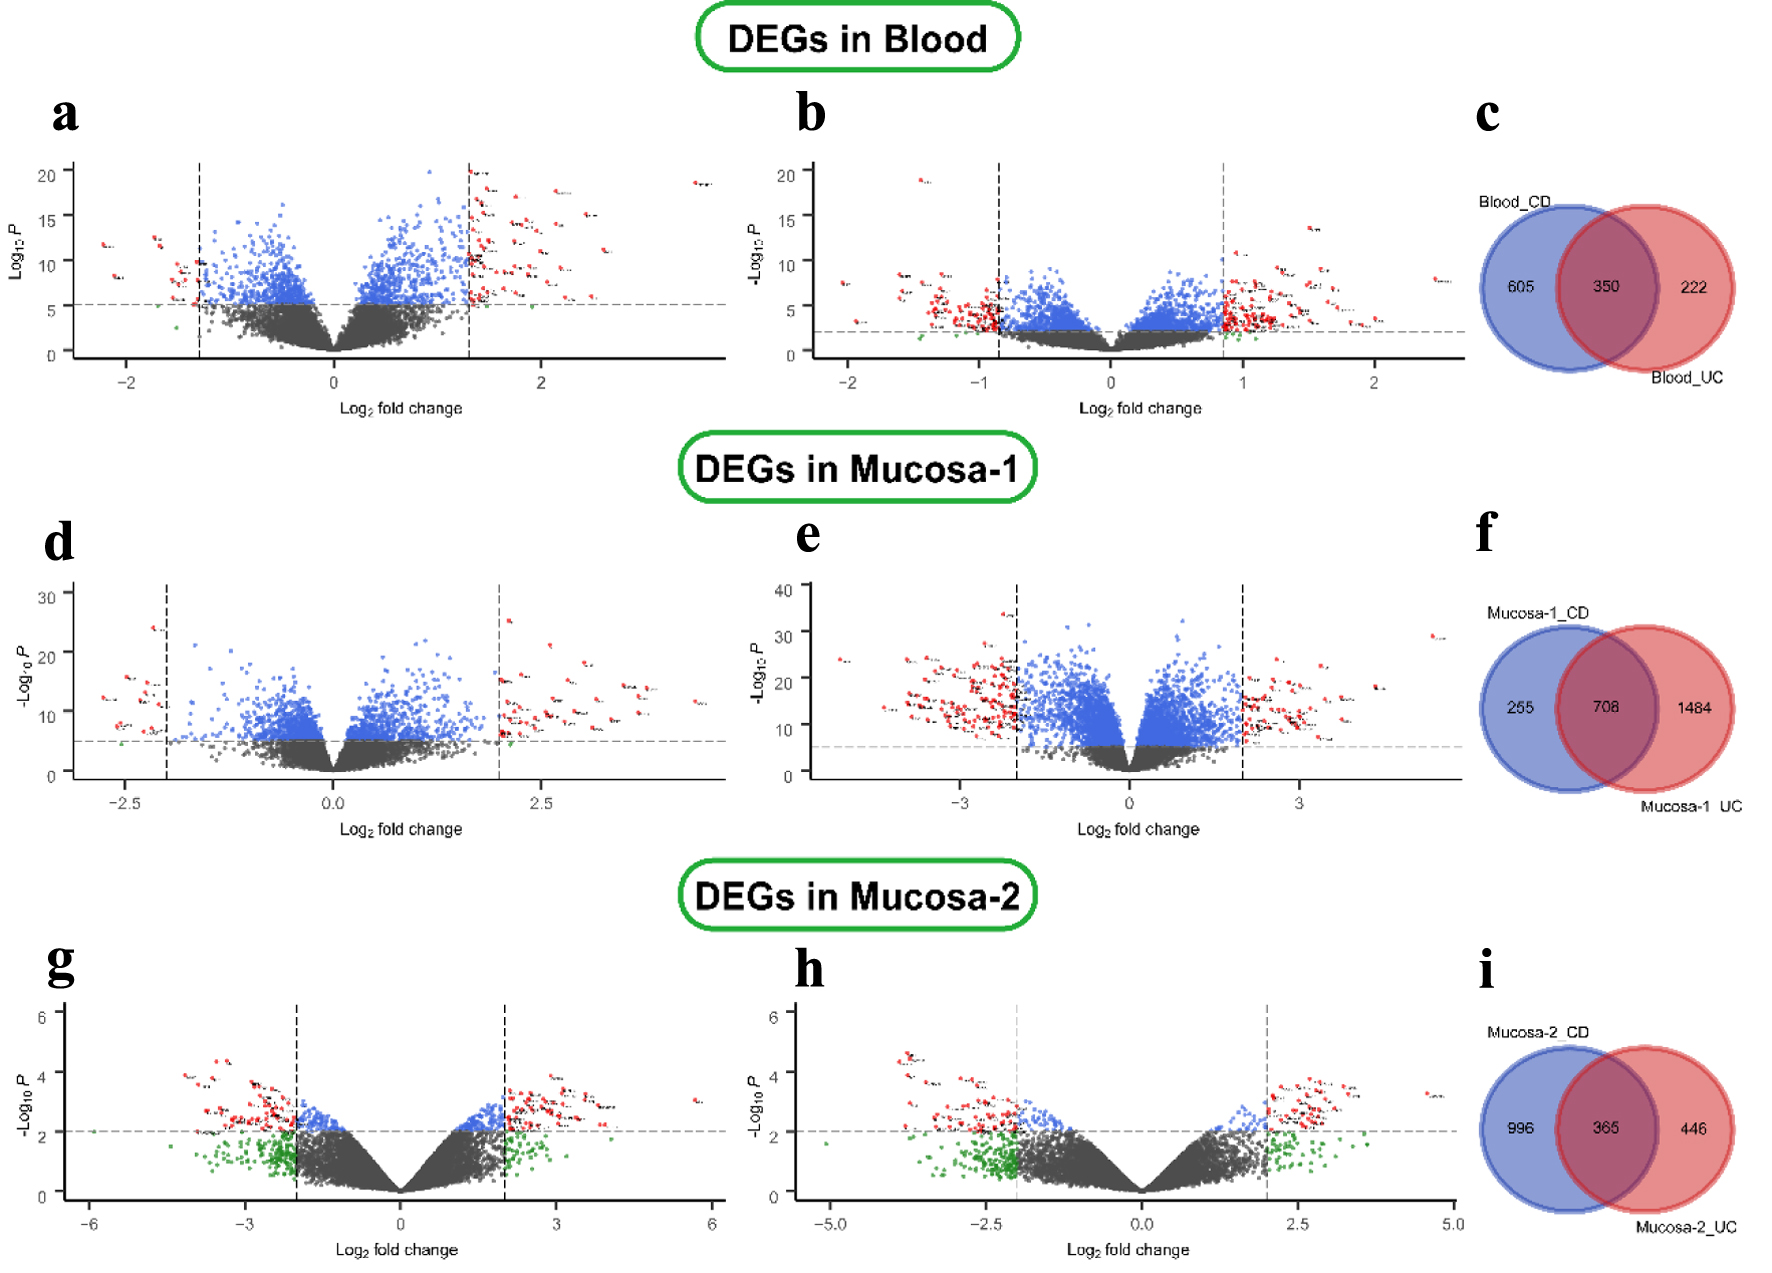 Click for large image | Figure 1. Differential expression genes in CD and UC from three datasets. (a) GSE3365 data in the blood CD samples, (b) UC samples, (d, e) GSE75214 data in the mucosa, and (g, h) GSE1141 data in the mucosa. The red points represent DEGs screened based on |log2 fold change| ≥ 1 and a corrected P-value of < 0.05. The green points represent DEGs screened based on |log2 FC| > cut-off, and the blue points represent DEGs screened based on a corrected P-value < 0.05. The black points represent genes with no significant difference. (c, f, i) Shared and specific DEGs of CD and UC in the blood (c), in mucosa-1 (f), and in mucosa-2 (i). CD: Crohn’s disease; DEGs: differentially expressed genes; UC: ulcerative colitis. |
The heatmap and PCA of DEGs
The cluster heatmaps of the top DEGs are shown in Supplementary Material 3, 4 (www.gastrores.org). PCA analysis of all sampled individuals from three datasets showed that IBD and normal tissues could be roughly divided into two groups in both diseases. In comparison, the mucosal samples were more distinct than the blood samples in CD and UC, shown in Supplementary Material 5 (www.gastrores.org), which provided additional corroborative evidence for the shared DEGs in blood and two mucosa tissues (Supplementary Material 3, 4, www.gastrores.org).
GO and KEGG pathway enrichment analysis of DEGs
To further obtain a systematic characterization and explore DEGs’ functions and related pathways at the disease-specific and tissue-specific levels, GO enrichment and KEGG pathway analysis were performed using the “clusterProfiler” package in R [24]. To perform the enrichment analysis, we screened the DEGs with |log2 fold change| ≥ 1 and P-value < 0.05. The detailed results are shown in Figures 2 and 3. In the blood samples, the GO terms of DEGs in CD resembled the UC group, mainly enriched to activate leukocyte and neutrophil response to inflammation (Figs. 2a and 3a). Except for four shared KEGG pathways in two diseases, more specific KEGG pathways were identified in the CD group, including neutrophil extracellular trap formation, nuclear factor kappaB (NF-κB), and tumor necrosis factor (TNF) signaling pathways. The enriched top GO terms and KEGG pathways did not exhibit significant differences between CD and UC in blood samples (Figs. 2b and 3b).
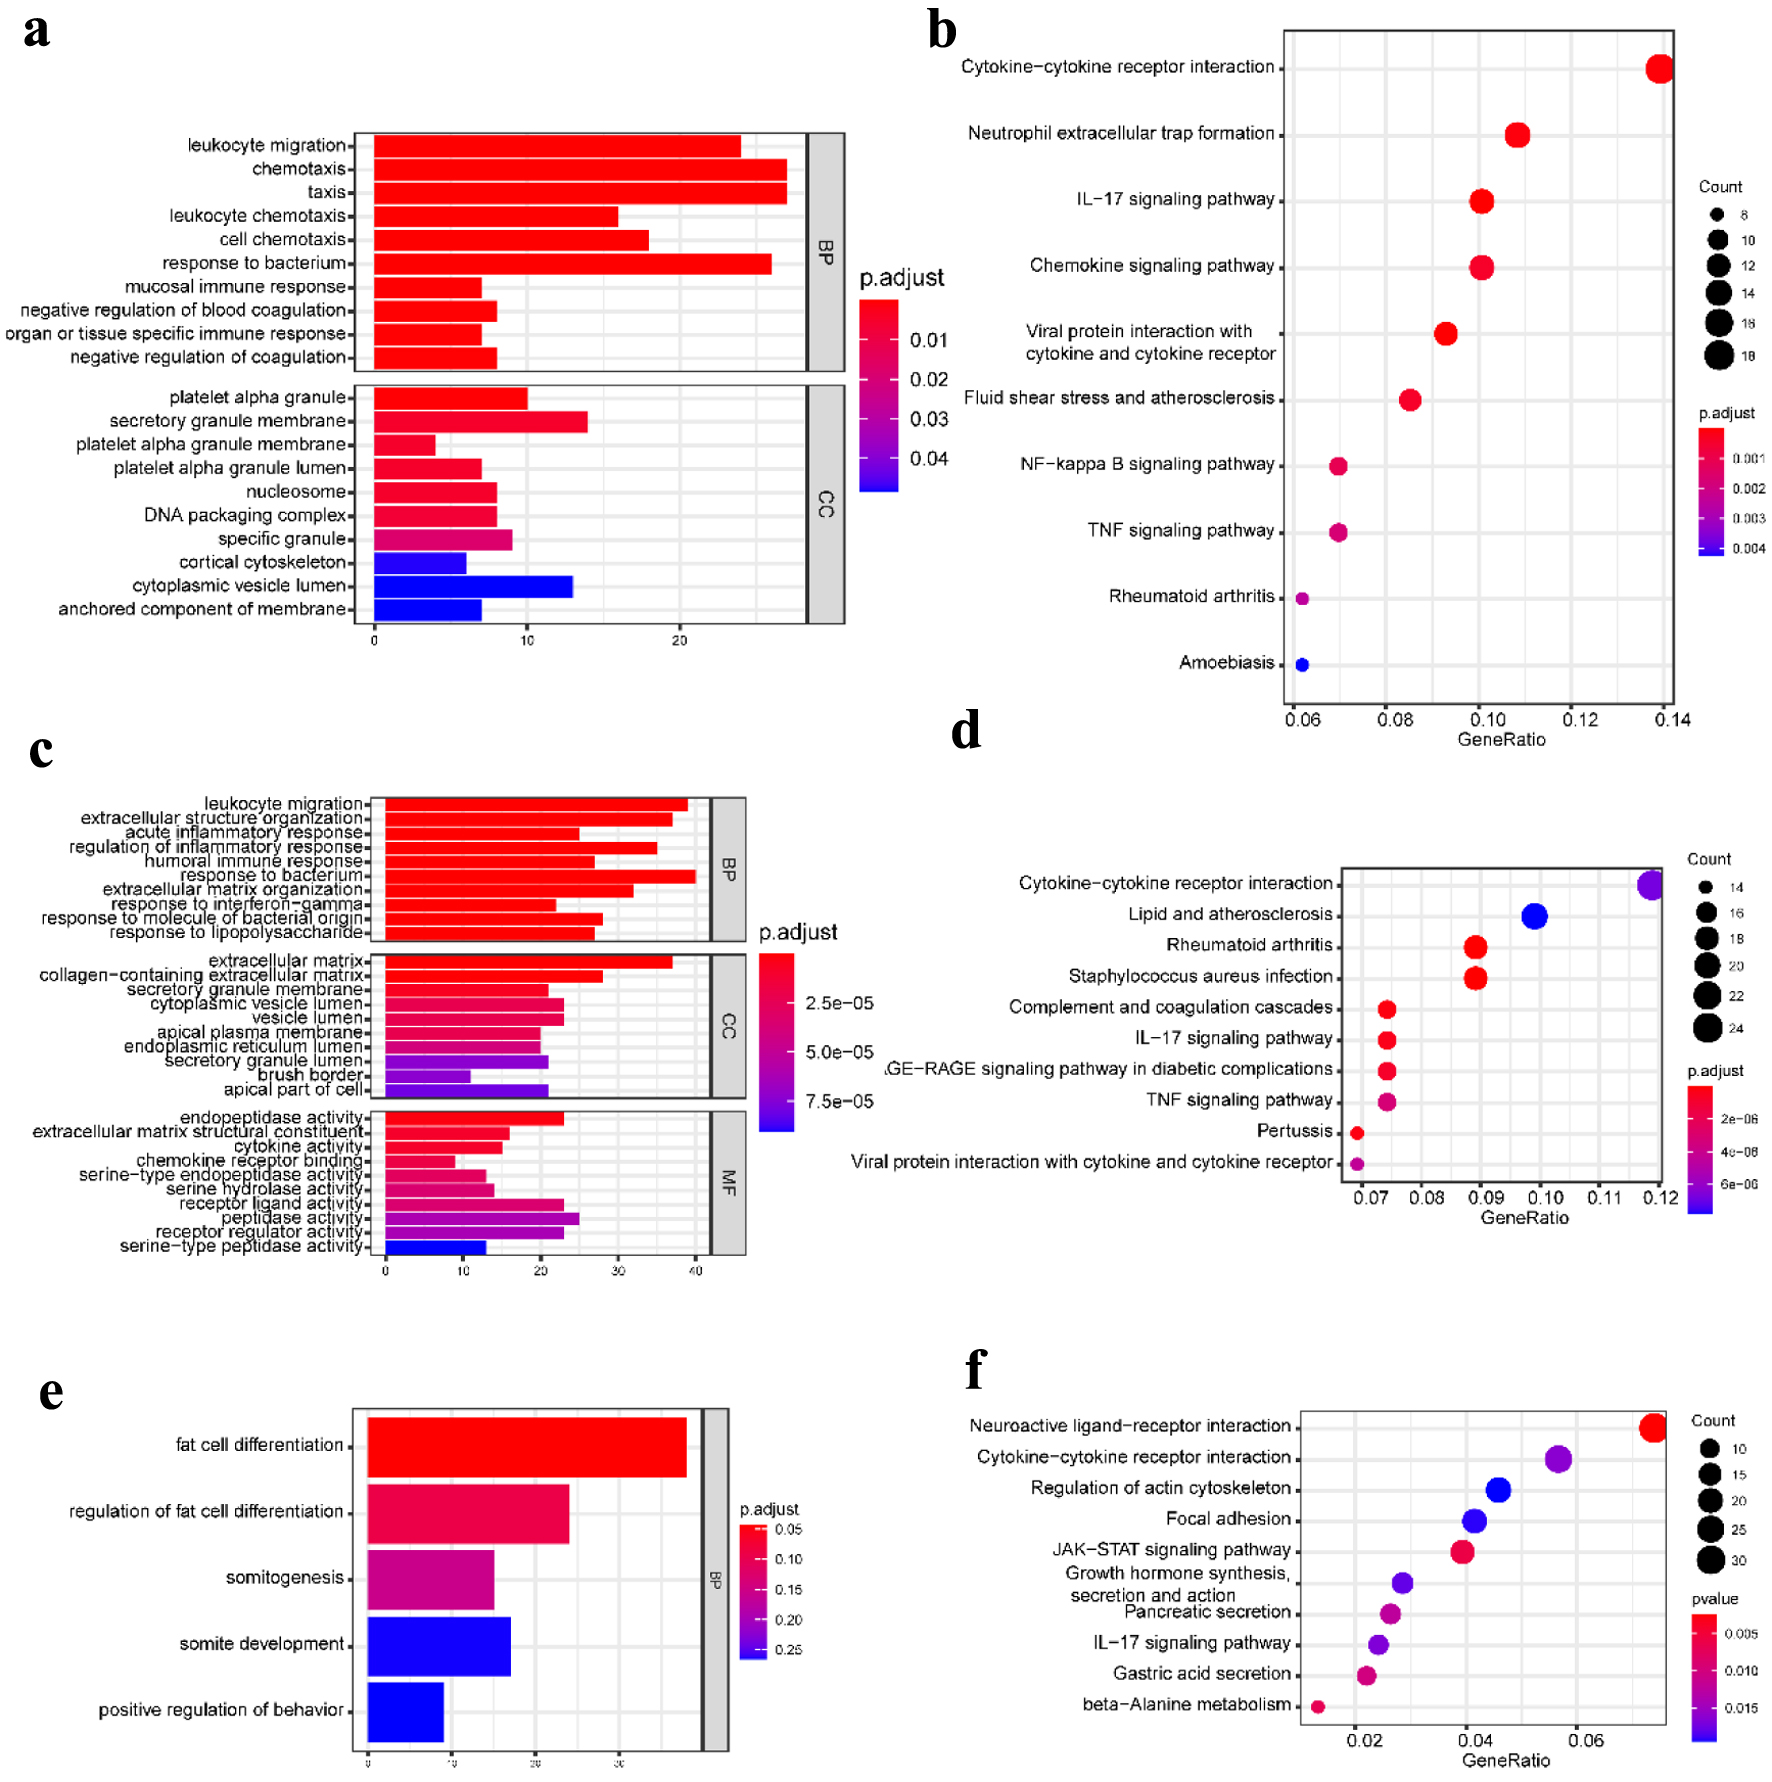 Click for large image | Figure 2. GO functional enrichment and KEGG pathway analysis of the significant DEGs in the CD group. (a) The top 10 GO terms in BP and CC, and (b) the top 10 KEGG pathways in the blood (dataset GSE3365). (c) The top 10 GO terms in BP, CC, and MF, respectively, and (d) the top 10 KEGG pathways in the mucosa-1 (dataset GSE75214). (e) The most significant GO terms and (f) the top 10 KEGG pathways in the mucosa-2 (dataset GSE1141). The vertical axis represents the GO or KEGG pathway terms significantly enriched by the DEGs; the horizontal axis indicates the negative Log10 (P-value). GO: Gene Ontology; KEGG: Kyoto Encyclopedia of Genes and Genomes; DEGs: differentially expressed genes; BP: biological progress; CC: cellular component; MF: molecular function; CD: Crohn’s disease. |
 Click for large image | Figure 3. GO functional enrichment and KEGG pathway analysis of the significant DEGs in the UC group. (a) The top 10 GO terms in BP and CC and (b) the top 10 KEGG pathways in the blood (dataset GSE3365). (c) The top 10 GO terms in BP, CC, and MF, and (d) the top 10 KEGG pathways in the mucosa-1 (dataset GSE75214). (e) The most significant GO terms and (f) the significant KEGG pathways in the mucosa-2 (dataset GSE1141). The vertical axis represents the GO or KEGG pathway terms significantly enriched by the DEGs; the horizontal axis indicates the negative Log10 (P-value). GO: Gene Ontology; KEGG: Kyoto Encyclopedia of Genes and Genomes; DEGs: differentially expressed genes; BP: biological progress; CC: cellular component; MF: molecular function; UC: ulcerative colitis. |
Our work studied two mucosa datasets (mucosa-1 was based on GSE75214; mucosa-2 was based on GSE1141). In the mucosa-1 dataset, the CD and UC groups shared three GO terms in biological processes, including leukocyte migration, extracellular structure organization, and response to the bacterium. While acute inflammatory response, regulation of inflammatory response, and humoral immune response were enriched in CD, monocarboxylic acid metabolic process and wound healing were particular to the UC group. In terms of cellular components and molecular functions, there were shared and individually specific GO terms in the CD and UC group (Figs. 2c and 3c). In the mucosa-2 dataset, the GO terms demonstrated the possible relevance and importance of fat cell differentiation in CD and G protein-coupled receptor activity in UC (Figs. 2e and 3e).
For the KEGG analysis, three datasets shared two main inflammatory pathways, cytokine-cytokine receptor interaction and interleukin-17 (IL-17) signaling pathway in the CD group. In addition, different immune-related diseases and pathways were identified. By contrast, the results showed that the KEGG pathways in UC were mainly concentrated in protein digestion and absorption, various digestive juice production, and substance metabolism pathways (Figs. 2d, f and 3d, f).
Therefore, the communal GO terms and KEGG pathways were identified in CD and UC, indicating that they have similar pathological characteristics; however, more specific results suggest different pathogenic mechanisms between CD and UC.
Construction of PPI network and module analysis
The DEGs in CD and UC from different tissues were screened out using the STRING database to construct PPI networks; with the application of the MCODE plugin of Cytoscape, the top modules of the PPI networks for CD and UC at tissue-specific level samples were selected. The 955 DEGs of CD in blood were mapped to the PPI network and visualized by Cytoscape software. Only the remaining connected nodes, a complex network with 131 nodes and 591 edges, were constructed (Fig. 4a). With the application of the MCODE plugin of Cytoscape, we identified five significant modules in CD, as shown in Figure 4b. Several important inflammatory factors and related receptors were identified in module 1, with 18 nodes and 134 edges. The detailed results of the other four modules are seen in Figure 4b. However, 572 DEGs were used to construct the network in the UC group. The network contained 43 nodes and 108 edges, and the most significant module was obtained using MCODE (Fig. 4c). It included three modules, with eight nodes and 26 edges in module 1, six nodes and 14 edges in module 2, and four nodes and six edges in module 3 (Fig. 4d).
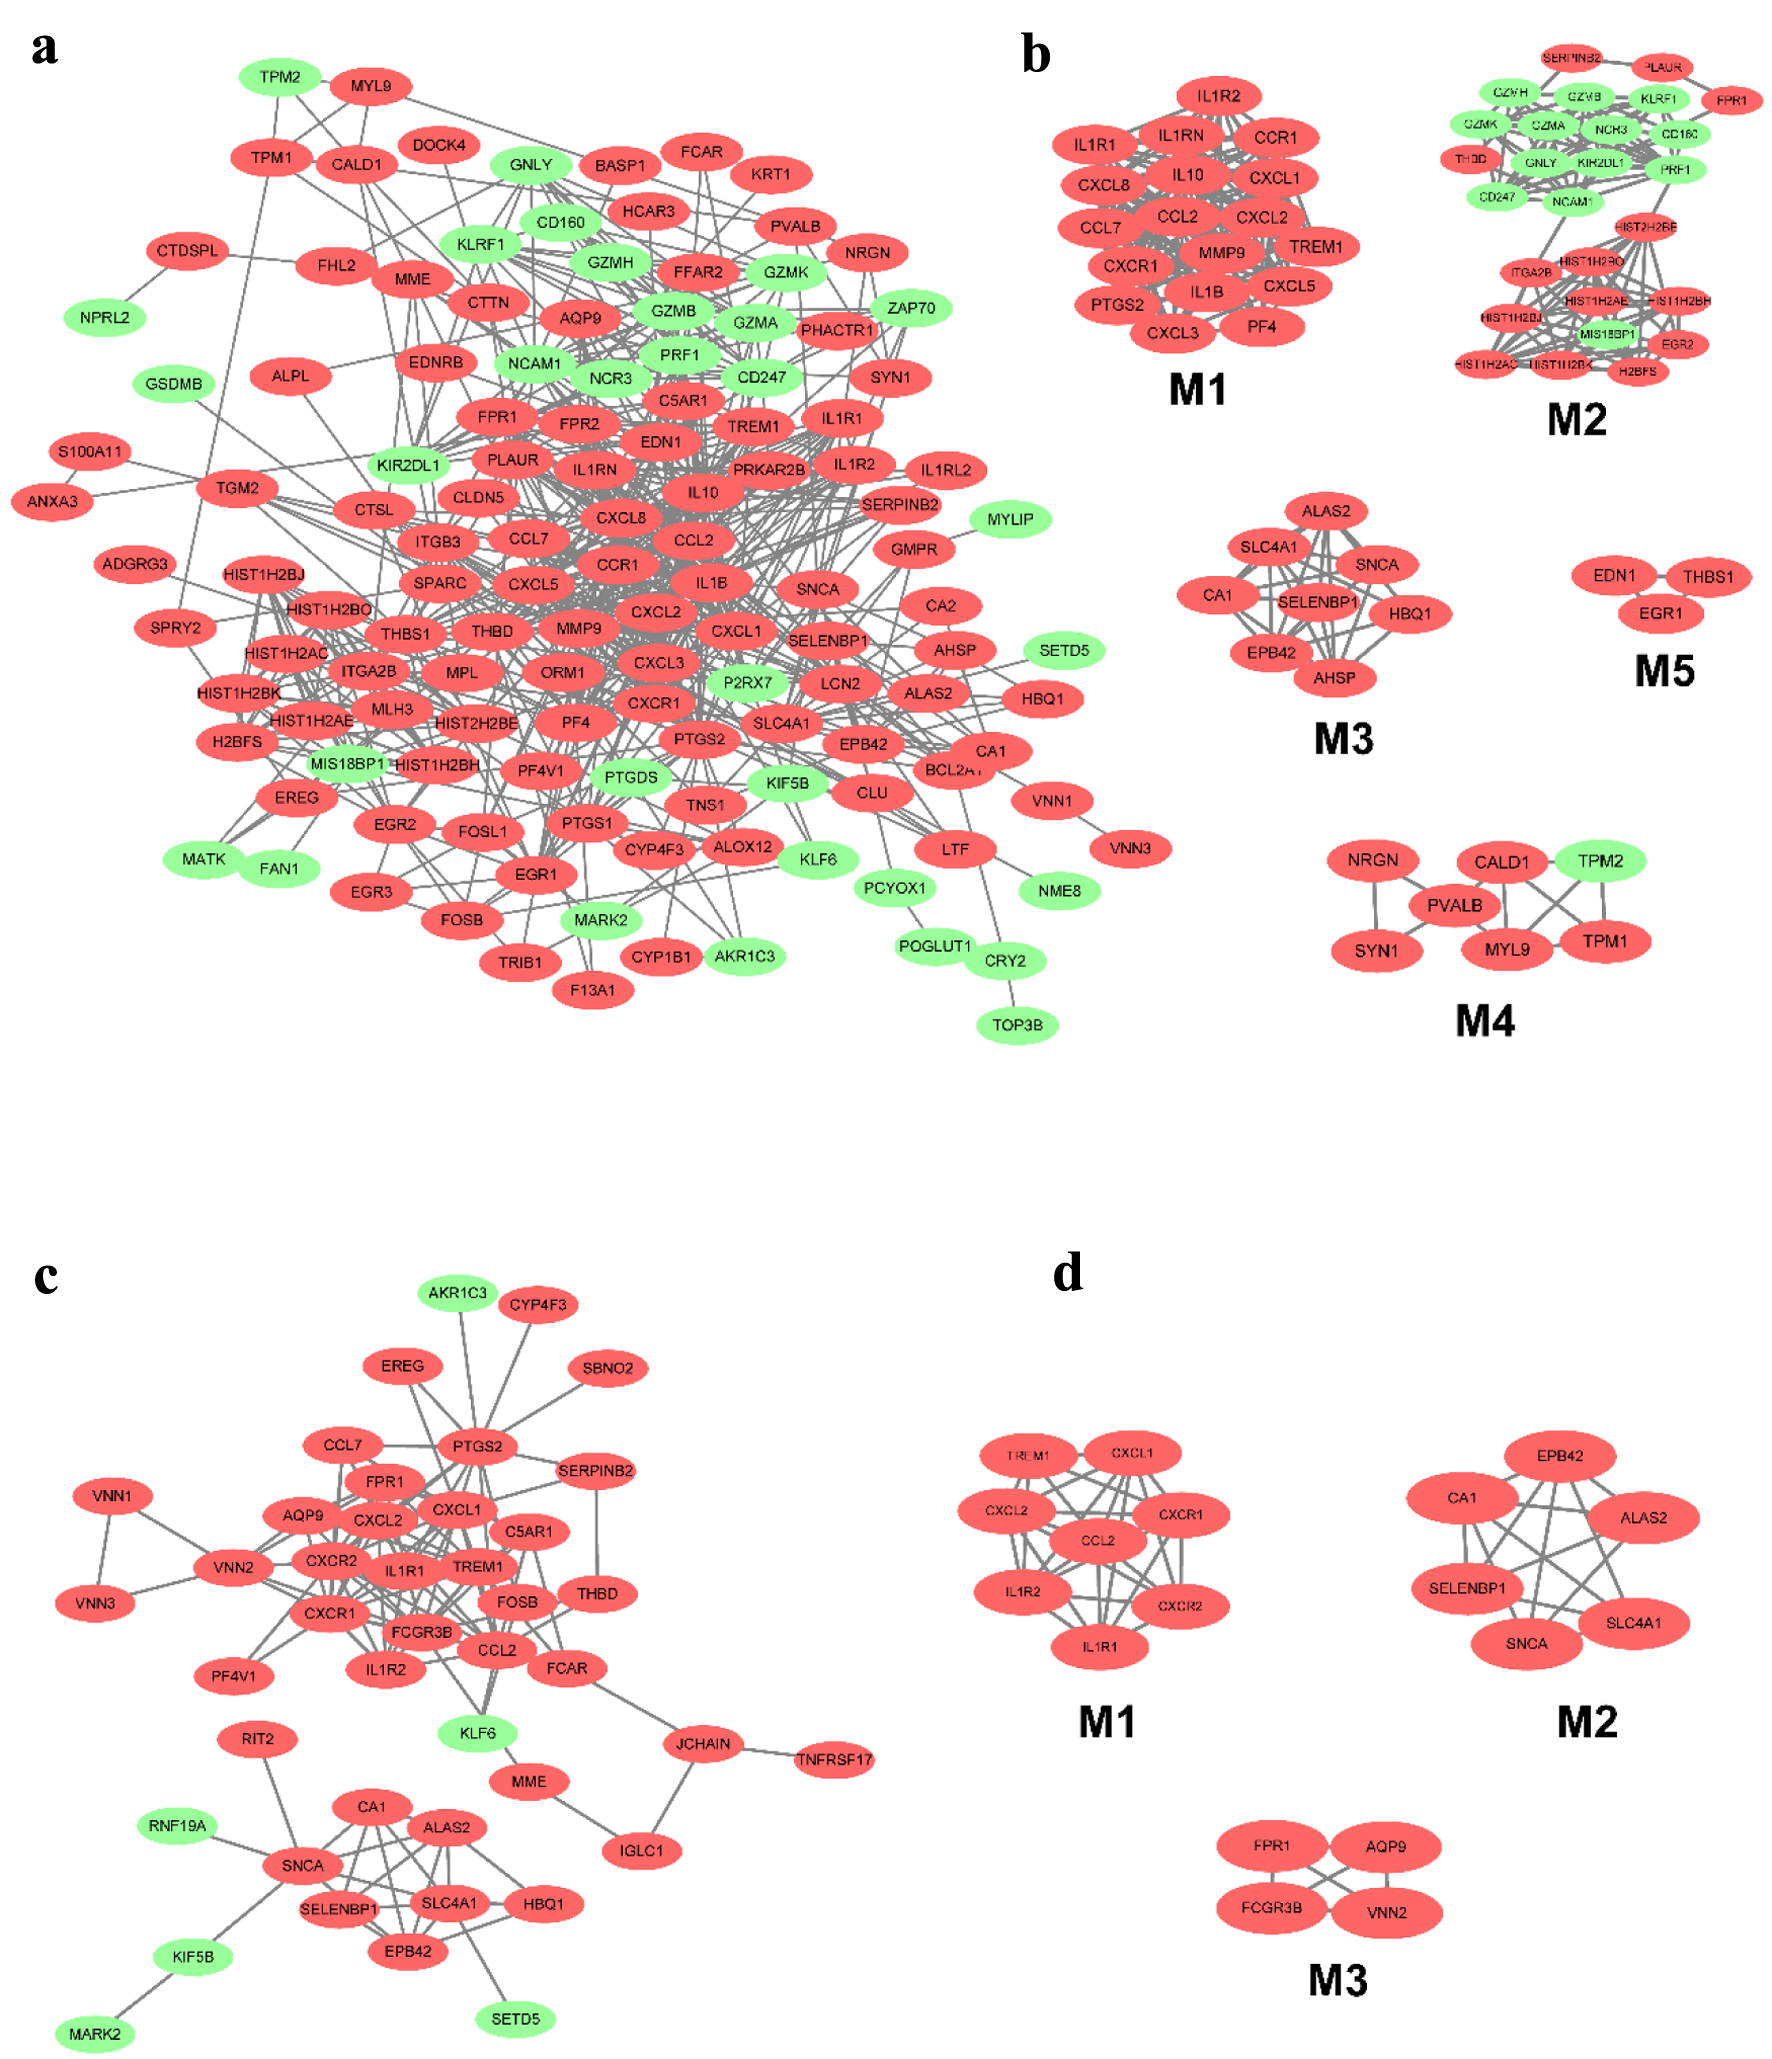 Click for large image | Figure 4. The PPI network of DEGs from the blood in CD and UC. (a) The PPI network of DEGs of blood in CD was constructed using Cytoscape software. (b) The most significant five modules were obtained from the PPI network of CD. (c) The PPI network of DEGs of blood in UC was constructed using Cytoscape software. (d) The most significant three modules were obtained from the PPI network of UC. The upregulated DEGs are marked in red, and the downregulated genes are marked in green. CD: Crohn’s disease; DEGs: differentially expressed genes; PPI: protein-protein interaction; UC: ulcerative colitis. |
Twenty-four overlapped DEGs in the CD group for mucosa samples in the GSE75214 and GSE1141 datasets. A PPI network contained 24 nodes and 58 edges; a significant module with 10 nodes and 32 edges was identified (Fig. 5a, b). The 10 most significant genes showing significant interaction were signal transducers and activators of transcription 1 (STAT1), CXCL10, C-C motif chemokine ligand 20 (CCL20), prostaglandin-endoperoxide synthase 2 (PTGS2), IL-7R, CXCL8, CXCL2, C-type lectin domain-containing 7A (CLEC7A), CCL11, and early growth response 1 (EGR1). Similarly, after removing the isolated and partially connected nodes, a complex network of 56 DEGs with 56 nodes and 92 edges was constructed in UC, as shown in Figure 5c. Three significant modules were identified. The most significant genes showing significant interaction were SELL, CXCL2, CCL20, CXCL8, CXCL3 and IL-18 in module 1; carbohydrate sulfotransferase (CHST)15, CHST11, serglycin (SRGN) and chondroitin sulfate N-acetylgalactosaminyltransferase (CSGALNACT)1 in module 2, and S100A8, aquaporin 9 (AQP9) and colony-stimulating factor 3 receptor (CSF3R) in module 3 (Fig. 5d).
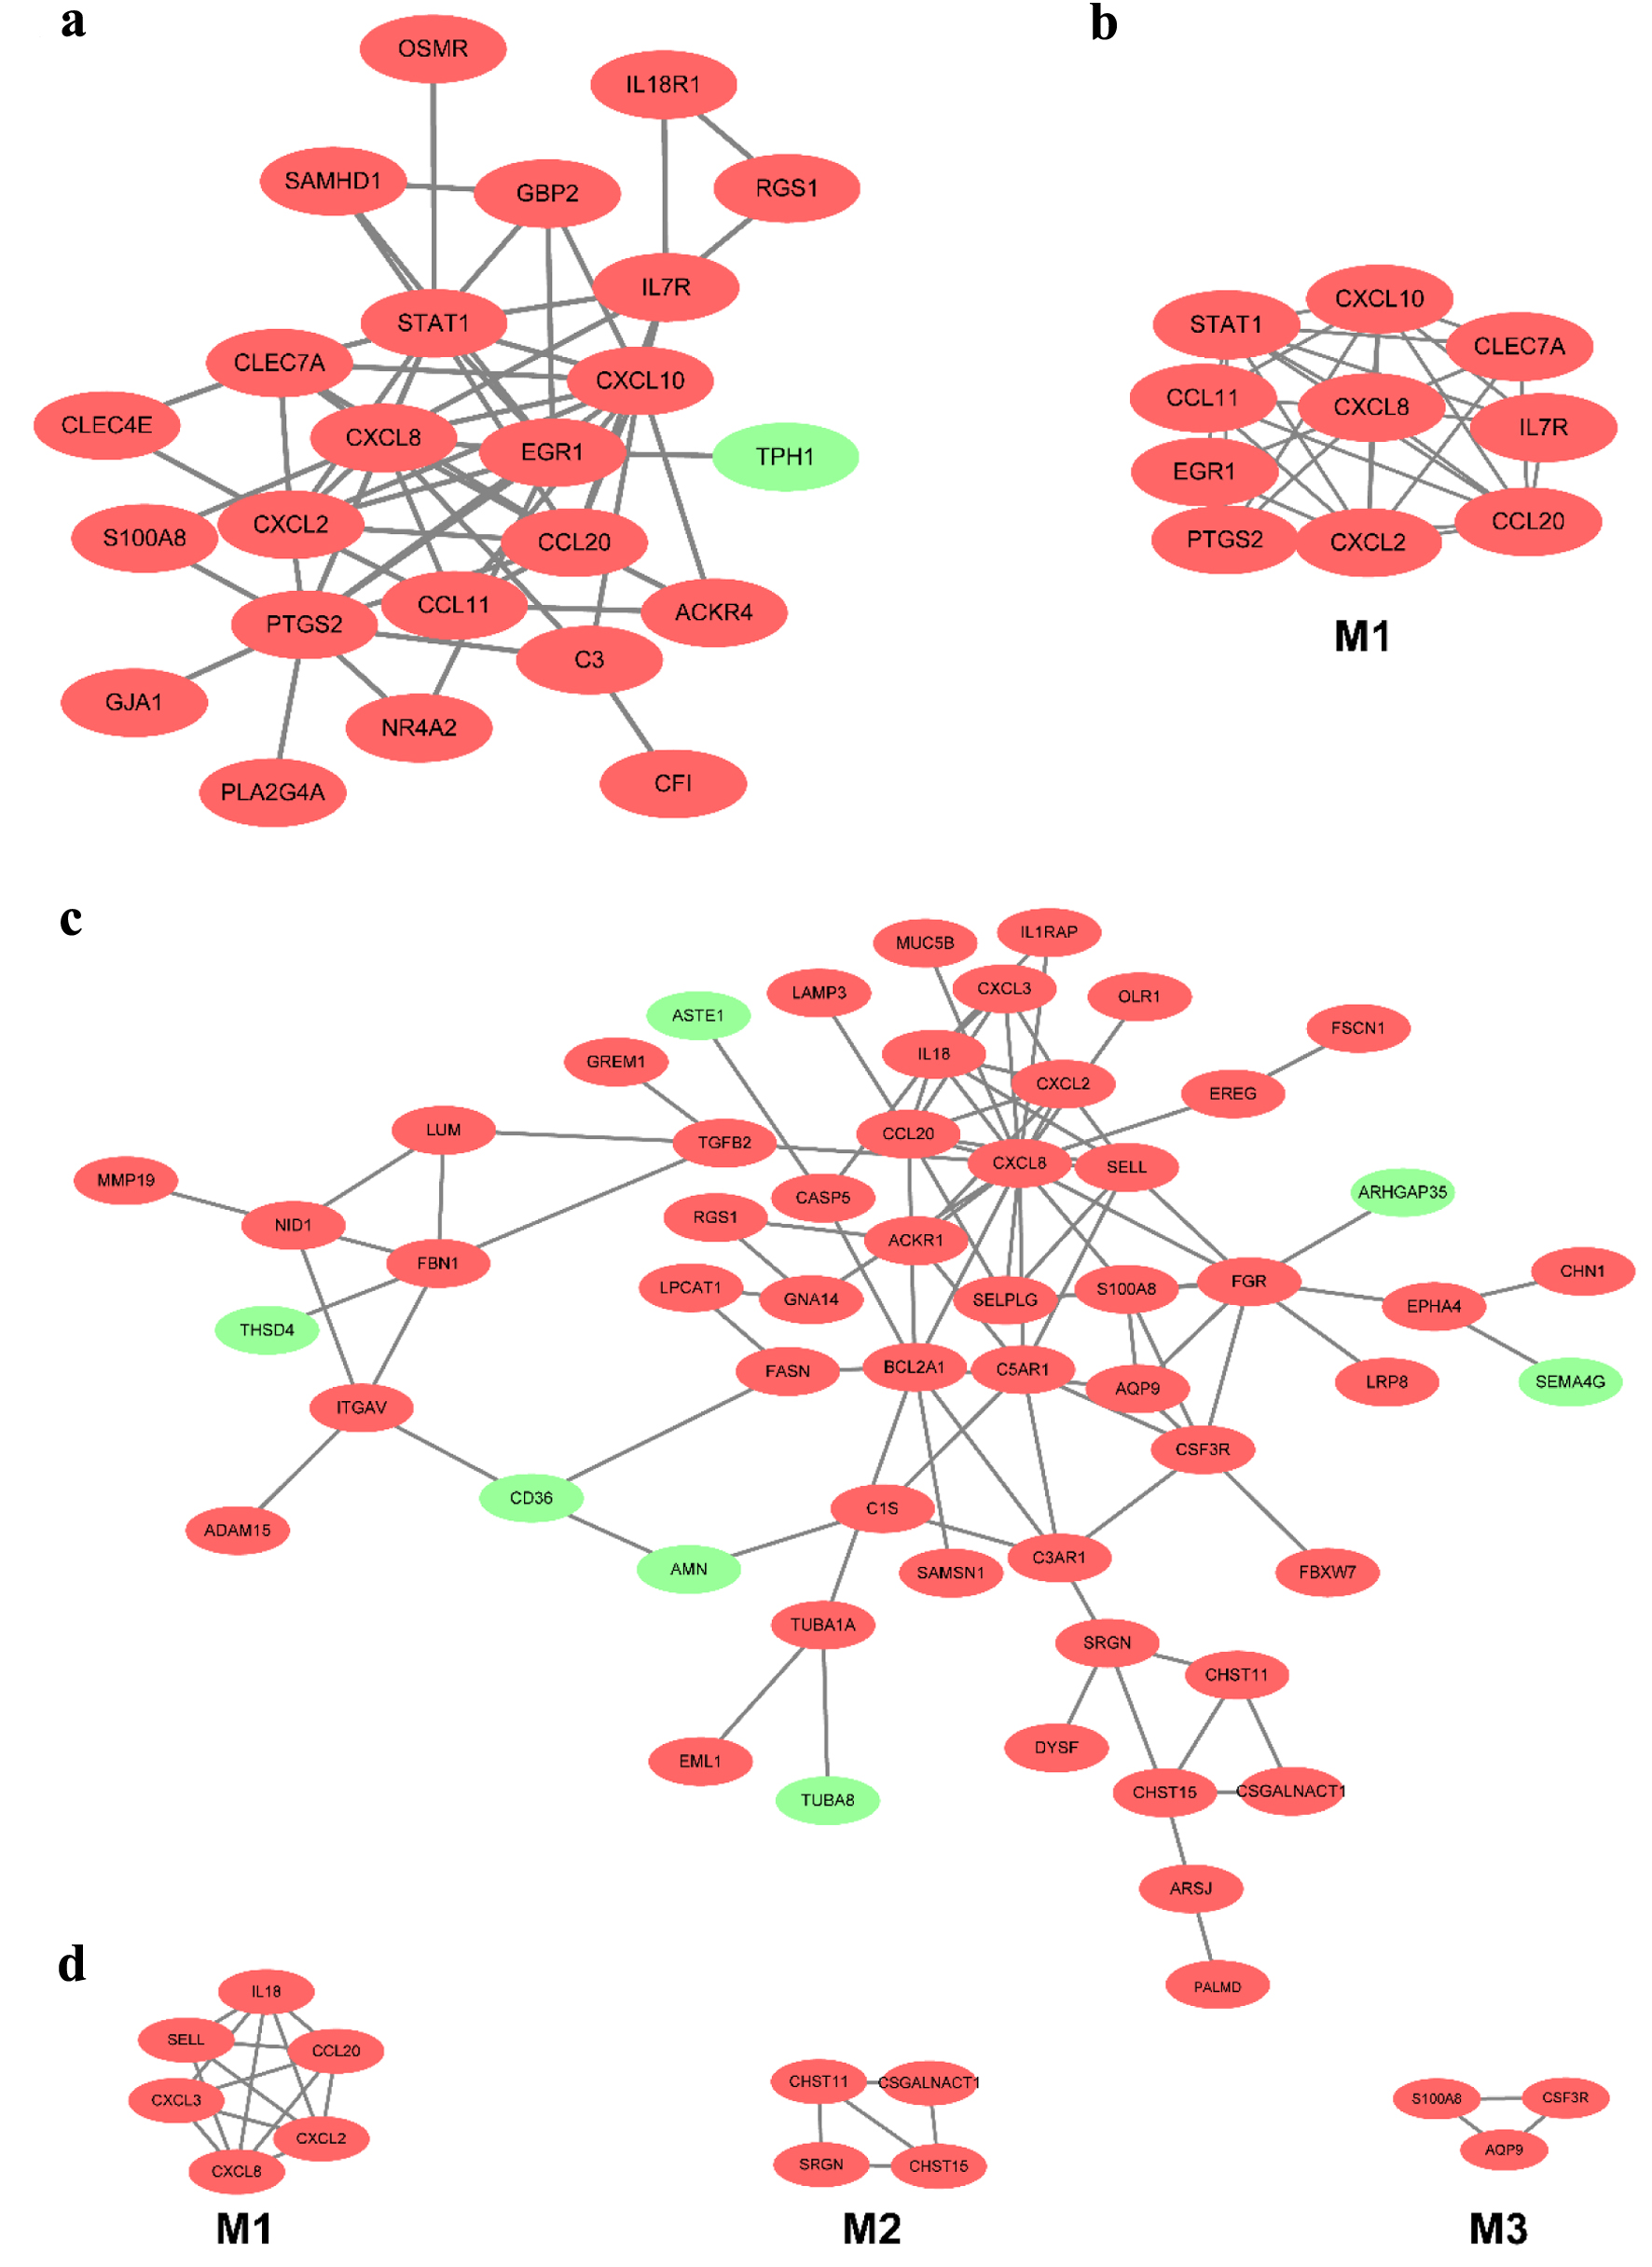 Click for large image | Figure 5. The PPI network of DEGs of two datasets from the mucosa in CD and UC. (a) The PPI network of DEGs of two datasets from the mucosa in CD. (b) The most significant module was obtained from the PPI network in CD. (c) The PPI network of DEGs of two datasets from the mucosa in UC. (d) The most significant three modules were obtained from the PPI network in UC. The upregulated DEGs are marked in red, and the downregulated genes are marked in green. CD: Crohn’s disease; DEGs: differentially expressed genes; PPI: protein-protein interaction; UC: ulcerative colitis. |
Exploring the respective pathogenesis of CD and UC
To study the unique characteristics and mechanisms of CD and UC at different tissue levels, we further screened out the DEGs identified only in CD but not in UC to perform the functions and pathways enrichment analysis and vice versa (Fig. 6a, b, c). In the CD group, the significant GO terms are mainly associated with immune response, such as response to interferon-gamma (IFN-γ), cytokine secretion, adaptive immune response, antigen processing, and presentation of exogenous peptide antigen via major histocompatibility complex (MHC) class I and lymphocyte-mediated immunity. However, membrane protein proteolysis and various substances’ transport-related GO terms were enriched in the UC group (Fig. 6d, e). The CD group enriched the analogous, NOD-like receptor signaling pathway, antigen processing and presentation, and complement and coagulation cascades related to immune response. At the same time, multiple substances biosynthesis and catalysis, antifolate resistance, and ABC transporters were enriched in the UC group (Fig. 6f, g). The PPI network was also constructed in the CD and UC groups. The results showed that STAT1, interferon-induced transmembrane protein (IFITM)3, IFITM1, human leukocyte antigen F (HLA-F), proteasome 20S subunit beta (PSMB)9, PSMB8, proteasome activator subunit (PSME)2, and glucuronosyltransferase family (UDP) in the CD group and Erb-B2 receptor tyrosine kinase 2 (ERBB2), matrix metallopeptidase (MMP)2, MMP3, tissue inhibitors of metalloproteinases (TIMP)1, and TIMP2 in the UC group play a crucial role in the pathological process (Fig. 6h, i).
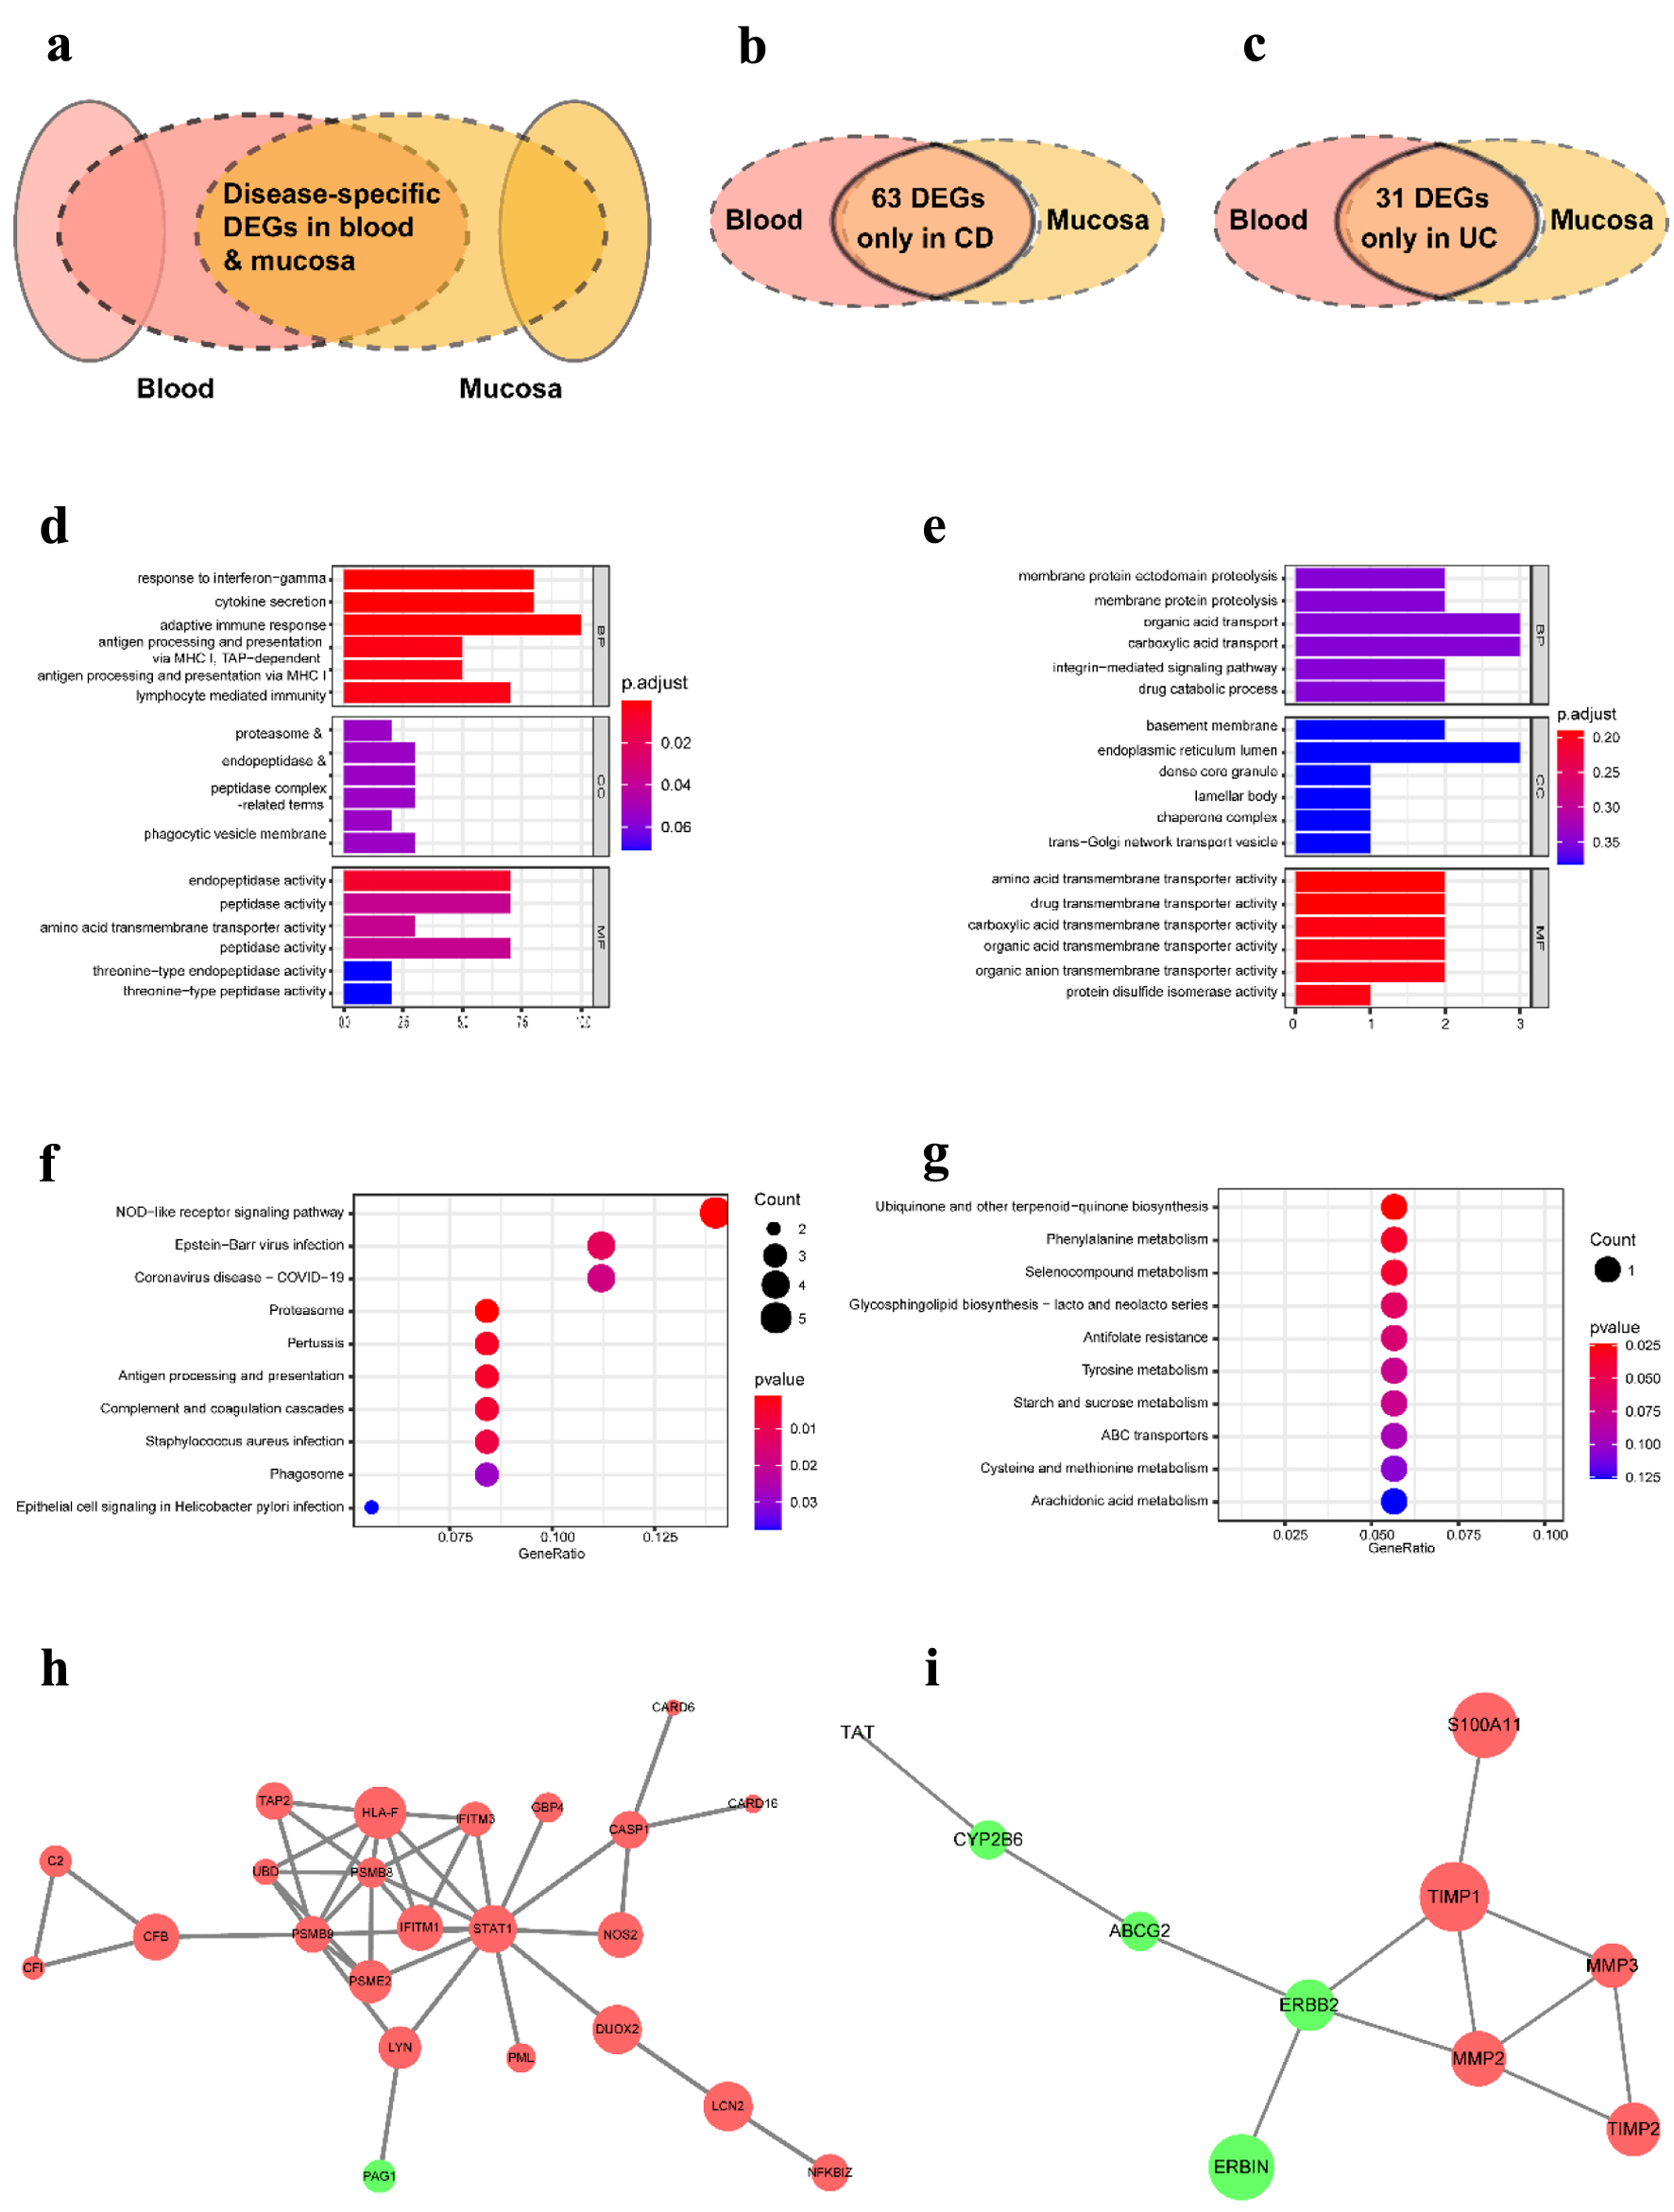 Click for large image | Figure 6. The distinct pathological mechanism of CD and UC at the tissue-specific level. (a) Schematic representation of DEGs used for analysis. (b) Venn diagram of DEGs in CD from three datasets. (c) Venn diagram of DEGs in UC from three datasets. (d, e) The most significant GO terms of CD-specific DEGs (d) and UC-specific DEGs (e). (f, g) The most significant KEGG pathways of CD-specific DEGs (f) and UC-specific DEGs (g). (h, i) The PPI network contrasted based on only identified in CD (h) and only in UC (i). GO: Gene Ontology; KEGG: Kyoto Encyclopedia of Genes and Genomes; DEGs: differentially expressed genes; CD: Crohn’s disease; UC: ulcerative colitis. |
DSS-induced colonic and TNBS-induced enteric inflammation
To determine the causative role of the factors in IBD, we construct a series of animal models, the TNBS-induced CD model, the DSS-induced UC model, and the control mice. The body weight and colonic histomorphology were analyzed. Compared with the control mice, the body weight of the experimental groups began to drop since the fourth day gradually came with an increase in diarrhea and rectal bleeding. The body weight of the CD group dropped slowly until the eighth day, when it began to plunge. However, the UC group lost their weight apace on the fifth day after adding 3% DSS in drinking water (Fig. 7c). The histopathological changes of CD and UC were observed on the day of dissection. Histological signs of colonic inflammation were multifocal mucosal infiltrations of predominantly neutrophils and lymphohistocytes. As described in previous studies, focal or discontinuous chronic inflammation without crypt atrophy, increased lymphocytes and plasma cells of the lamina propria, poorly delimited granulomas, a few cryptitis, crypt abscesses, proximal colon location of ulceration, and a few crypt architectural distortions were observed in CD group [28, 29]. By contrast, diffuse or continuous inflammation with basal plasmacytosis, crypt abscesses, mucin depletion, chronic inflammatory cell infiltration in the lamina propria, and vast quantities of crypt architectural irregularities, pronounced loss of goblet cells was often seen in the UC group (Fig. 7a) [28-31]. Consequently, the histopathological scores were between 6 and 12 in the CD group and between 4 and 16 in the UC group. The details are shown in Figure 7b.
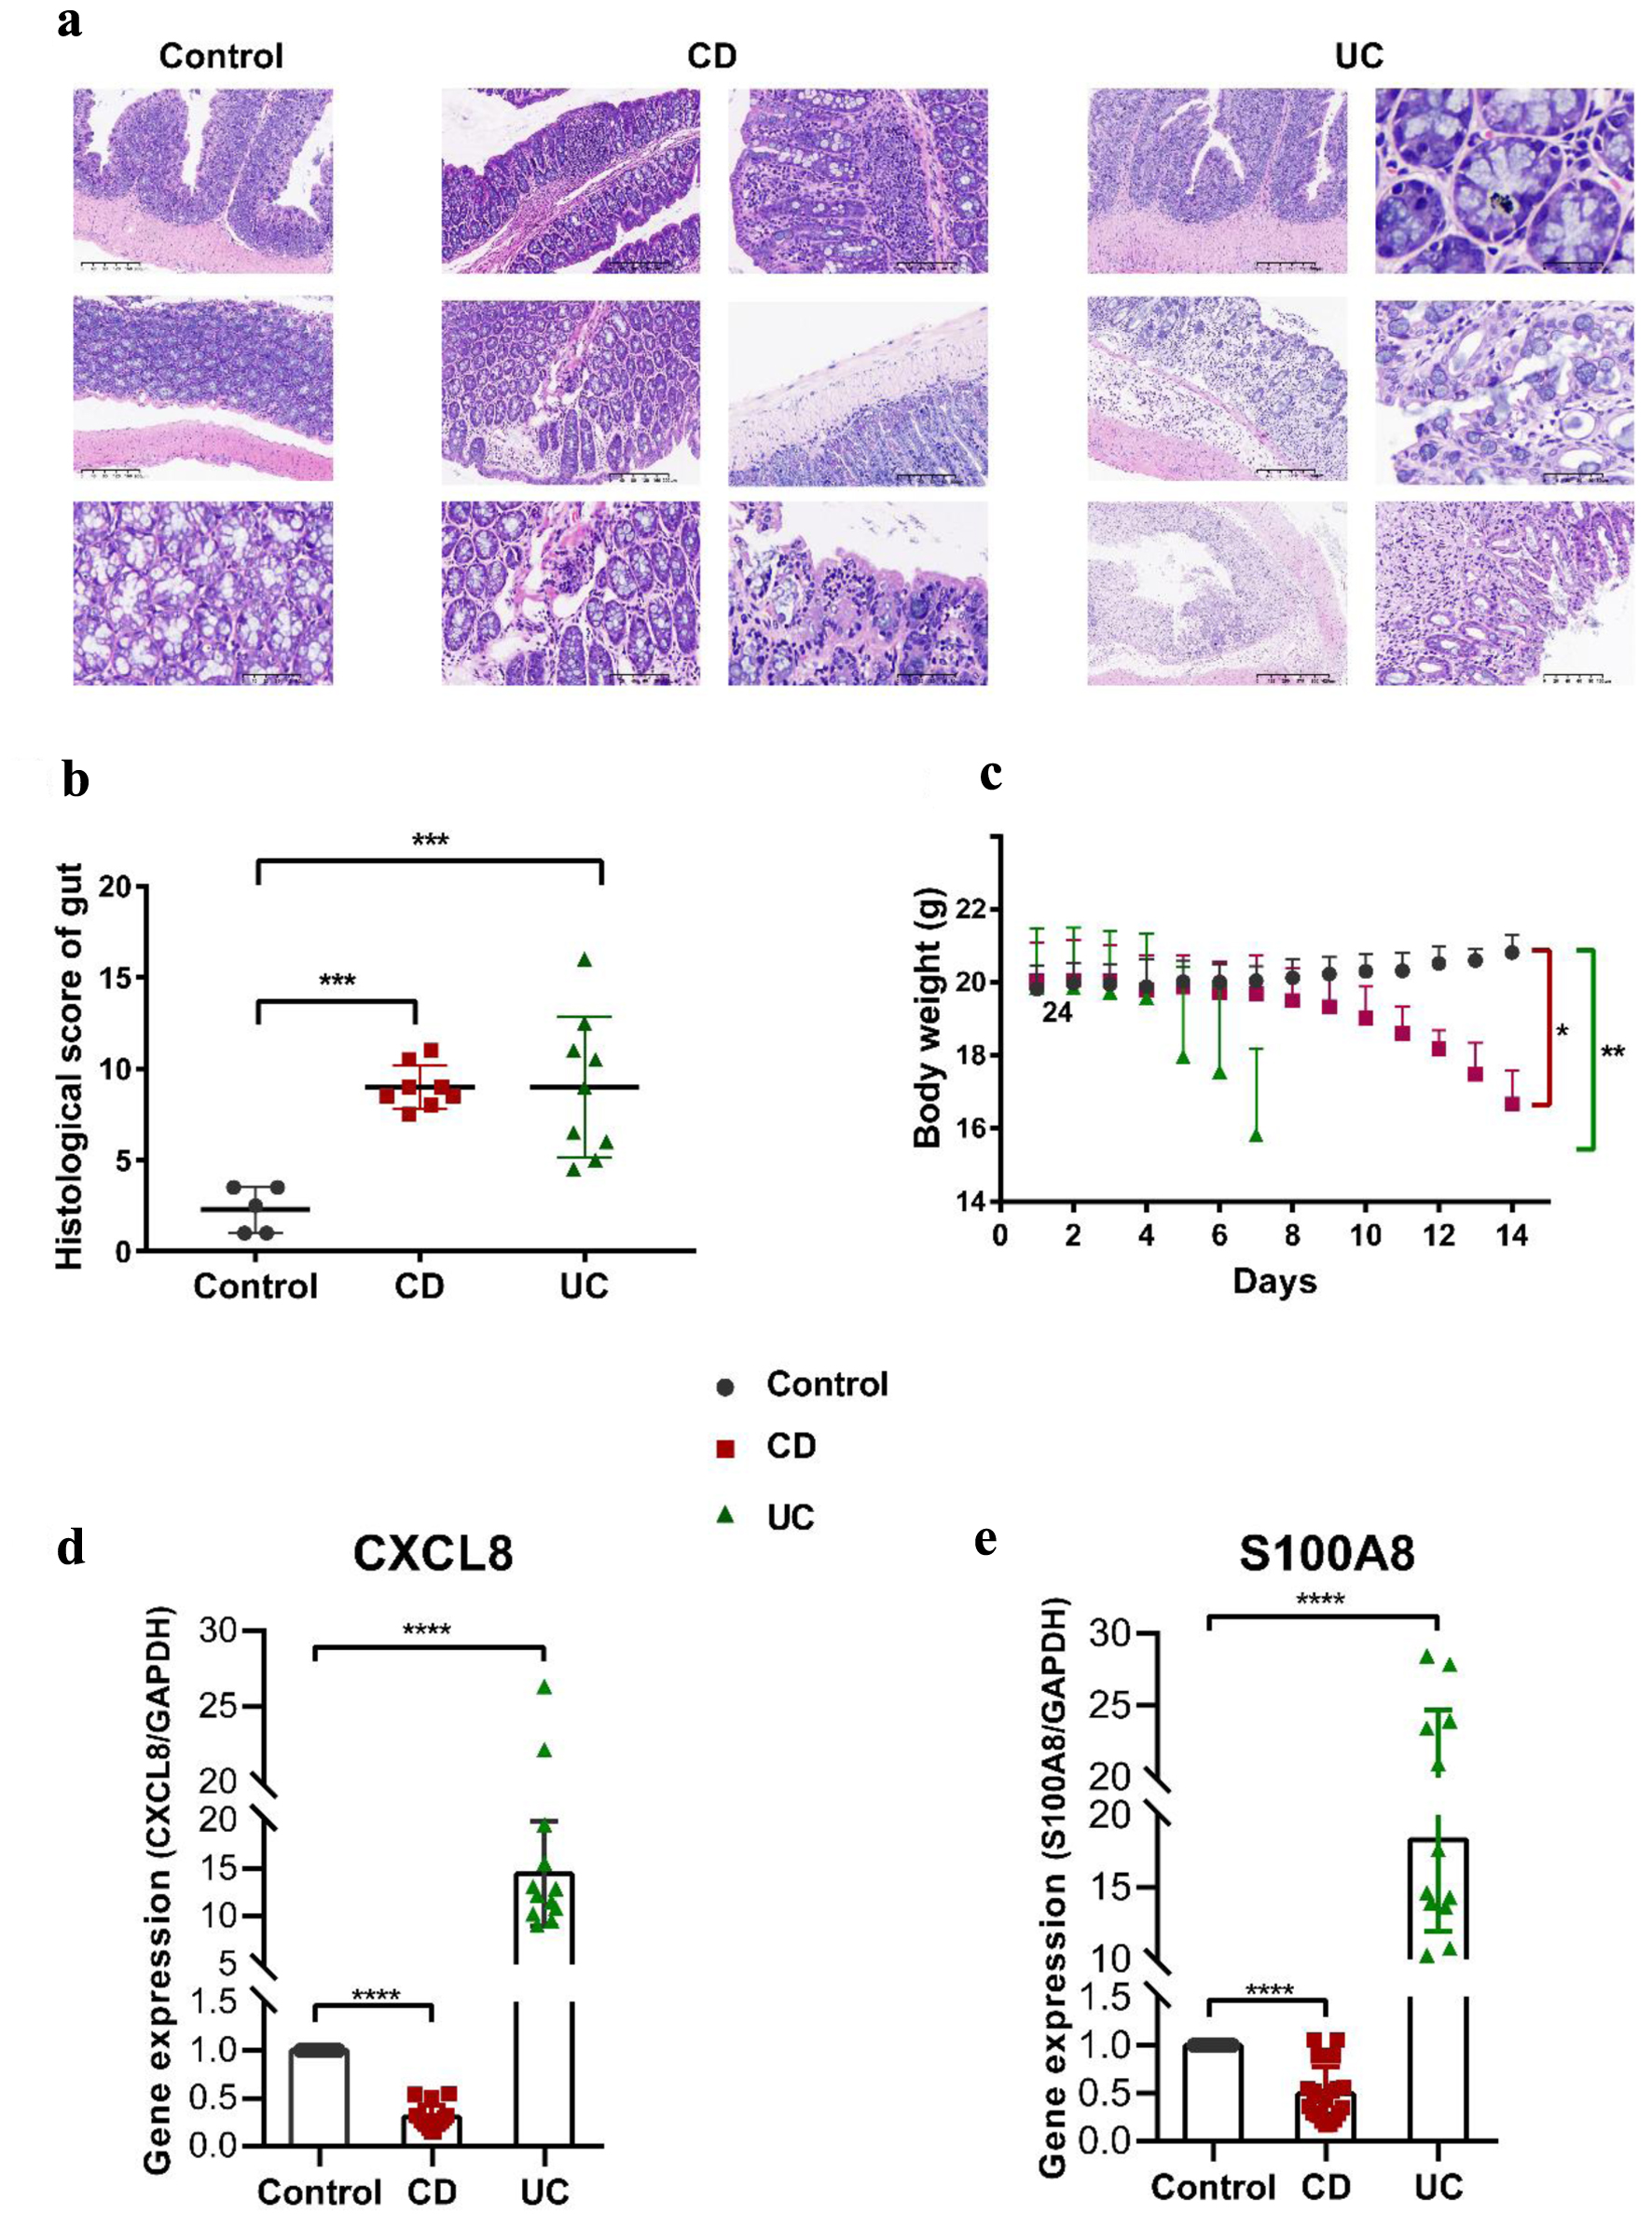 Click for large image | Figure 7. Pathophysiological analysis and marker gene validation using the IBD model mice. (a) Representative microscopy images of H&E-stained colonic sections. (b) Histological scoring of the colon section. Data were expressed as means ± SD (***P < 0.001). (c) Changes in body weight with a time of administration. (d, e) RT-PCR analysis. ****P < 0.0001 (Student’s t-test). Error bars represent SD. IBD: inflammatory bowel disease; RT-PCR: real-time polymerase chain reaction; SD: standard deviation; H&E: hematoxylin and eosin. |
Quantitative analysis confirmed the two marker genes
We further detected the expression levels of the two marker genes using the colon tissues of our model mice tested pathologically by RT-qPCR. CXCL8 and S100A8 were increased in the UC group but decreased in the CD group (Fig. 7d, e). Our results revealed the two maker genes implicated in the progression of activities, providing a compelling clue for the diagnosis and the therapeutic mechanism of IBD.
| Discussion | ▴Top |
IBD poses a significant challenge to clinicians and patients, with limited treatment options and an increased risk of CRC. Despite extensive research efforts, the pathogenic processes of IBD remain elusive, and current diagnostic and therapeutic strategies remain suboptimal. To address this issue, the present study aimed to identify discriminative alterations in gene expression patterns (GEPs) of disease-specific and tissue-specific samples from IBD patients and healthy individuals that could serve as potential diagnostic and screening biomarkers for IBD. Previous studies have screened biomarkers associated with the different pathological subtypes of CD and UC only in one tissue. However, the current study combined the different tissue-specific datasets and IBD mice models to identify biomarkers only by blood testing and explore CD and UC’s communal and unique mechanisms.
Some biomarkers to identify IBD only through blood testing
At the disease-specific level, we obtained 11 and 13 unique DEGs that can be used as biomarkers only detected by blood in CD and UC, respectively. For three datasets, 134 CD-specific and 31 UC-specific DEGs were considered maker genes in blood, with stricter screening criteria: |log2 fold change| ≥ 1 and P-value < 0.05. Meanwhile, 28 CD-specific, 134 UC-specific in mucosa-1, and 143 CD-specific, 117 UC-specific in mucosa-2 were considered using |log2 fold change| ≥ 2 and P-value < 0.05. Two DEGs, DYSF and CXCL2 are shared in CD and UC in all datasets, suggesting a vital role in IBD. DYSF may be involved in membrane regeneration and repair, smooth muscle contraction, and calcium-mediated membrane fusion events, which indicates that it may be involved in the intestinal intima damage repair process and intestinal peristalsis function of IBD. IBD is chronic intestinal inflammation and a constant influx of leukocytes mediated by proinflammatory cytokines and chemokines. Chemokines are small proteins (7 - 15 kDa) that play a fundamental role in the immune system’s development, homeostasis, and the host’s defense [32]. CXCL2, an important chemokine in immunoregulatory and inflammatory processes, is produced by activated monocytes and neutrophils and expressed at sites of inflammation. CXCL8 is a chemokine family member that controls cell recruitment and activation under homeostatic and inflammatory conditions that act on C-X-C motif chemokine receptor (CXCR)1 and CXCR2 receptors. Unless explicitly stimulated, CXCL8 is virtually undetectable in general unstimulated cells [33]. Previous studies showed that the down-regulation of CXCL8 produced by monocytes in the peripheral blood of IBD patients in CD was not found in UC and normal people [34]. The results are consistent with the results of our quantitative experiments. In this study, expression of CXCL8 was down-regulated in CD but up-regulated in UC of colon samples from IBD model mice. We found that CXCL8 was a common DEG in both blood and mucosa in CD from all datasets and as a hub node in PPI and modules, which suggested that CXCL8 could be used as a biomarker to identify IBD only through examining peripheral blood, a quick and easy way to diagnose IBD with less trauma.
Analogously, S100A8 was identified in blood and mucosa to diagnose UC precisely. S100A8 regulates inflammatory processes and immune response and can induce neutrophil chemotaxis and adhesion [35]. Its proinflammatory activity includes the recruitment of leukocytes, promoting cytokine and chemokine production, and regulating leukocyte adhesion and migration [36]. CXCL8 acts as an alarmin or a danger-associated molecular pattern member and can bind to Toll-like receptor 4 (TLR4) and AGEs to activate the mitogen-activated protein kinases (MAPKs) and NF-κB signaling pathways, amplifying the proinflammatory cascade [37].
IL-17 signaling pathway and cytokine-cytokine receptor interaction are two common signaling pathways in the CD group in blood and mucosa, indicating that they play essential roles in the occurrence and development of CD. IL-17 is an essential driver of human chronic inflammation and, as a signature cytokine, plays a pathological role in inflammatory and autoimmune diseases. IL-17 induces chemokines, including CXCL1, CXCL2, and CXCL8, to attract myeloid cells, such as neutrophils, to infected or injured tissues [38]. Moreover, the IL-17 family activates downstream pathways that include NF-κB, CCAAT enhancer-binding proteins (C/EBPs), and MAPKs to induce cytokine production and acting, which indicates that there might be an interaction between the IL-17 signaling pathway and cytokine-cytokine receptor interaction signaling pathway jointly promotes the inflammatory response to CD [39].
Comparative analysis of GEPs in CD and UC
In this study, CD-specific and UC-specific DEGs were 63 and 31 in blood and mucosa, which might be biomarkers to distinguish CD and UC. GO enrichment and KEGG pathways analysis revealed that the most significant DEGs were mainly enriched in multiple factor-mediated immune responses and responses to inflammation in CD. However, GO terms of the 31 UC-specific DEGs included integrin-mediated signaling pathways, metabolism, transmembrane transport of various substances, and membrane protein proteolysis. The critical node genes, including STAT1, IFITM3, IFITM1, PSMB9, PSMB8, and PSME2, are involved in antigen presentation, a central part of the acquired immune system. Meanwhile, IFITM1 and IFITM2 are IFN-induced antiviral proteins closely related to anti-cell adhesion transduction, antiviral, immune surveillance, and inflammatory mediating [40]. As is well-known, HLA-F acts in an immunoregulatory capacity centered on the inflammatory response in the CD group. By contrast, the critical nodes, including MMP2, MMP3, TIMP1, and TIMP2, and the dynamic balance between them in UC, play a crucial role in the pathological process.
Moreover, EGR1, a member of the immediate early gene (IEG), which was an essential nuclear transcription factor and played a regulatory role in various reactions, was identified in CD specifically. This gene is widely distributed, has a self-regulatory mechanism, and regulates inflammation, stress, and tumor [41, 42]. It is rapidly and transiently induced by various extracellular signals such as cytokines, T-cell receptor activation, growth factors, and toxic substances [43]. The expression of EGR1 increased rapidly in chronic inflammation, which was consistent with high expression in our results. Blood is the first line of defense for immunity, so it responds quickly to IBD and inflammation. Some studies show that the EGR family (EGR2/EGR3) affects T-/B-cell proliferation and differentiation, intersects multiple signaling pathways NF-κB, and is closely related to the development of various autoimmune diseases [44]. This may be evidence that CD is an autoimmune disease. Additionally, chemokines and their receptors were the most concentrated genes in the interaction network in both CD and UC. They are best known for stimulating the migration of cells, most notably leukocytes. Consequently, chemokines play a central role in immune system homeostasis and are involved in all protective or destructive immune and inflammatory responses [45, 46]. This knowledge was further confirmed in our analysis.
Comparative analysis of GEPs of tissue-specific at the same condition
For the CD group, 13 common DEGs were in blood and two mucosa datasets, while 735 DEGs were identified only in blood, 776 in mucosa-1, and 1,163 in mucosa-2, respectively (Supplementary Material 6, www.gastrores.org). PCA analysis and clustering results can preliminarily show that the mucosal tissue has a more apparent disease characterization (Supplementary Material 3-5, www.gastrores.org). The most significant GO terms in blood were leukocyte chemotaxis, immune response, negative regulation of coagulation, and platelet alpha granule. Meanwhile, two KEGG pathways, cytokine-cytokine receptor interaction and IL-17 signaling pathway, viral protein interaction with cytokine and cytokine receptor, and TNF signaling pathway, were identical in blood and mucosa datasets. The respective GO terms and pathways were related to various immune and inflammation responses in the blood. By contrast, the extracellular matrix, humoral immune response, and response to lipopolysaccharide were in the mucosa.
For the UC group, 15 common DEGs were in blood and two mucosa datasets, while 392 were in blood, 1,947, and 657 in mucosa-1 and mucosa-2 (Supplementary Material 6, www.gastrores.org). The difference was even more pronounced in UC between blood and mucosa, and only one GO term, leukocyte migration, was communal in blood and mucosa. Except for the three familiar with CD, cytokine-cytokine receptor interaction, IL-17 signaling pathway, chemokine signaling pathway, myeloid cell/neutrophil activation, and acute inflammatory response were in the blood. However, extracellular matrix, monocarboxylic acid metabolic process, wound healing, and response to the bacterium were in the mucosa. In summary, when inflammation occurs at the disease-specific level (only in CD or UC), the immune response is first activated in the blood, followed by large-scale inflammation and immune response in diseased tissues.
Experimental verification for bioinformatics analysis
We further constructed an IBD mice model containing TNBS-induced CD mice and DSS-induced UC mice. The H&E results of CD and UC showed their pathological features and confirmed that the model was established successfully. Subsequently, the two most representative marker genes, CXCL8 and S100A8, with the significant fold change in two mucosae and as vital nodes of modules, were used to perform RT-qPCR. CXCL8 and S100A8 increased significantly in UC, which is consistent with our bioinformatics analysis, while the expression of the two decreased in the quantitative analysis of CD mice. This inconsistency may be due to the temporal effect of the gene’s response, with dynamic changes in expression when the inflammation activates the immune response. It is consistent with the decrease of CXCL8 in blood in literature studies [34].
Conclusion
In this investigation, we conducted various bioinformatics analyses and experimental assays from two distinct viewpoints. We compared the variations and similarities of expression profiles at a disease-specific and tissue-specific level, respectively (Fig. 8). At the tissue-specific level, CD and UC shared multiple DEGs, functions, and pathways related to cytokines/interleukin-mediated inflammatory/immune response in the blood. By contrast, CD shares extracellular matrix (ECM) and regulation of inflammatory response with UC in the mucosa. More interesting, at a disease-specific level, more immune response terms were focused on CD, substance metabolic/transport process in UC.
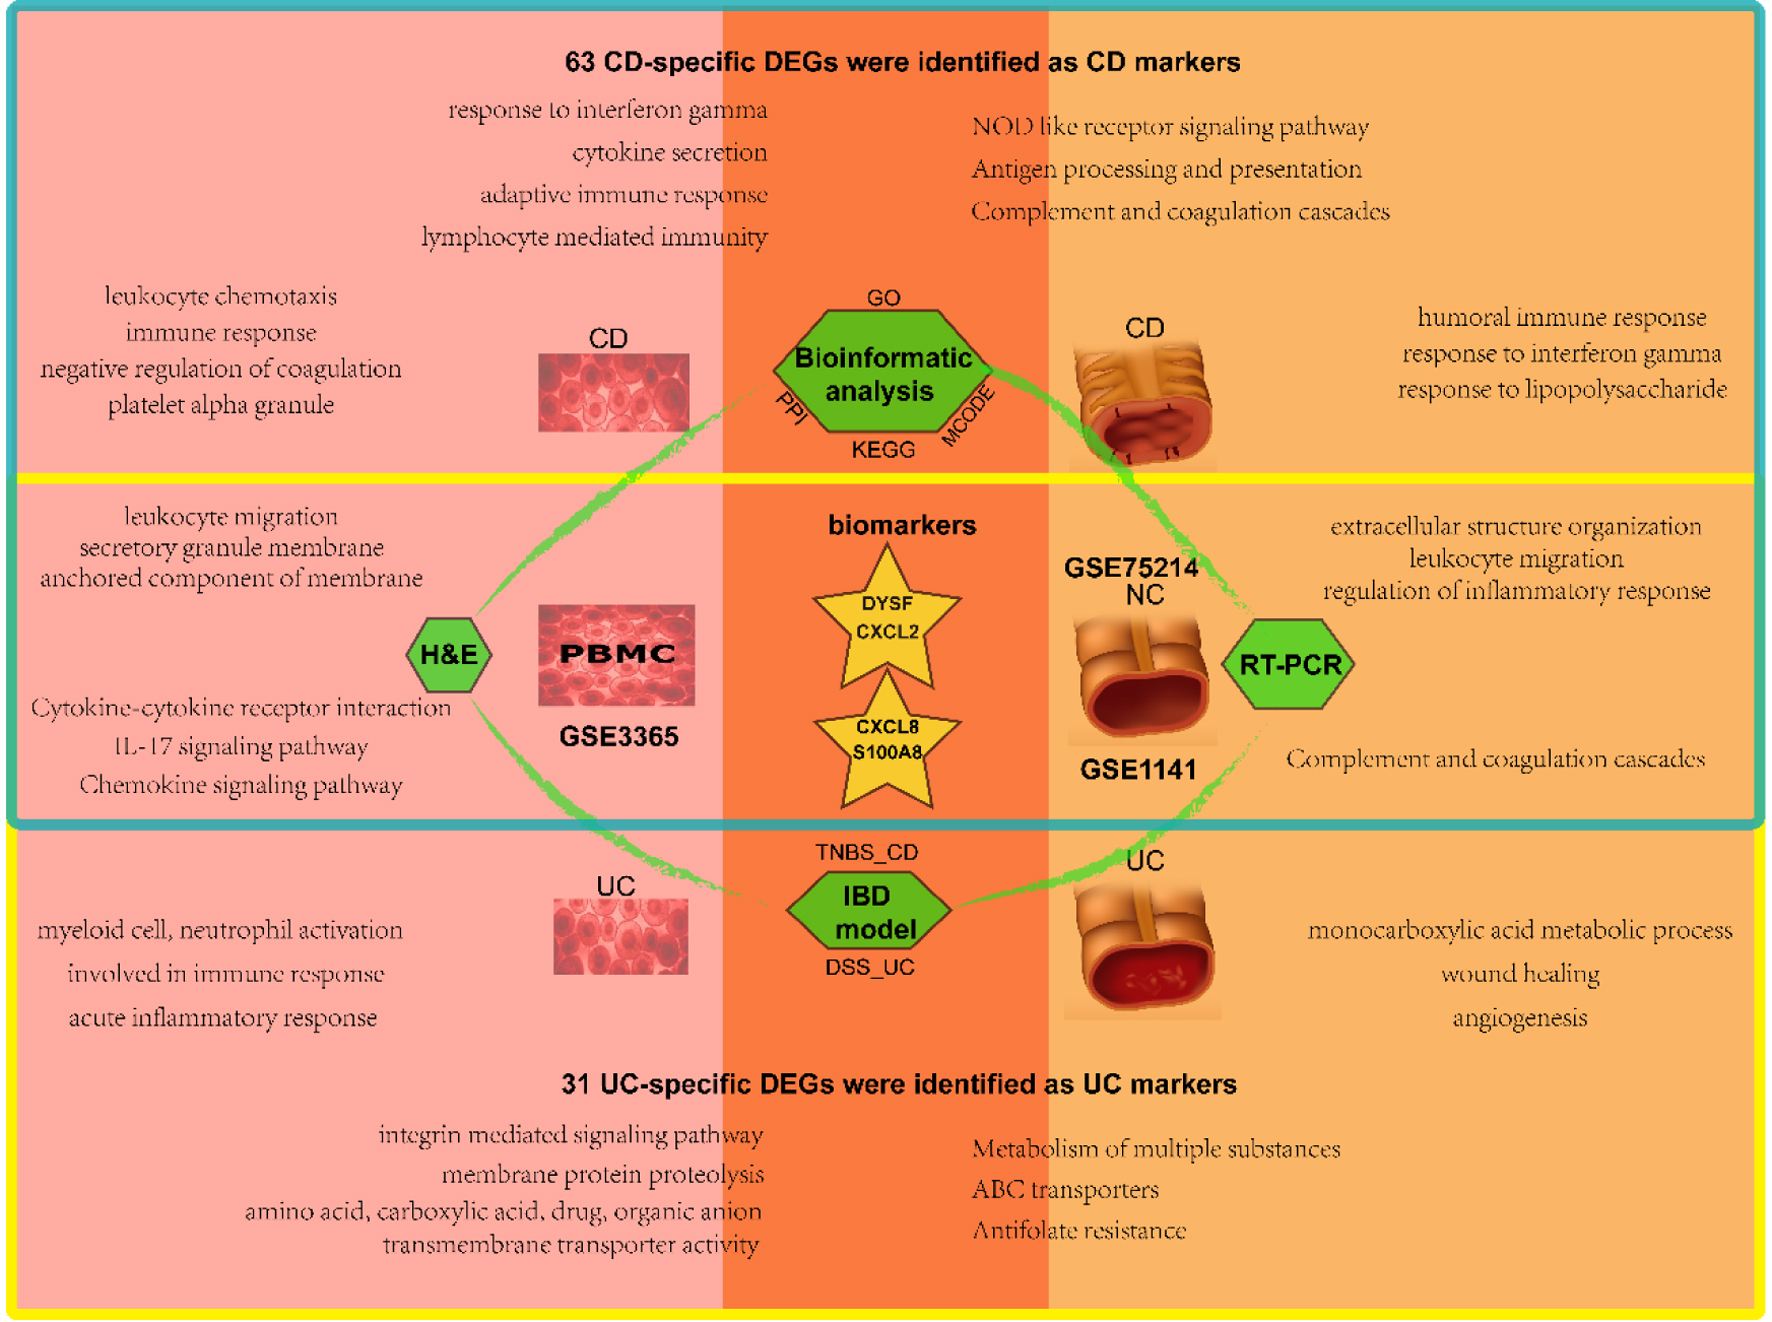 Click for large image | Figure 8. Schematic diagram of analysis and main results in this study. The blood samples are on the left and the mucosal samples on the right, with CD in the upper blue box and UC in the lower yellow box. The overlap represents the shared results. CD: Crohn’s disease; UC: ulcerative colitis. |
Moreover, we identified various cytokine processes and their receptor interactions, including chemokines, interleukin family, matrix metalloproteinase, NF-κB, IL-17, and other critical IBD-related factors that may interact with each other. These factors and signaling pathways mediated the chronic inflammation and immune cell infiltration in IBD patients’ intestinal walls, resulting in alterations in the intestinal wall structure and function, ultimately leading to IBD’s occurrence and development. Our research has important clinical implications for the early diagnosis, treatment, and prevention of IBD, providing effective targets for treating this disease. Nevertheless, further molecular biological studies are necessary to confirm the molecular mechanism associated with IBD.
| Supplementary Material | ▴Top |
Suppl 1. Histopathological scores.
Suppl 2. Standardization of gene expression before normalization (left) and normalization (right).
Suppl 3. Hierarchical clustering heatmaps of DEGs screened in blood based on |log2 fold change| > 1 and a corrected P-value < 0.05 were shown, respectively.
Suppl 4. Hierarchical clustering heatmaps of DEGs screened in two mucosa datasets based on |log2 fold change| > 1 and a corrected P-value < 0.05 were shown, respectively.
Suppl 5. Principle component analysis of three datasets: CD (up) and UC (down).
Suppl 6. Venn diagram of disease-specific and tissue-specific DEGs in three datasets. DEGs with |fold change| ≥ 1.5, P-value < 0.05.
Acknowledgments
We thank all members involved in the present study.
Financial Disclosure
This work was supported by the project of Southwest Medical University (00031501).
Conflict of Interest
The authors declare that they have no conflict of interest.
Informed Consent
Not applicable.
Author Contributions
WXY designed, organized, conceived the study project and wrote the manuscript. ZD conceived and designed the study project, analyzed data, and revised the manuscript. The authors approved the eventual version for submission.
Data Availability
The datasets analyzed during the current study are available in the Gene Expression Omnibus (GEO) database. https://www.ncbi.nlm.nih.gov/geo/.
Abbreviations
AGEs: advanced glycation endproducts; AQP9: aquaporin 9; BPs: biological processes; CARD15: caspase activation and recruitment domain 15; CCL: C-C motif chemokine ligand; CCs: cellular components; CD: Crohn’s disease; C/EBPs: CCAAT enhancer-binding proteins; CHST1: carbohydrate sulfotransferase 1; CLEC7A: C-type lectin domain-containing 7A; CRC: colorectal cancer; CXCL: C-X-C motif chemokine ligand; CXCR: C-X-C motif chemokine receptor; CSF3R: colony-stimulating factor 3 receptor; CSGALNACT: chondroitin sulfate N-acetylgalactosaminyltransferase; DEGs: differentially expressed genes; DSS: dextran sulfate sodium salt; DYSF: dysferlin; EGR: early growth response; ERBB2: Erb-B2 receptor tyrosine kinase 2; GAPDH: glyceraldehyde-3-phosphate dehydrogenase; GEPs: gene expression patterns; GEO: Gene Expression Omnibus; GO: Gene Ontology; HLA-F: human leukocyte antigen F; IBD: inflammatory bowel disease; IEG: immediate early gene; IFITM1: interferon-induced transmembrane protein 1; IL-17: interleukin-17; KEGG: Kyoto Encyclopedia of Genes and Genomes; MAPKs: mitogen-activated protein kinase; MCODE: molecular complex detection; MFs: molecular functions; MHC-Ia: major histocompatibility complexclass Ia; MMP: matrix metallopeptidase; NF-κB: nuclear factor kappa B; NOD2: nucleotide-binding oligomerization domain containing protein 2; PCA: principal component analysis; PPI: protein-protein interaction; PSMB: proteasome 20S subunit beta; PSME: proteasome activator subunit; PTGS: prostaglandin-endoperoxide synthase 2alias COX2; S100A8: S100 calcium-binding protein A8; SRGN: serglycin; ST1A1: sulfotransferase family 1A member 1; TLR4: Toll-like receptor 4; TNBS: trinitrobenzene sulfonic acid; TNF: tumor necrosis factor; TIMP: tissue inhibitors of metalloproteinases; UC: ulcerative colitis; UDP: glucuronosyltransferase family
| References | ▴Top |
- Hanauer SB. Inflammatory bowel disease: epidemiology, pathogenesis, and therapeutic opportunities. Inflamm Bowel Dis. 2006;12(Suppl 1):S3-9.
doi pubmed - Baumgart DC, Sandborn WJ. Crohn's disease. Lancet. 2012;380(9853):1590-1605.
doi pubmed - Loftus EV, Jr. Clinical epidemiology of inflammatory bowel disease: Incidence, prevalence, and environmental influences. Gastroenterology. 2004;126(6):1504-1517.
doi pubmed - Renuzza SSS, Vieira ER, Cornel CA, Lima MN, Ramos Junior O. Incidence, Prevalence, and Epidemiological Characteristics of Inflammatory Bowel Diseases in the State of Parana in Southern Brazil. Arq Gastroenterol. 2022;59(3):327-333.
doi pubmed - Rabbenou W, Ullman TA. Risk of Colon Cancer and Recommended Surveillance Strategies in Patients with Ulcerative Colitis. Gastroenterol Clin North Am. 2020;49(4):791-807.
doi pubmed - Nadeem MS, Kumar V, Al-Abbasi FA, Kamal MA, Anwar F. Risk of colorectal cancer in inflammatory bowel diseases. Semin Cancer Biol. 2020;64:51-60.
doi pubmed - Sartor RB. Mechanisms of disease: pathogenesis of Crohn's disease and ulcerative colitis. Nat Clin Pract Gastroenterol Hepatol. 2006;3(7):390-407.
doi pubmed - Dignass AU, Baumgart DC, Sturm A. Review article: the aetiopathogenesis of inflammatory bowel disease—immunology and repair mechanisms. Aliment Pharmacol Ther. 2004;20(Suppl 4):9-17.
doi pubmed - Leal RF, Silva FAR. Defective autophagy in mesenteric fat tissue maintains inflammation in Crohn’s Disease. In Autophagy: Cancer, Other Pathologies, Inflammation, Immunity, Infection, and Aging. 2017; Elsevier. p. 313-323.
- Lee SH, Kwon JE, Cho ML. Immunological pathogenesis of inflammatory bowel disease. Intest Res. 2018;16(1):26-42.
doi pubmed pmc - Clark-Snustad KD, Lee SDJTiGE. Diagnosing inflammatory bowel disease and differentiating it from potential mimics. Tech Gastrointest Endosc. 2016;18(3):108-115.
- Biasci D, Lee JC, Noor NM, Pombal DR, Hou M, Lewis N, Ahmad T, et al. A blood-based prognostic biomarker in IBD. Gut. 2019;68(8):1386-1395.
doi pubmed pmc - Yong HEJ, Chan SY. Current approaches and developments in transcript profiling of the human placenta. Hum Reprod Update. 2020;26(6):799-840.
doi pubmed pmc - Huang P, Gu J, Wu J, Geng L, Hong Y, Wang S, Wang M. Microarray analysis of the molecular mechanisms associated with age and body mass index in human meniscal injury. Mol Med Rep. 2019;19(1):93-102.
doi pubmed pmc - Bonen DK, Cho JH. The genetics of inflammatory bowel disease. Gastroenterology. 2003;124(2):521-536.
doi pubmed - Hugot JP, Chamaillard M, Zouali H, Lesage S, Cezard JP, Belaiche J, Almer S, et al. Association of NOD2 leucine-rich repeat variants with susceptibility to Crohn's disease. Nature. 2001;411(6837):599-603.
doi pubmed - Burczynski ME, Peterson RL, Twine NC, Zuberek KA, Brodeur BJ, Casciotti L, Maganti V, et al. Molecular classification of Crohn's disease and ulcerative colitis patients using transcriptional profiles in peripheral blood mononuclear cells. J Mol Diagn. 2006;8(1):51-61.
doi pubmed pmc - Vancamelbeke M, Vermeire S. The intestinal barrier: a fundamental role in health and disease. Expert Rev Gastroenterol Hepatol. 2017;11(9):821-834.
doi pubmed pmc - Langmann T, Moehle C, Mauerer R, Scharl M, Liebisch G, Zahn A, Stremmel W, et al. Loss of detoxification in inflammatory bowel disease: dysregulation of pregnane X receptor target genes. Gastroenterology. 2004;127(1):26-40.
doi pubmed - De Micheaux PL, Drouilhet R, Liquet B, The R software. 2013; Springer.
- Smyth GK, Ritchie M, Thorne N, Wettenhall J. LIMMA: linear models for microarray data. In: Bioinformatics and Computational Biology Solutions Using R and Bioconductor. Statistics for Biology and Health. 2005.
- Blighe K, Rana S, Lewis MJRpv. Enhanced volcano: publication-ready volcano plots with enhanced colouring and labeling. 2019;1(0).
- Ashburner M, Ball CA, Blake JA, Botstein D, Butler H, Cherry JM, Davis AP, et al. Gene ontology: tool for the unification of biology. The Gene Ontology Consortium. Nat Genet. 2000;25(1):25-29.
doi pubmed pmc - Yu G, Wang LG, Han Y, He QY. clusterProfiler: an R package for comparing biological themes among gene clusters. OMICS. 2012;16(5):284-287.
doi pubmed pmc - http://cn.string-db.org.
- Bader GD, Hogue CW. An automated method for finding molecular complexes in large protein interaction networks. BMC Bioinformatics. 2003;4:2.
doi pubmed pmc - Sann H, Erichsen J, Hessmann M, Pahl A, Hoffmeyer A. Efficacy of drugs used in the treatment of IBD and combinations thereof in acute DSS-induced colitis in mice. Life Sci. 2013;92(12):708-718.
doi pubmed - Langner C, Magro F, Driessen A, Ensari A, Mantzaris GJ, Villanacci V, Becheanu G, et al. The histopathological approach to inflammatory bowel disease: a practice guide. Virchows Arch. 2014;464(5):511-527.
doi pubmed - Rubio CA, Lang-Schwarz C, Vieth M. Crypts in asymmetric fission in endoscopic biopsies from german patients with inflammatory bowel disease. Anticancer Res. 2021;41(9):4401-4405.
doi pubmed - Mosli MH, Feagan BG, Sandborn WJ, D'Haens G, Behling C, Kaplan K, Driman DK, et al. Histologic evaluation of ulcerative colitis: a systematic review of disease activity indices. Inflamm Bowel Dis. 2014;20(3):564-575.
doi pubmed - Lemmens B, Arijs I, Van Assche G, Sagaert X, Geboes K, Ferrante M, Rutgeerts P, et al. Correlation between the endoscopic and histologic score in assessing the activity of ulcerative colitis. Inflamm Bowel Dis. 2013;19(6):1194-1201.
doi pubmed - Palomino DC, Marti LC. Chemokines and immunity. Einstein (Sao Paulo). 2015;13(3):469-473.
doi pubmed pmc - Ha H, Debnath B, Neamati N. Role of the CXCL8-CXCR1/2 axis in cancer and inflammatory diseases. Theranostics. 2017;7(6):1543-1588.
doi pubmed pmc - Gijsbers K, Van Assche G, Joossens S, Struyf S, Proost P, Rutgeerts P, Geboes K, et al. CXCR1-binding chemokines in inflammatory bowel diseases: down-regulated IL-8/CXCL8 production by leukocytes in Crohn's disease and selective GCP-2/CXCL6 expression in inflamed intestinal tissue. Eur J Immunol. 2004;34(7):1992-2000.
doi pubmed - Vogl T, Gharibyan AL, Morozova-Roche LA. Pro-inflammatory S100A8 and S100A9 proteins: self-assembly into multifunctional native and amyloid complexes. Int J Mol Sci. 2012;13(3):2893-2917.
doi pubmed pmc - Ryckman C, Vandal K, Rouleau P, Talbot M, Tessier PA. Proinflammatory activities of S100: proteins S100A8, S100A9, and S100A8/A9 induce neutrophil chemotaxis and adhesion. J Immunol. 2003;170(6):3233-3242.
doi pubmed - Wang S, Song R, Wang Z, Jing Z, Wang S, Ma J. S100A8/A9 in Inflammation. Front Immunol. 2018;9:1298.
doi pubmed pmc - Song X, Qian Y. The activation and regulation of IL-17 receptor mediated signaling. Cytokine. 2013;62(2):175-182.
doi pubmed - Gu C, Wu L, Li X. IL-17 family: cytokines, receptors and signaling. Cytokine. 2013;64(2):477-485.
doi pubmed pmc - Diamond MS, Farzan M. The broad-spectrum antiviral functions of IFIT and IFITM proteins. Nat Rev Immunol. 2013;13(1):46-57.
doi pubmed pmc - Gashler A, Sukhatme VP. Early growth response protein 1 (Egr-1): prototype of a zinc-finger family of transcription factors. Prog Nucleic Acid Res Mol Biol. 1995;50:191-224.
doi pubmed - Poirier R, Cheval H, Mailhes C, Garel S, Charnay P, Davis S, Laroche S. Distinct functions of egr gene family members in cognitive processes. Front Neurosci. 2008;2(1):47-55.
doi pubmed pmc - Kumbrink J, Kirsch KH, Johnson JP. EGR1, EGR2, and EGR3 activate the expression of their coregulator NAB2 establishing a negative feedback loop in cells of neuroectodermal and epithelial origin. J Cell Biochem. 2010;111(1):207-217.
doi pubmed pmc - Li S, Miao T, Sebastian M, Bhullar P, Ghaffari E, Liu M, Symonds AL, et al. The transcription factors Egr2 and Egr3 are essential for the control of inflammation and antigen-induced proliferation of B and T cells. Immunity. 2012;37(4):685-696.
doi pubmed pmc - Nourshargh S, Alon R. Leukocyte migration into inflamed tissues. Immunity. 2014;41(5):694-707.
doi pubmed - Hughes CE, Nibbs RJB. A guide to chemokines and their receptors. FEBS J. 2018;285(16):2944-2971.
doi pubmed pmc
This article is distributed under the terms of the Creative Commons Attribution Non-Commercial 4.0 International License, which permits unrestricted non-commercial use, distribution, and reproduction in any medium, provided the original work is properly cited.
Gastroenterology Research is published by Elmer Press Inc.