Figures
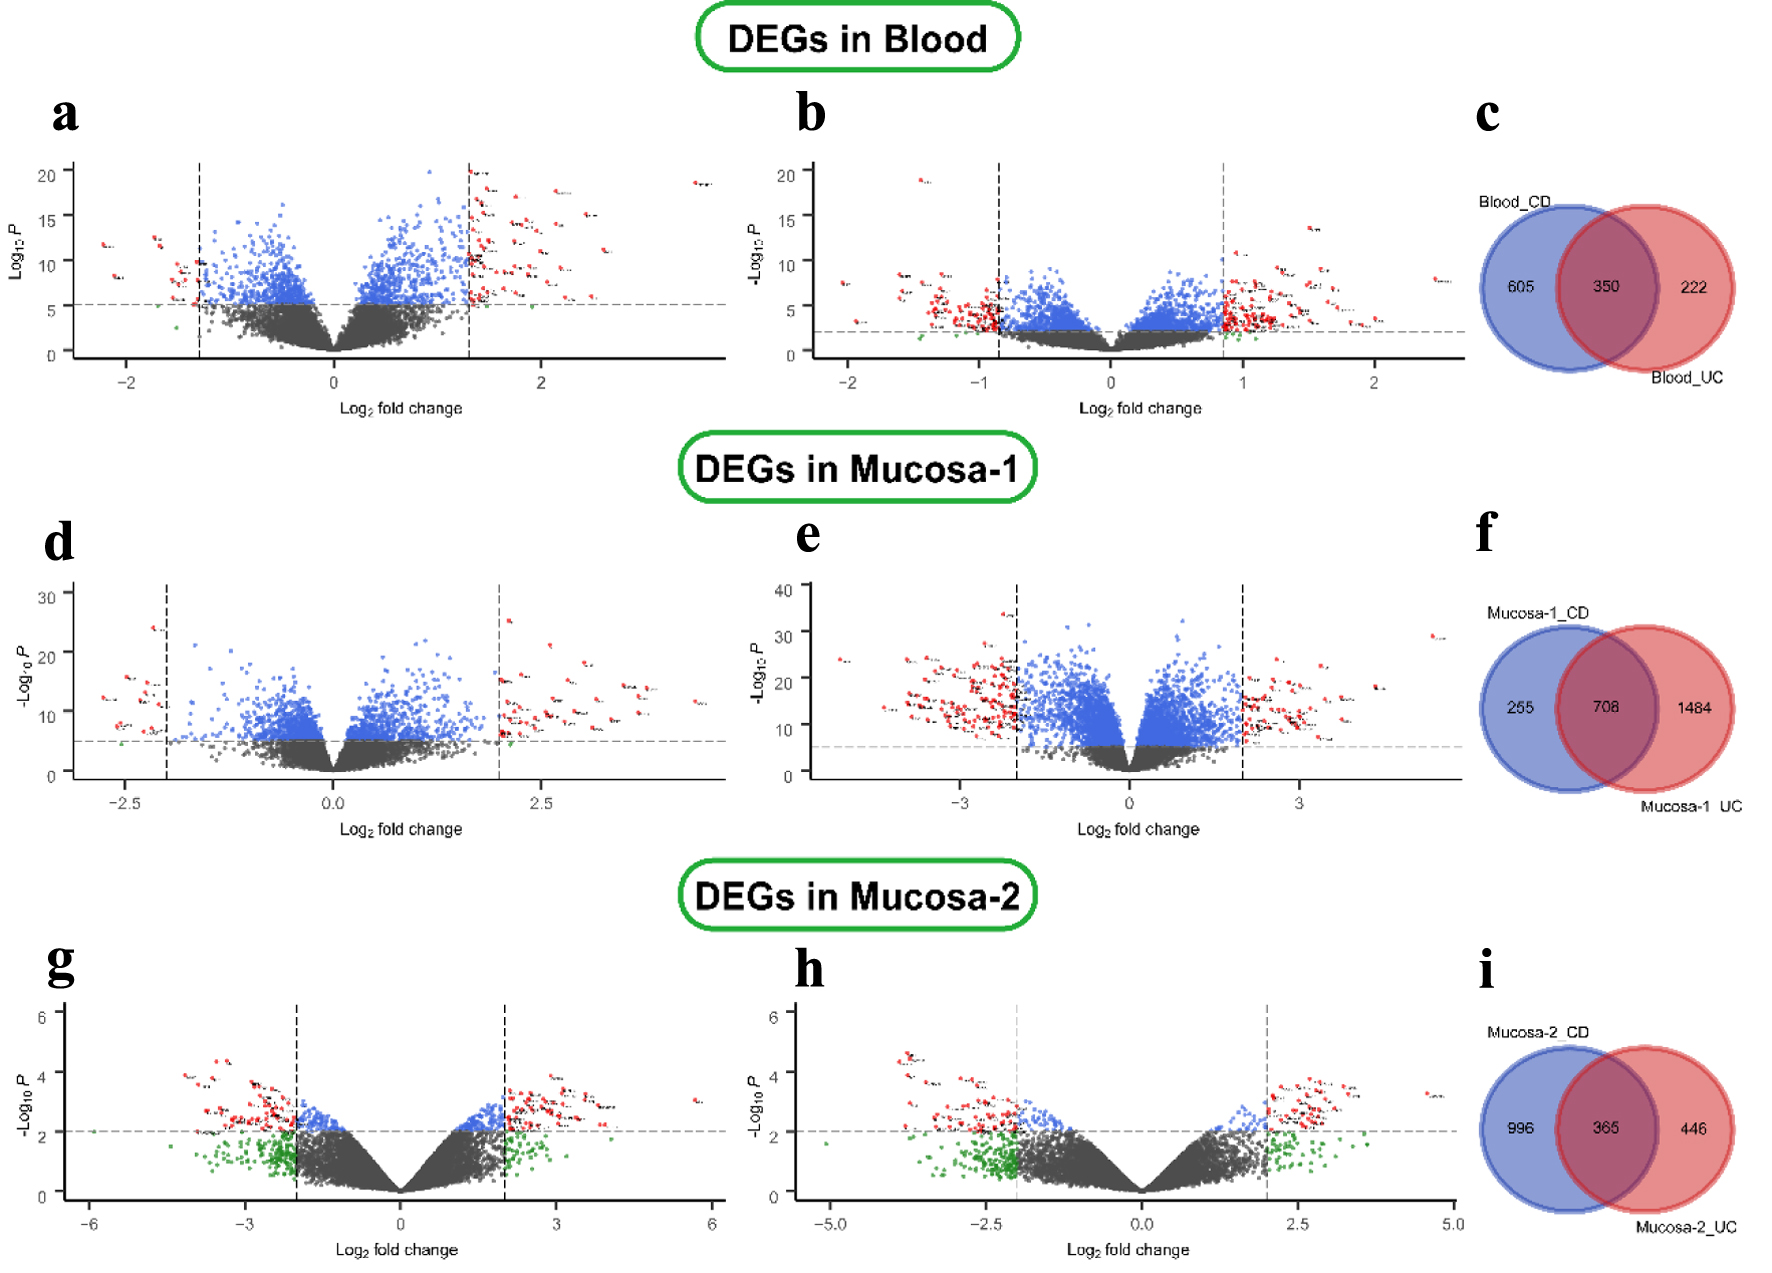
Figure 1. Differential expression genes in CD and UC from three datasets. (a) GSE3365 data in the blood CD samples, (b) UC samples, (d, e) GSE75214 data in the mucosa, and (g, h) GSE1141 data in the mucosa. The red points represent DEGs screened based on |log2 fold change| ≥ 1 and a corrected P-value of < 0.05. The green points represent DEGs screened based on |log2 FC| > cut-off, and the blue points represent DEGs screened based on a corrected P-value < 0.05. The black points represent genes with no significant difference. (c, f, i) Shared and specific DEGs of CD and UC in the blood (c), in mucosa-1 (f), and in mucosa-2 (i). CD: Crohn’s disease; DEGs: differentially expressed genes; UC: ulcerative colitis.
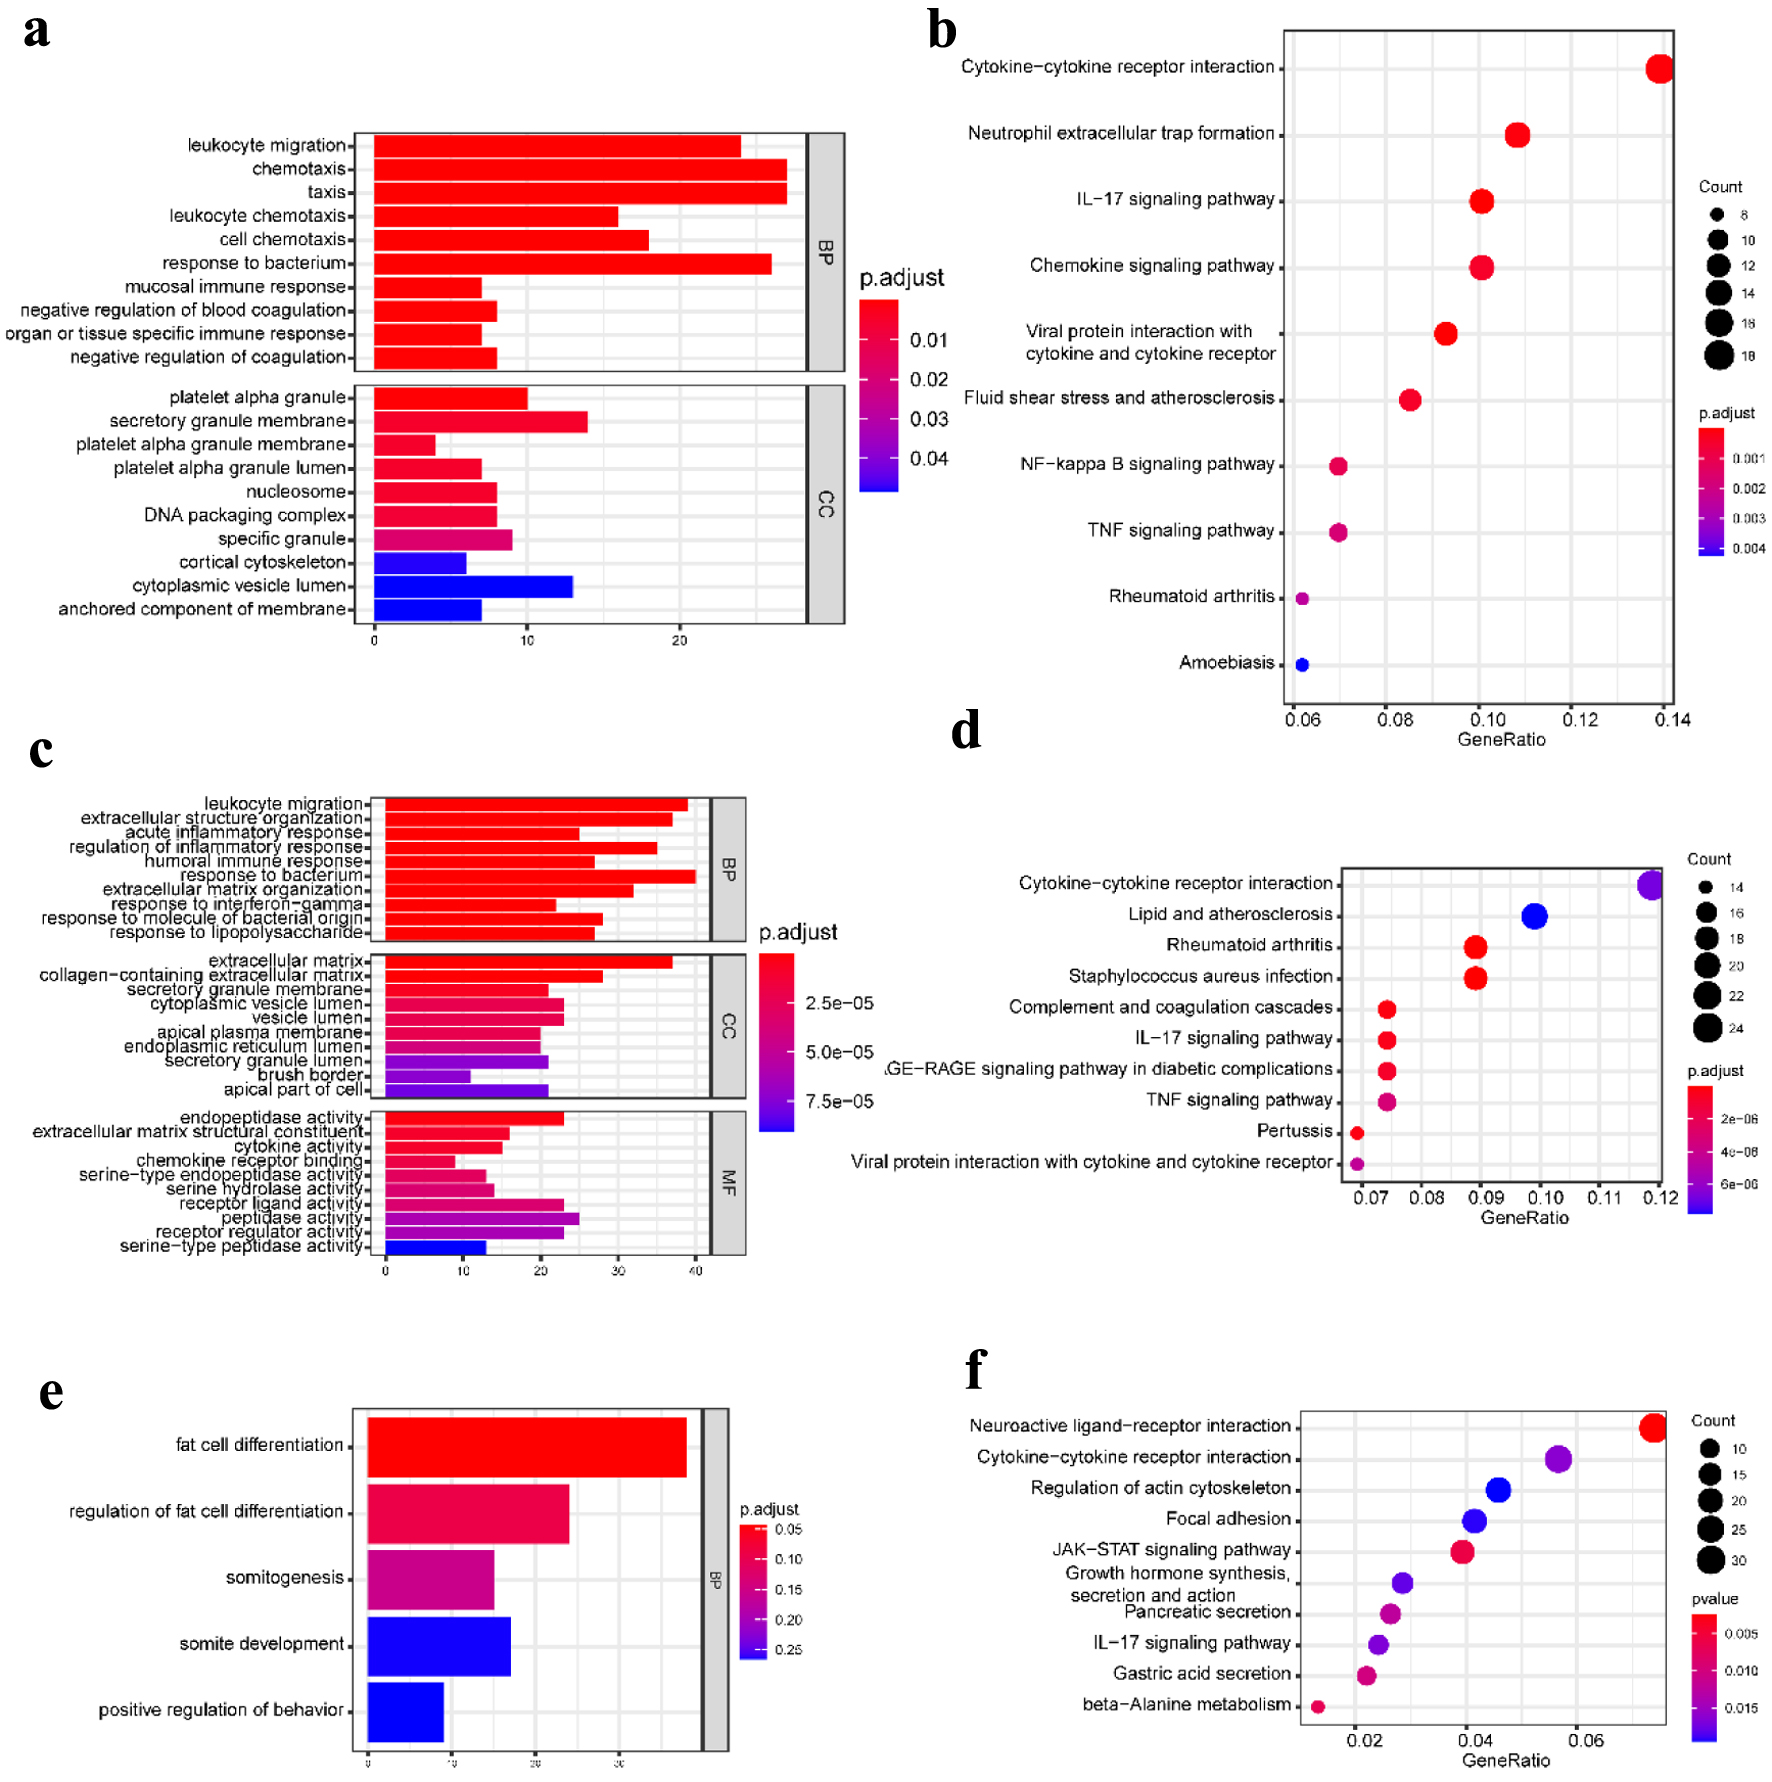
Figure 2. GO functional enrichment and KEGG pathway analysis of the significant DEGs in the CD group. (a) The top 10 GO terms in BP and CC, and (b) the top 10 KEGG pathways in the blood (dataset GSE3365). (c) The top 10 GO terms in BP, CC, and MF, respectively, and (d) the top 10 KEGG pathways in the mucosa-1 (dataset GSE75214). (e) The most significant GO terms and (f) the top 10 KEGG pathways in the mucosa-2 (dataset GSE1141). The vertical axis represents the GO or KEGG pathway terms significantly enriched by the DEGs; the horizontal axis indicates the negative Log10 (P-value). GO: Gene Ontology; KEGG: Kyoto Encyclopedia of Genes and Genomes; DEGs: differentially expressed genes; BP: biological progress; CC: cellular component; MF: molecular function; CD: Crohn’s disease.

Figure 3. GO functional enrichment and KEGG pathway analysis of the significant DEGs in the UC group. (a) The top 10 GO terms in BP and CC and (b) the top 10 KEGG pathways in the blood (dataset GSE3365). (c) The top 10 GO terms in BP, CC, and MF, and (d) the top 10 KEGG pathways in the mucosa-1 (dataset GSE75214). (e) The most significant GO terms and (f) the significant KEGG pathways in the mucosa-2 (dataset GSE1141). The vertical axis represents the GO or KEGG pathway terms significantly enriched by the DEGs; the horizontal axis indicates the negative Log10 (P-value). GO: Gene Ontology; KEGG: Kyoto Encyclopedia of Genes and Genomes; DEGs: differentially expressed genes; BP: biological progress; CC: cellular component; MF: molecular function; UC: ulcerative colitis.
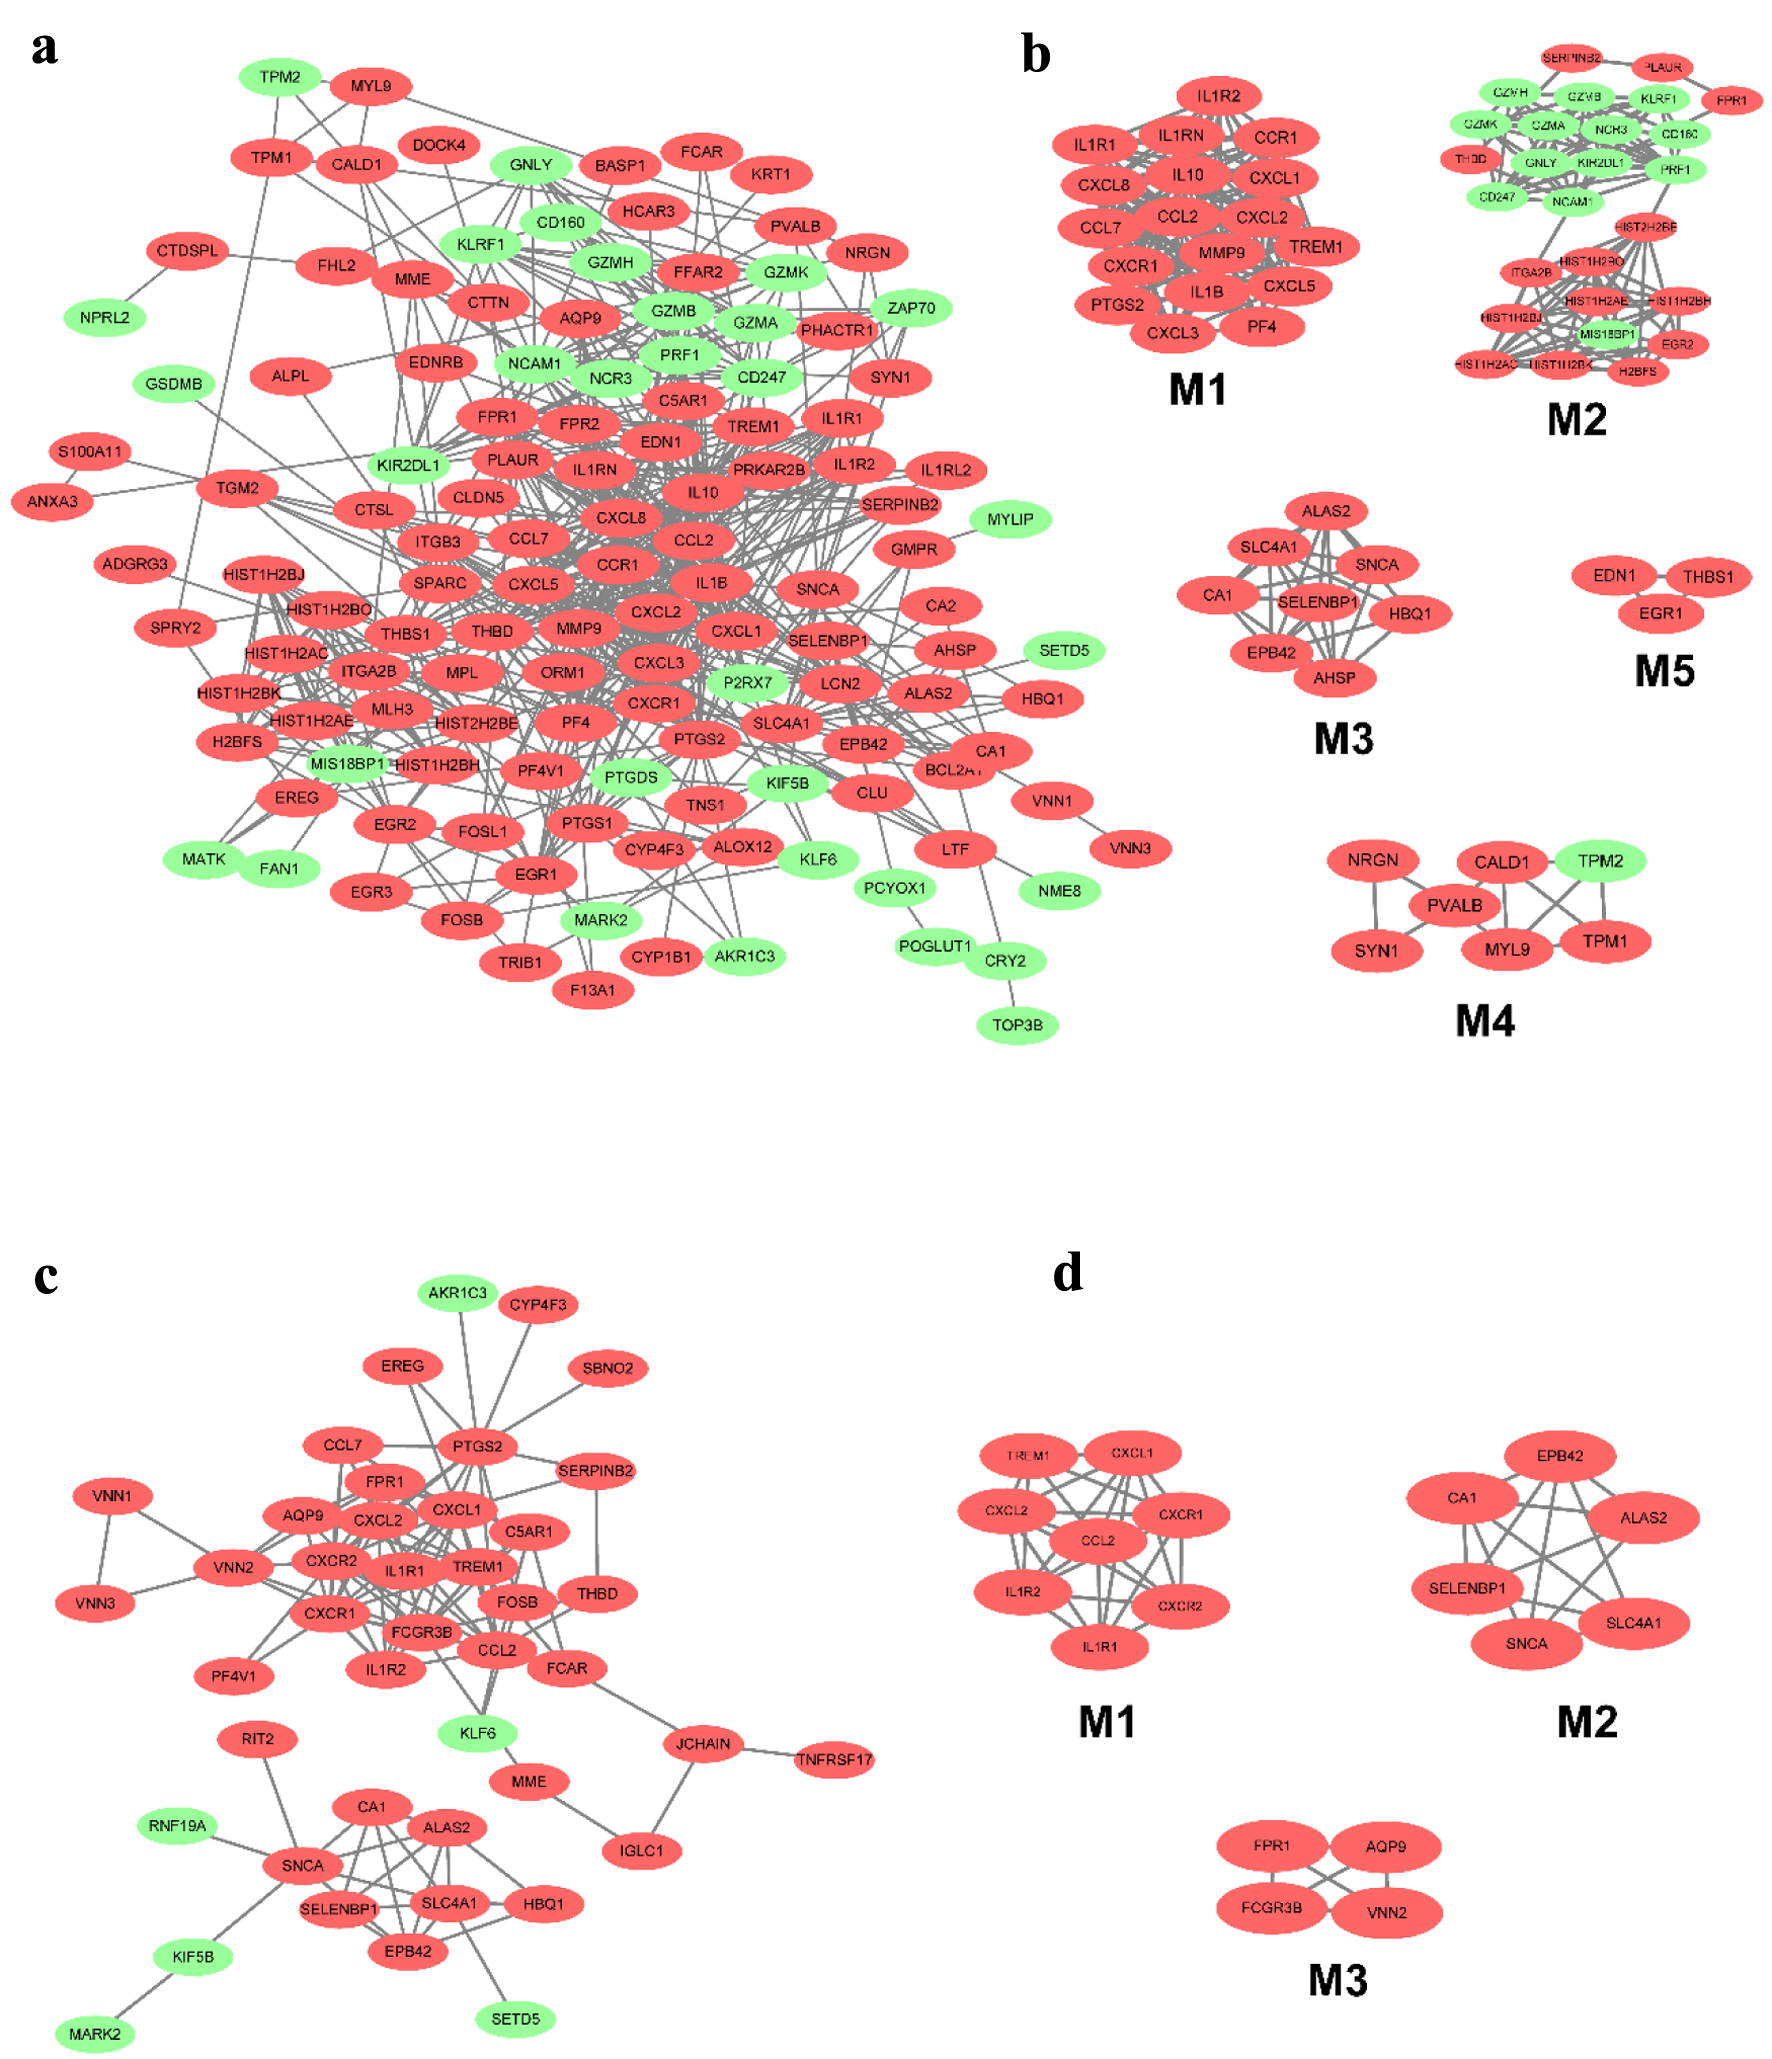
Figure 4. The PPI network of DEGs from the blood in CD and UC. (a) The PPI network of DEGs of blood in CD was constructed using Cytoscape software. (b) The most significant five modules were obtained from the PPI network of CD. (c) The PPI network of DEGs of blood in UC was constructed using Cytoscape software. (d) The most significant three modules were obtained from the PPI network of UC. The upregulated DEGs are marked in red, and the downregulated genes are marked in green. CD: Crohn’s disease; DEGs: differentially expressed genes; PPI: protein-protein interaction; UC: ulcerative colitis.
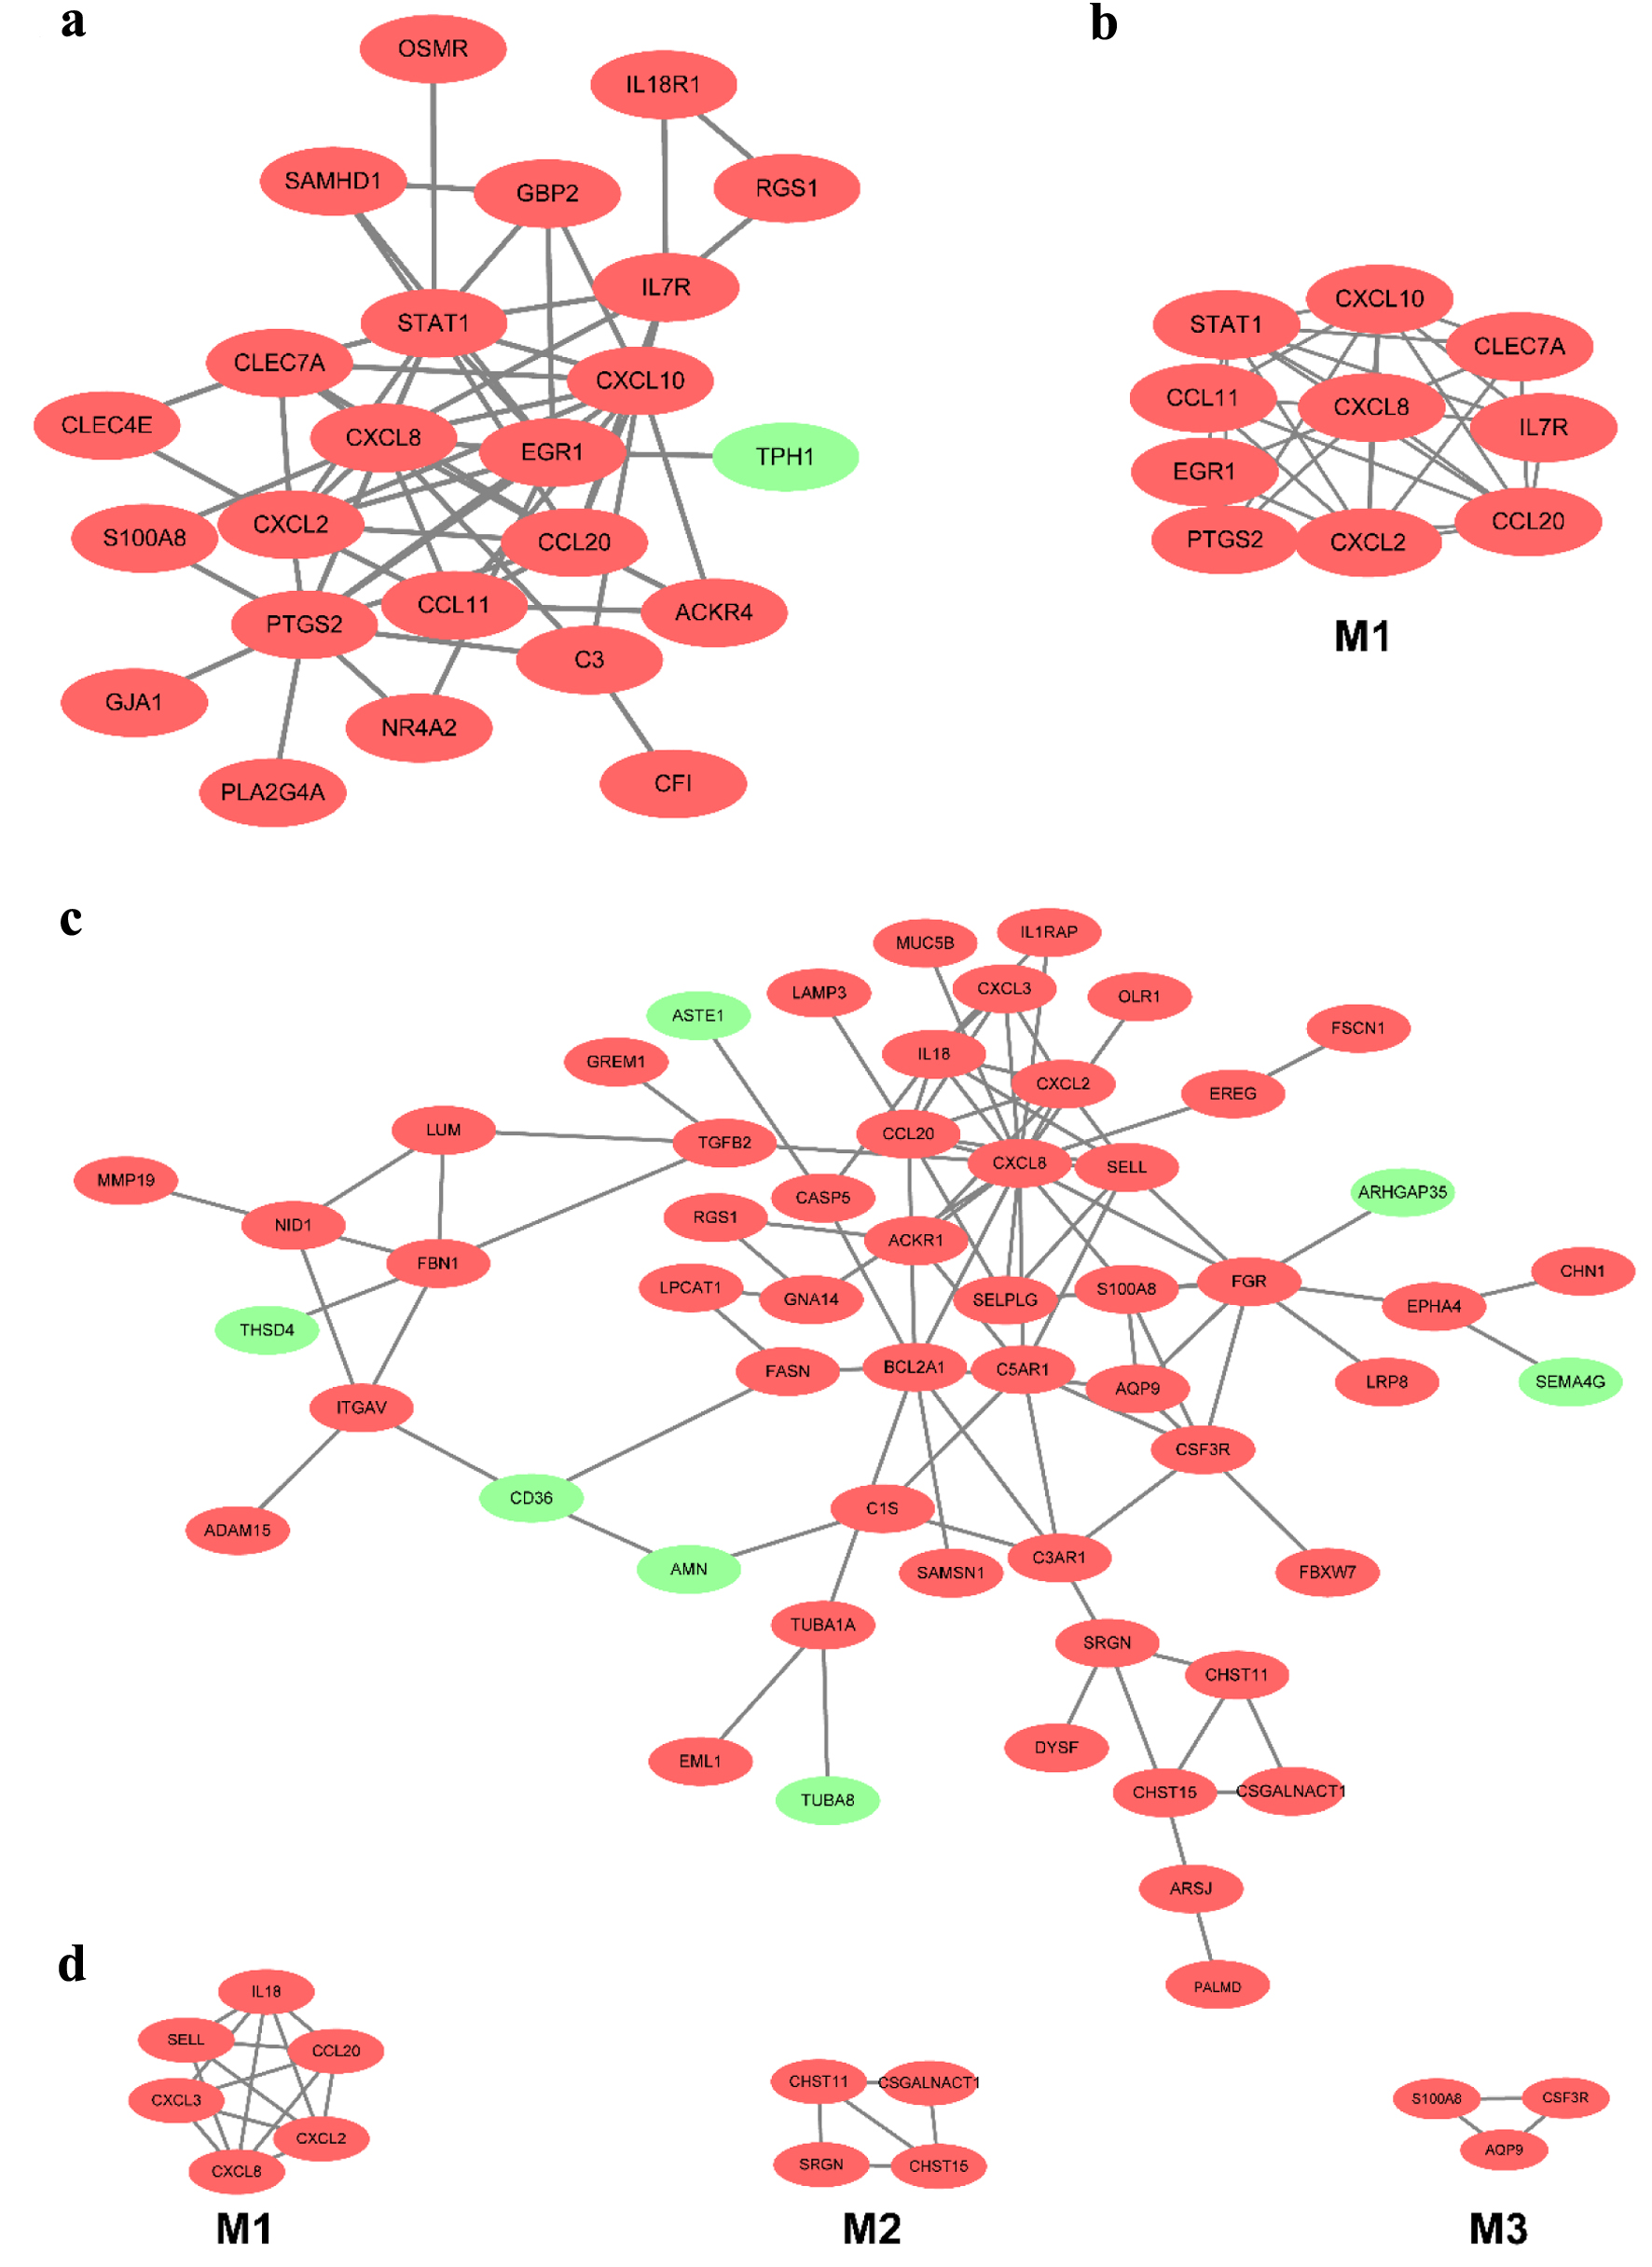
Figure 5. The PPI network of DEGs of two datasets from the mucosa in CD and UC. (a) The PPI network of DEGs of two datasets from the mucosa in CD. (b) The most significant module was obtained from the PPI network in CD. (c) The PPI network of DEGs of two datasets from the mucosa in UC. (d) The most significant three modules were obtained from the PPI network in UC. The upregulated DEGs are marked in red, and the downregulated genes are marked in green. CD: Crohn’s disease; DEGs: differentially expressed genes; PPI: protein-protein interaction; UC: ulcerative colitis.
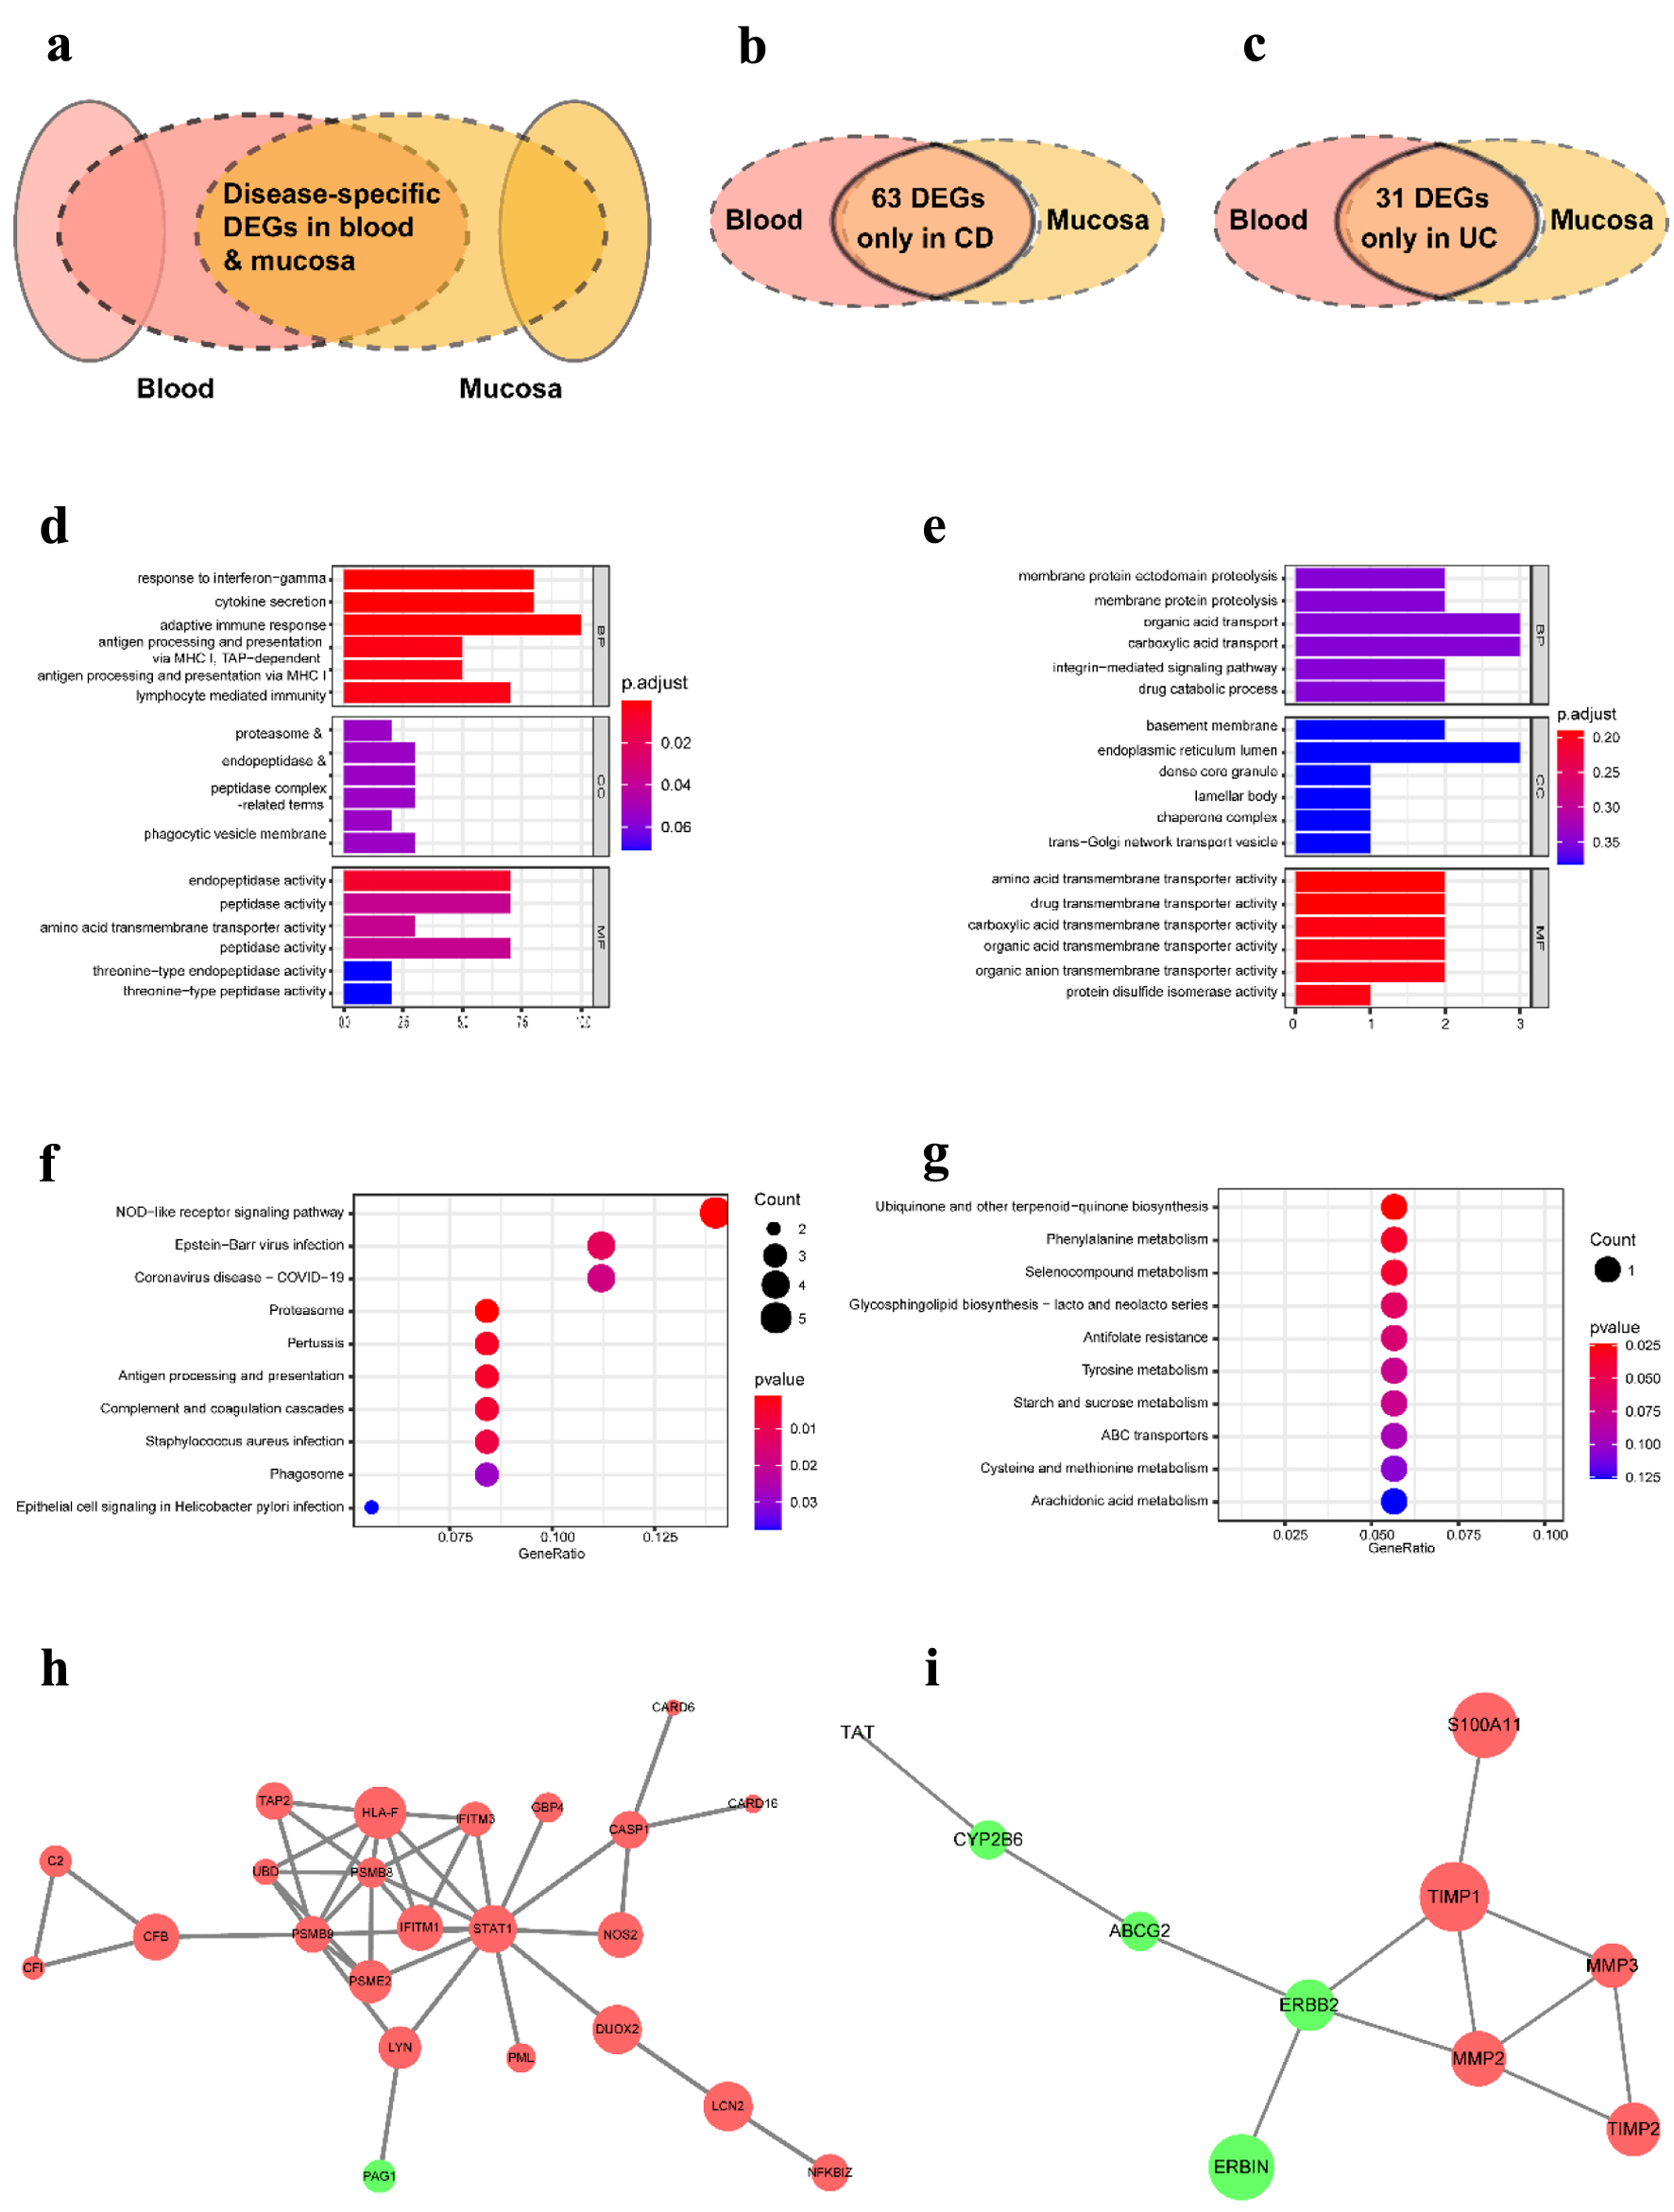
Figure 6. The distinct pathological mechanism of CD and UC at the tissue-specific level. (a) Schematic representation of DEGs used for analysis. (b) Venn diagram of DEGs in CD from three datasets. (c) Venn diagram of DEGs in UC from three datasets. (d, e) The most significant GO terms of CD-specific DEGs (d) and UC-specific DEGs (e). (f, g) The most significant KEGG pathways of CD-specific DEGs (f) and UC-specific DEGs (g). (h, i) The PPI network contrasted based on only identified in CD (h) and only in UC (i). GO: Gene Ontology; KEGG: Kyoto Encyclopedia of Genes and Genomes; DEGs: differentially expressed genes; CD: Crohn’s disease; UC: ulcerative colitis.
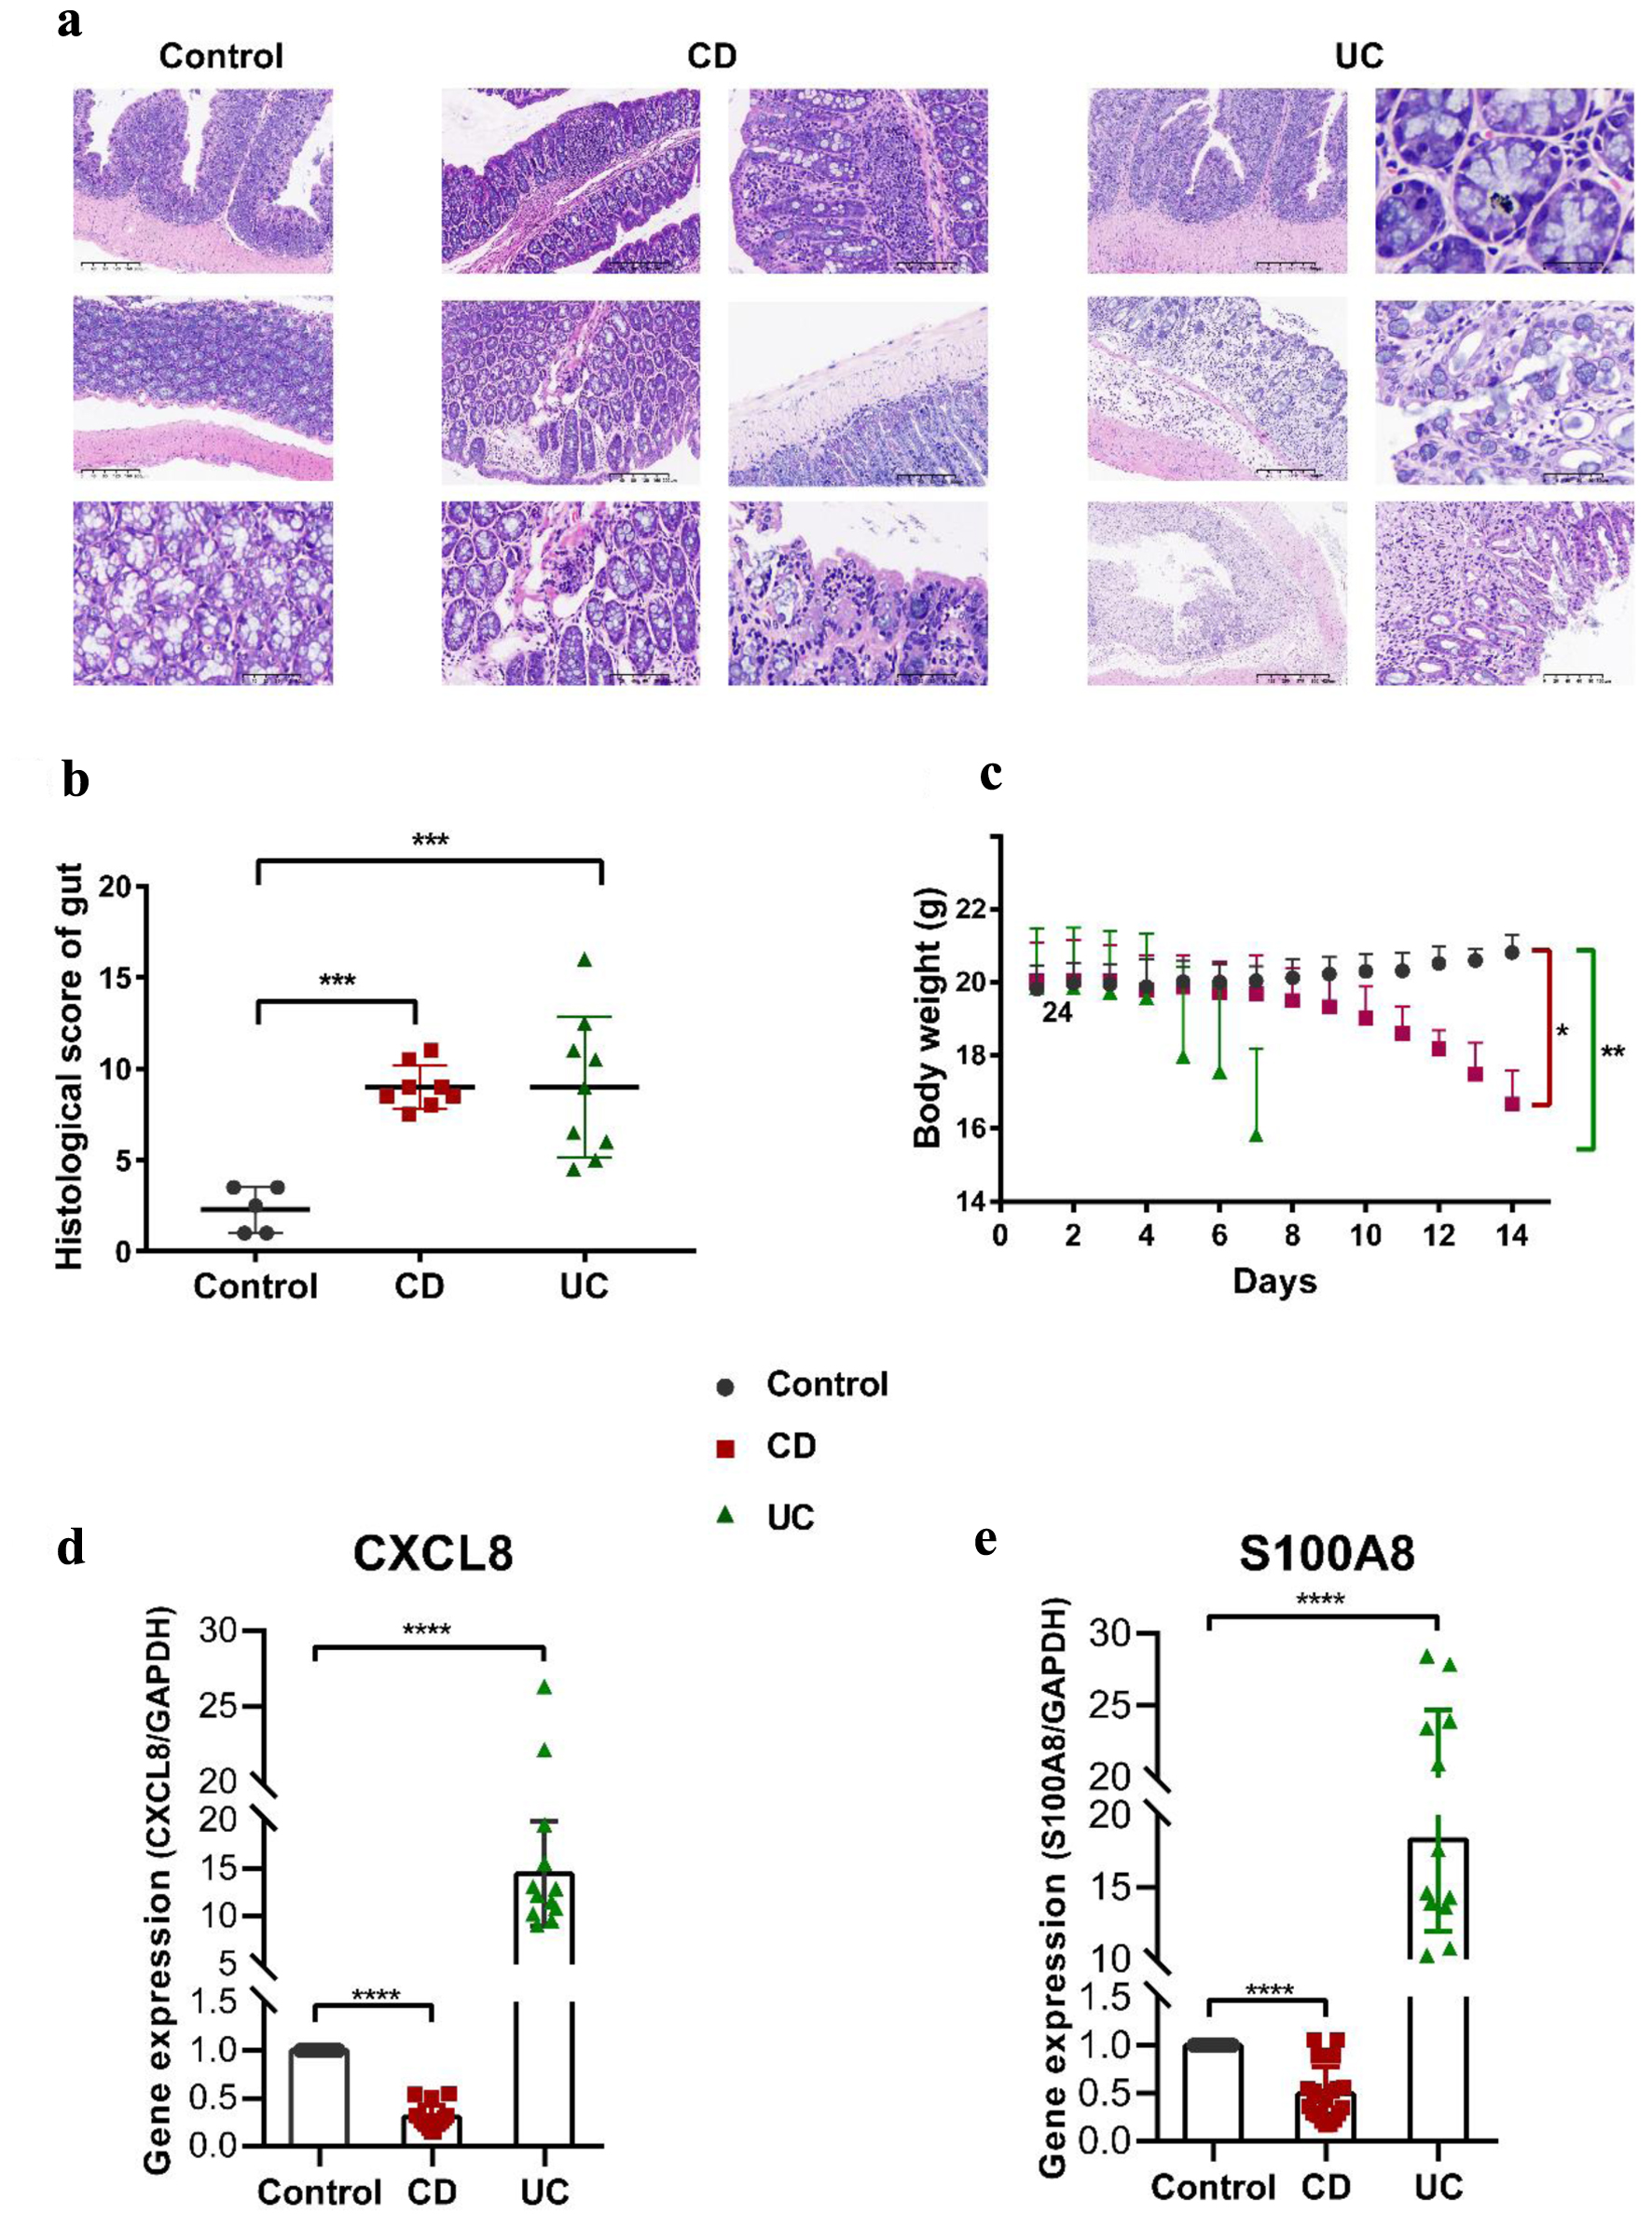
Figure 7. Pathophysiological analysis and marker gene validation using the IBD model mice. (a) Representative microscopy images of H&E-stained colonic sections. (b) Histological scoring of the colon section. Data were expressed as means ± SD (***P < 0.001). (c) Changes in body weight with a time of administration. (d, e) RT-PCR analysis. ****P < 0.0001 (Student’s t-test). Error bars represent SD. IBD: inflammatory bowel disease; RT-PCR: real-time polymerase chain reaction; SD: standard deviation; H&E: hematoxylin and eosin.
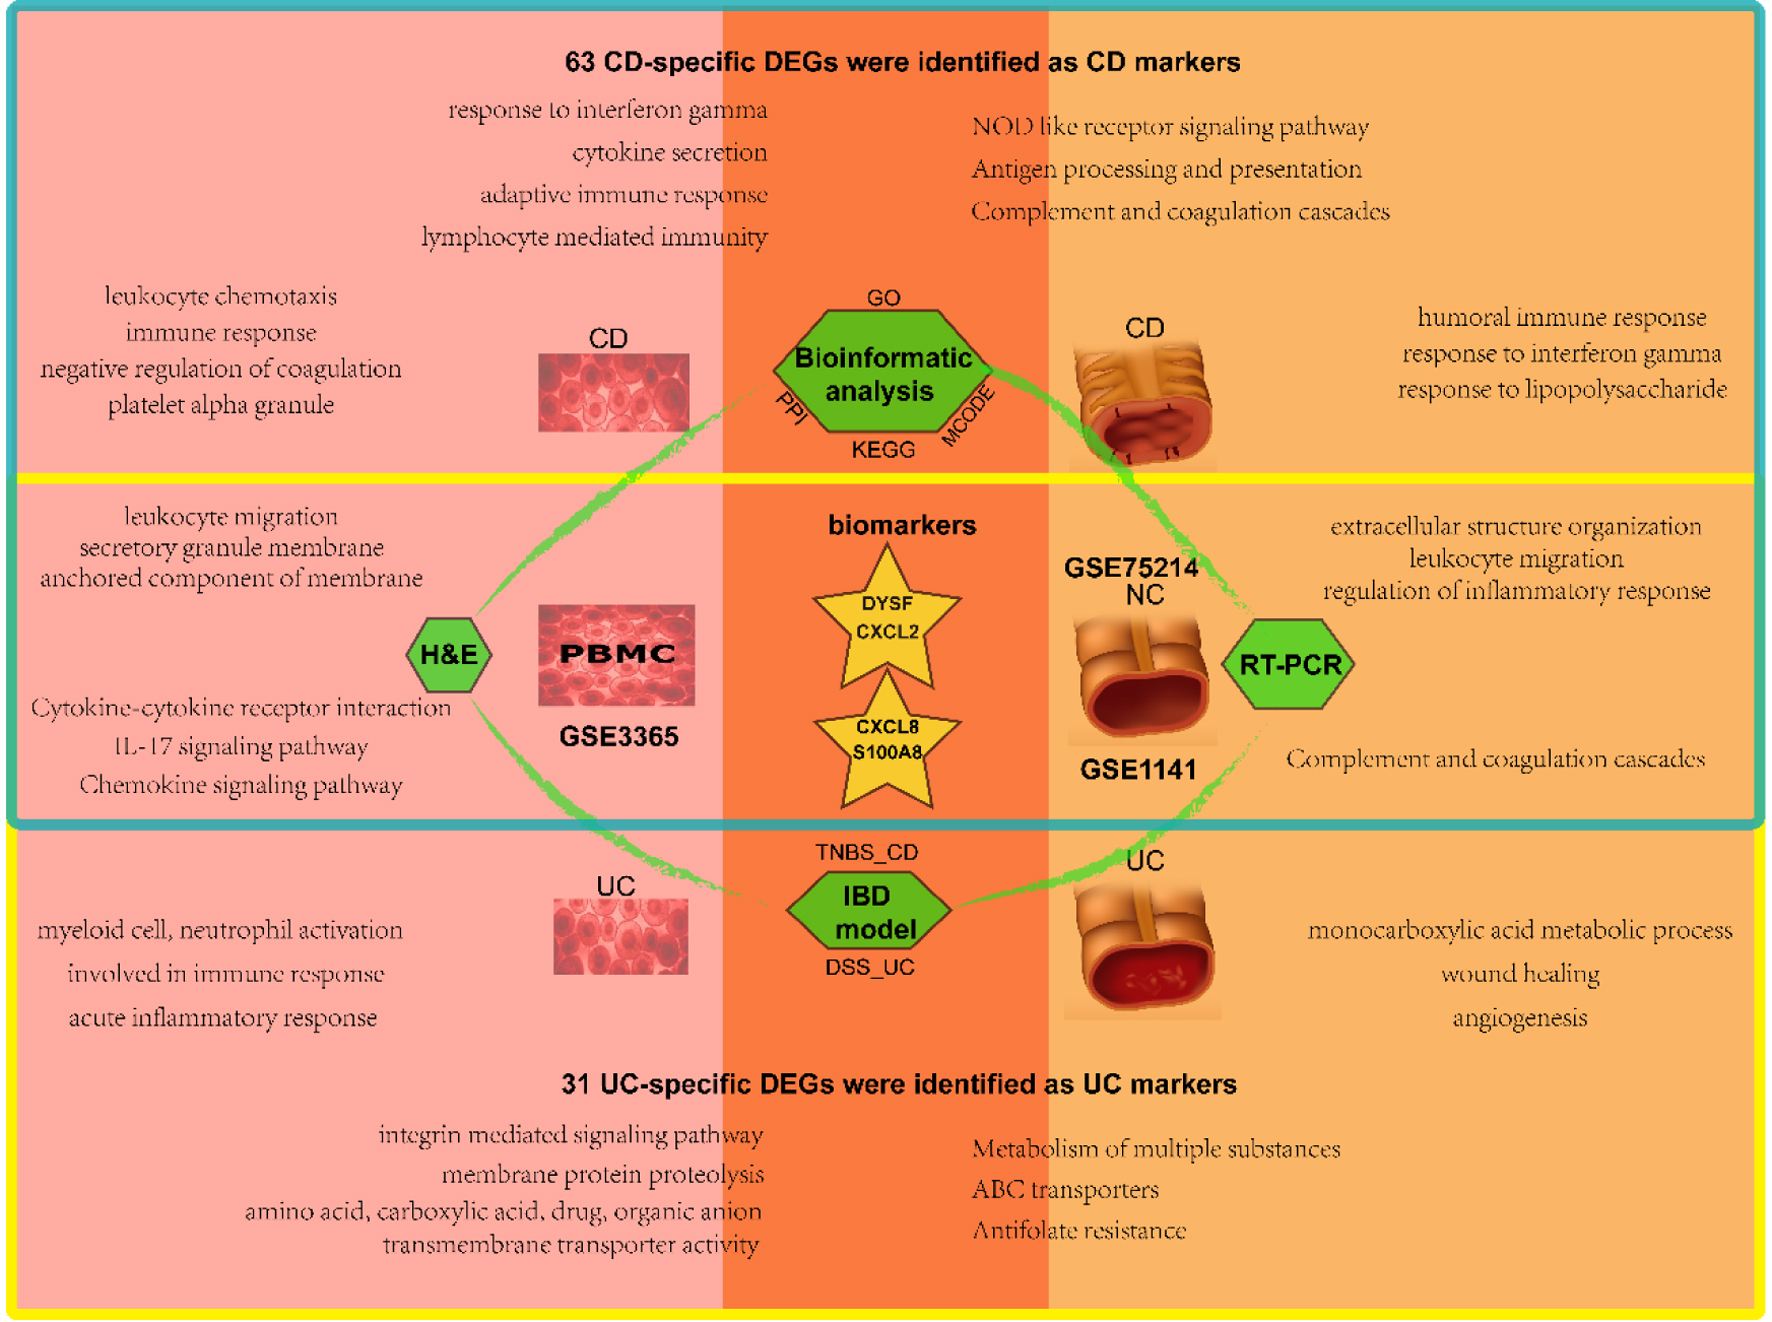
Figure 8. Schematic diagram of analysis and main results in this study. The blood samples are on the left and the mucosal samples on the right, with CD in the upper blue box and UC in the lower yellow box. The overlap represents the shared results. CD: Crohn’s disease; UC: ulcerative colitis.
Table
Table 1. Details for GEO Data
| Reference | Sample | GEO | Platform | Normal | UC | CD |
|---|
| GEO: Gene Expression Omnibus; UC: ulcerative colitis; CD: Crohn’s disease. |
| Burczynski et al [17] | Blood | GSE3365 | GPL96 | 42 | 26 | 59 |
| Vancamelbeke et al [18] | Mucosa | GSE75214 | GPL6244 | 22 | 97 | 75 |
| Langmann et al [19] | Mucosa | GSE1141 | GPL96 | 2 | 2 | 2 |