

| Gastroenterology Research, ISSN 1918-2805 print, 1918-2813 online, Open Access |
| Article copyright, the authors; Journal compilation copyright, Gastroenterol Res and Elmer Press Inc |
| Journal website http://www.gastrores.org |
Original Article
Volume 12, Number 6, December 2019, pages 288-298
Diagnosis of Liver Neoplasms by Computational and Statistical Image Analysis
Rong Xiaa, Amir M. Boroujenia, Stephanie Sheab, Yongsheng Pana, Raag Agrawala, Elhem Yousefia, M. Isabel Fielb, M.A. Haseeba, Raavi Guptaa, c
aDepartment of Pathology, State University of New York, Downstate Medical Center, Brooklyn, NY 11203, USA
bDepartment of Pathology, Mount Sinai Hospital and Icahn School of Medicine, New York, NY 10029, USA
cCorresponding Author: Raavi Gupta, Department of Pathology, State University of New York, Downstate Medical Center, Brooklyn, NY 11203, USA
Manuscript submitted July 29, 2019, accepted August 12, 2019
Short title: Computational Analysis of Liver Neoplasms
doi: https://doi.org/10.14740/gr1210
| Abstract | ▴Top |
Background: Distinguishing well-differentiated hepatocellular carcinoma (WD-HCC), hepatocellular adenoma (HA) and non-neoplastic liver tissue (NNLT) solely on morphology is often challenging. The purpose of this study was to evaluate the use of computational image analysis to distinguish WD-HCC, HA and NNLT.
Methods: Seventy-seven cases comprising of WD-HCC (n = 26), HA (n = 23) and NNLT (n = 28) were retrieved and reviewed. A total of 485 hematoxylin and eosin (H&E) photomicrographs (× 400, 0.09 µm2) of WD-HCC (n = 183), HA (n = 173), NNLT (n = 129) and nine whole-slide scans (three of each diagnosis) were obtained, color deconvoluted and digitally transformed. Quantitative data including nuclear density, nuclear sphericity, nuclear perimeter, and nuclear eccentricity from each image were acquired. The data were analyzed by one-way analysis of variance (ANOVA) with Tukey post hoc test, followed by unsupervised and supervised (Chi-square automatic interaction detection (CHAID)) cluster analysis.
Results: Unsupervised cluster analysis identified three well defined clusters of WD-HCC, HA and NNLT. Employing the four most discriminating nuclear features, supervised analysis was performed on a training set of 383 images, and validated on the remaining 102 test images. The analysis identified WD-HCC (sensitivity 100%, specificity 98%), HA (sensitivity 71%, specificity 85%) and NNLT (sensitivity 70%, specificity 86%). An analysis of whole-slide images identified WD-HCC with sensitivity and specificity of 100%.
Conclusions: We have successfully demonstrated that computational image analysis of nuclear features can differentiate WD-HCC from non-malignant liver with high accuracy, and can be used to assist in the histopathological diagnosis of hepatocellular carcinoma.
Keywords: Image analysis; Liver; Hepatocellular carcinoma; Hepatocellular adenoma; Computational analysis
| Introduction | ▴Top |
Because of their morphologic similarities, histopathologic differentiation of well-differentiated hepatocellular carcinoma (WD-HCC), hepatocellular adenoma (HA), and adjacent normal liver can be challenging especially in core needle biopsy specimens [1]. The classic morphology of hepatocellular carcinoma (HCC) is described as more than two layers of cells in the hepatic plate [2], however, assessment of the hepatic plate thickness is often difficult, and immunohistochemical (cluster of differentiation (CD)34, glypican-3) and special stains (reticulin) are employed in diagnosis [1]. Other morphologic features that favor a diagnosis of HCC include cytological atypia, nuclear pleomorphism, pseudoglandular/acinar architecture, high nuclear/cytoplasmic ratio (N/C ratio), increased mitotic activity, and vascular invasion. These features may or may not be present in WD-HCC, with focal pseudoglandular/acinar architecture and cytological atypia occasionally seen in HA.
HA is composed of proliferating hepatocytes arranged in hepatic plates of one to two cells and intact reticulin framework with minimal departure from normal liver architecture. Absence of portal tracts and presence of interspersed dilated venous channels and unpaired arterioles help distinguish HA from adjacent normal liver, however, these features may not always be discernible. Differentiation of HA from WD-HCC may also be difficult due to compression of sinusoids in HA and loss of portal tracts in both tumors [3]. These distinctions can be especially challenging in atypical clinical settings, such as pediatric patients or young females taking oral contraceptives, where HCC is more likely to resemble HA [4, 5]. Moreover, the β-catenin-activated subtype of HA shows frequent cytoarchitectural abnormalities, such as small cell change, pseudoacinar formation, and nuclear atypia, and is frequently associated with concurrent or subsequent HCC [6].
Computer-assisted image analysis can provide quantitative assessment of nuclear features that are difficult to measure by the human eye; these features include nuclear density, contour, area, perimeter, sphericity, eccentricity, and chromatin concentration [7-9]. A recent study has shown the potential diagnostic significance of using architectural and nuclear features in classifying HCC images in both surgically-resected and biopsy specimens. It suggested a prototype classification for HCC that was based on morphological features (nuclear and structural atypia) measured in whole slide images [10]. Attempts have been made to distinguish primary HCC from metastatic carcinomas and non-neoplastic liver tissue (NNLT) based on fractal dimension of morphometric elements integrated into an artificial neural network [11]. Another algorithm evaluated trabeculae segments from liver images by extracting the sinusoids and stromal area for the diagnosis of HCC [12]. However, none of these approaches has been used to quantify the histological features of WD-HCC, one of the most diagnostically challenging liver tumors, or to compare these features with those of benign liver neoplasms that morphologically mimic WD-HCC. Computational image analysis will enhance objectivity and accuracy in the diagnosis of liver tumors. Patients will benefit from definitive distinction between WD-HCC and HA as it influences treatment decisions [13-15].
In this study, we measured nuclear parameters including density, perimeter, sphericity, eccentricity, fill rate, convex perimeter, convex volume, and area to differentiate WD-HCC, HA, and NNLT by image and computational analysis. The parameters that were most useful in differentiating these entities were nuclear density, nuclear perimeter, nuclear sphericity and nuclear eccentricity. The latter parameters were subjected to unsupervised and supervised cluster analysis through hierarchical and k-means cluster analyses, and Chi-square automatic interaction detection analysis, respectively. The resultant algorithm was used to analyze both test images and whole slide images.
| Materials and Methods | ▴Top |
Case selection and image acquisition
Seventy-seven liver tissue samples derived from biopsies, surgical resections and autopsies were selected (Fig. 1). These included 28 NNLT specimens (12 biopsies; three autopsies; 13 surgical resections); 23 HA specimens (two biopsies; 21 surgical resections); 26 WD-HCC specimens (13 biopsies; 13 surgical resections). The NNLT specimens were determined to be normal liver tissue devoid of inflammation or fibrosis. The HA specimens included inflammatory (n = 9), HNF-1 alpha mutated (n = 8), β-catenin mutated (n = 2), and unclassified (n = 4) subtypes. WD-HCC specimens were morphologically uniform and devoid of variant features. All the adenomas were considered as one category for the analysis. Diagnosis was reviewed and confirmed by three pathologists, and their consensus interpretation was considered the correct diagnosis for comparison with the results of computational image analysis.
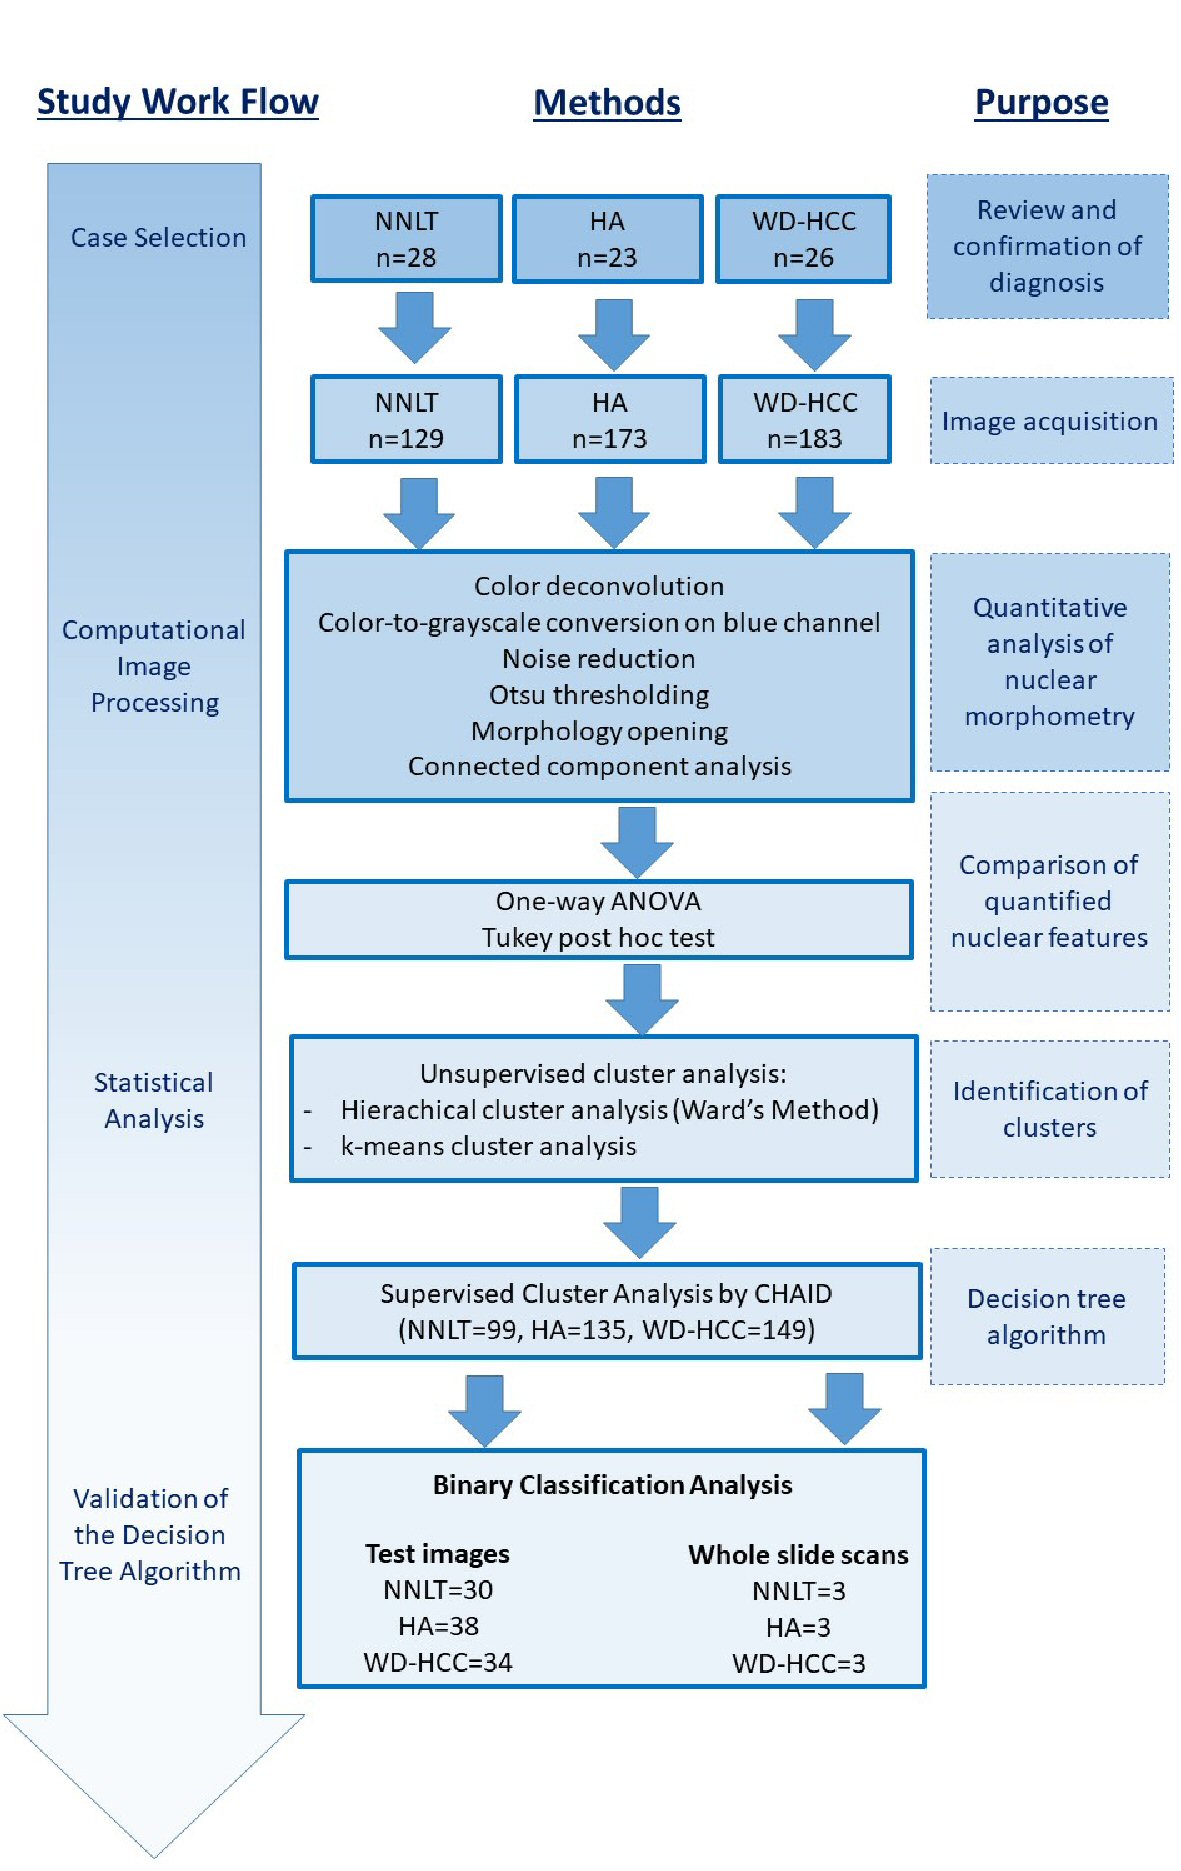 Click for large image | Figure 1. Illustration of work flow and methods for research. |
A total of 485 images of hematoxylin and eosin (H&E) stained sections of NNLT (n = 129), HA (n = 173) and WD-HCC (n = 183) were obtained under high power (× 400, 0.09 µm2) using an Olympus DP72® camera. Fields with portal triads, artifacts, marked fibrosis, inflammatory foci, necrosis, and sinusoidal dilatation were excluded from image acquisition. Whole slide scans of nine liver samples (three HA; three NNLT; three WD-HCC) were acquired using Mikroscan SL5 system and saved as BMP files. The regions of interest (ROIs) were annotated using QuPath software (Version: 0.1.2), excluding portal triads and areas of fibrosis (Fig. 2) [9, 16].
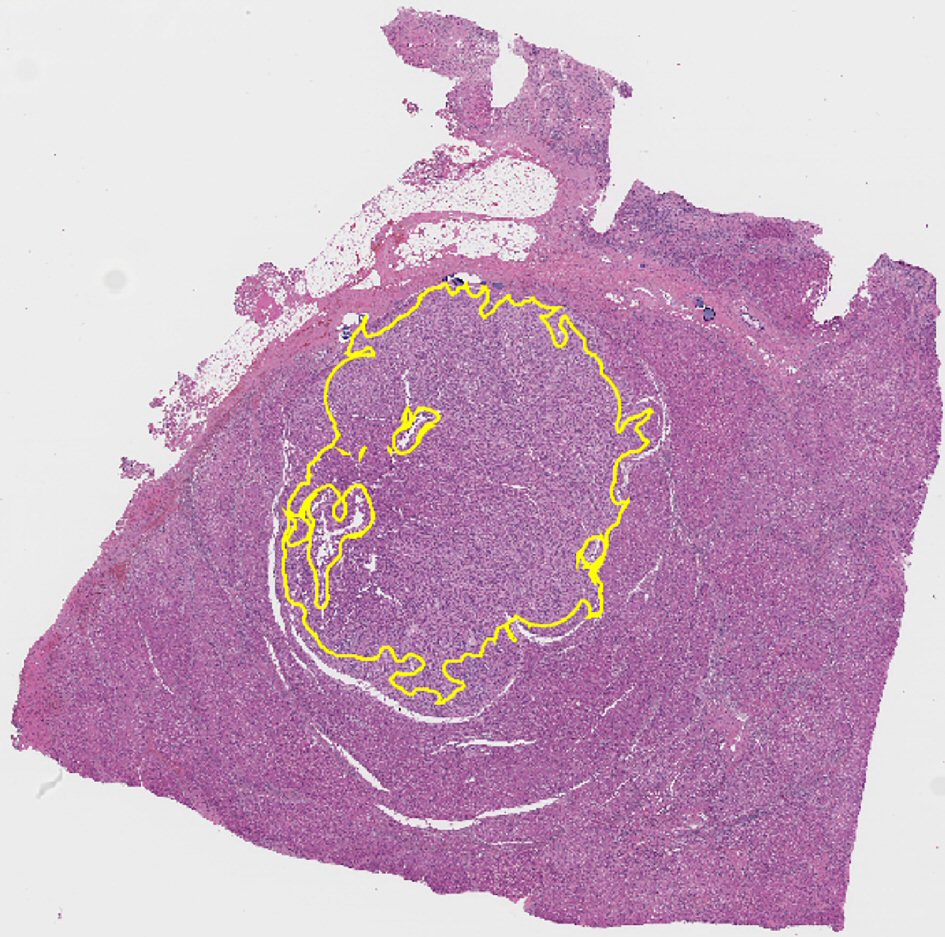 Click for large image | Figure 2. Representative whole slide scan of resected liver tissue showing region of interest selected for analysis demarcated in yellow. Note that it excludes portal tracts. |
All images were anonymized and use of patient samples complied with guidelines of institutional review board (IRB: 1059689-1).
Image processing and analysis
Based on the source code of ImageJ (1.52g, Java 1.8.0_66, Ver. 2.0.0), color deconvolution was applied to digital images to extract the hematoxylin blue, eosin pink, and residual color channels. Images of the hematoxylin blue channel underwent color-to-grayscale (luminance) conversion, noise reduction, Otsu thresholding, and morphological opening (Figs. 1, 3). These images were then processed for connected component analysis by the ICY bioimage platform (http://icy.bioimageanalysis.org) to measure nuclear parameters. The directly measured nuclear parameters included nuclear density, nuclear perimeter, nuclear sphericity, nuclear eccentricity, nuclear fill rate, nuclear convex perimeter, nuclear convex volume, and nuclear area (Fig. 1) [7, 17, 18]. The calculated parameters were: medians and standard deviations (SDs) of nuclear perimeter, nuclear sphericity, nuclear eccentricity, nuclear fill rate, nuclear convex perimeter, nuclear convex volume, and nuclear area. For each whole slide image, the tumor and normal areas were annotated, and tiles (with area size equaling that of acquired high power images) were extracted from the annotated areas.
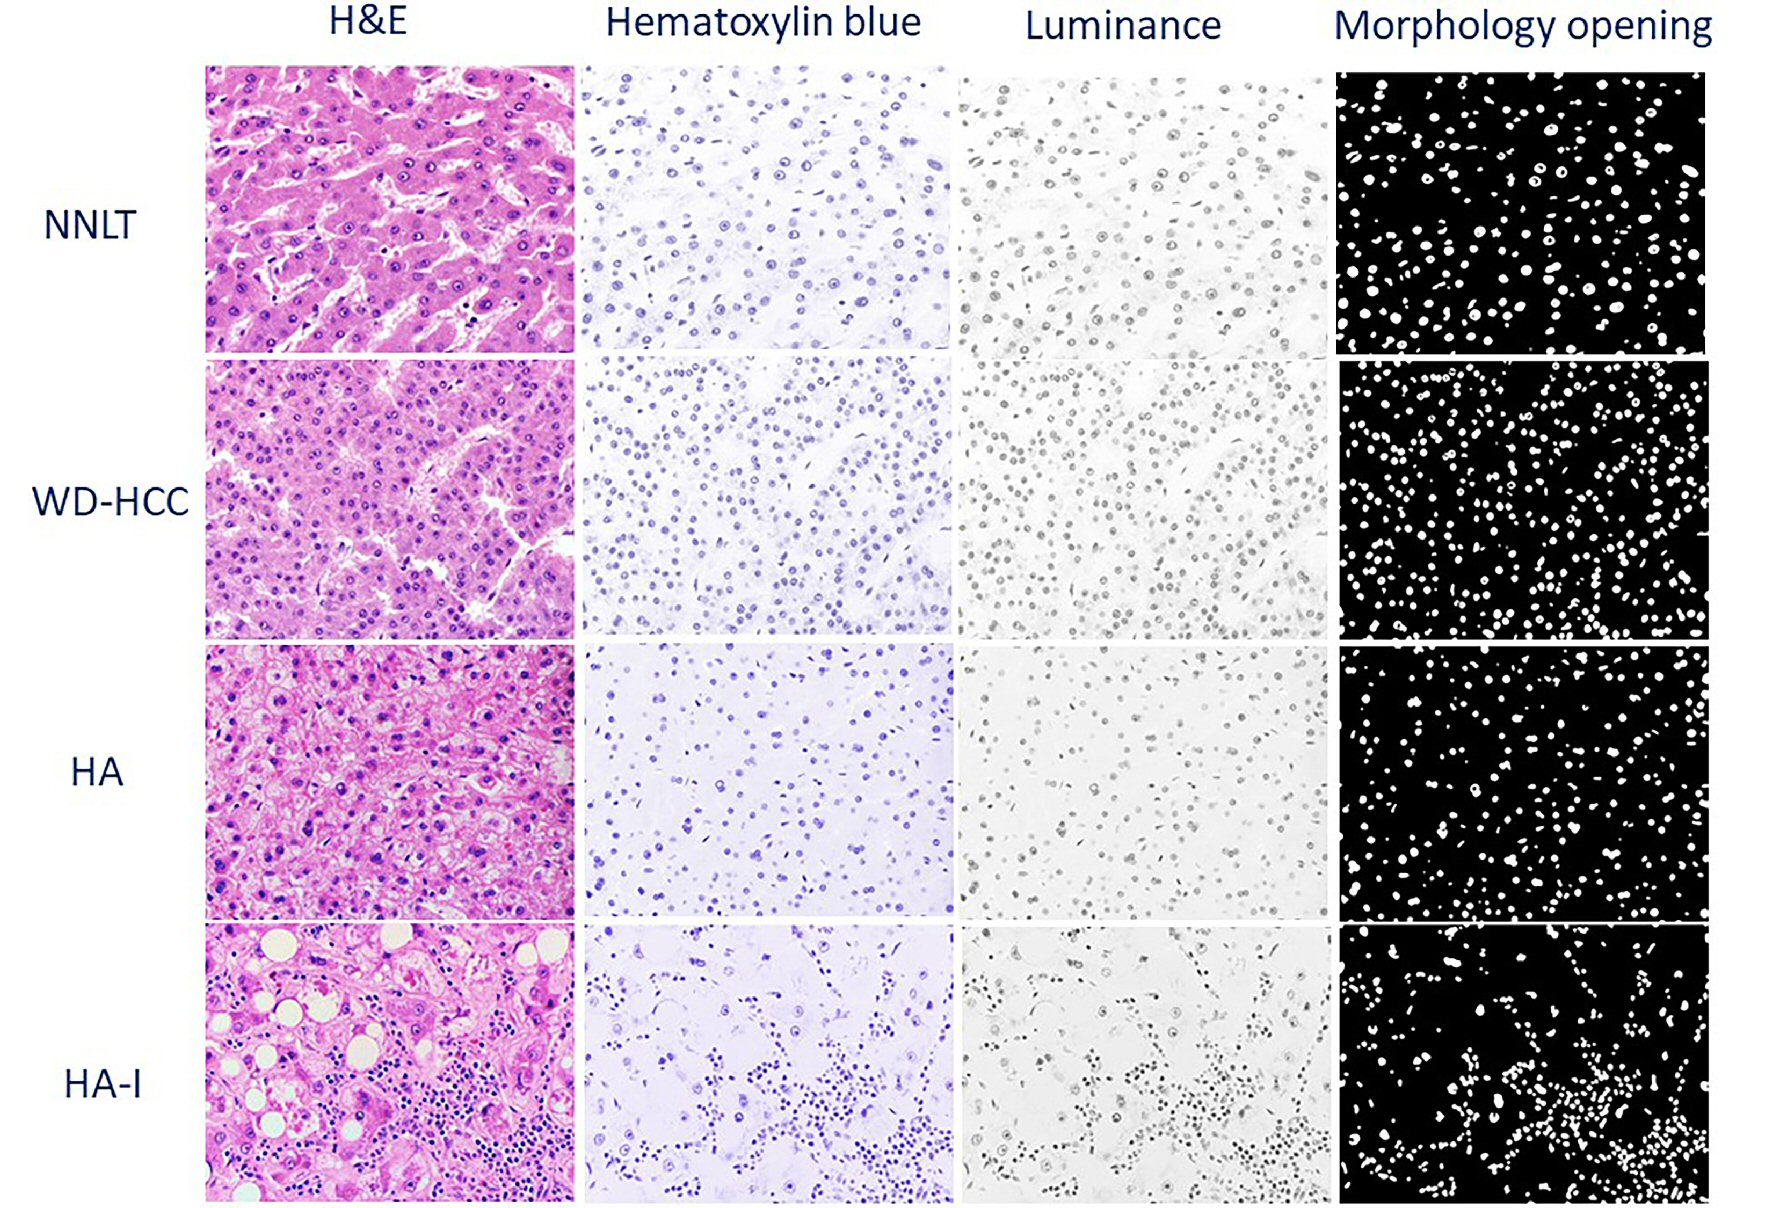 Click for large image | Figure 3. Representative photomicrographs of non-neoplastic liver tissue (NNLT), hepatocellular adenoma (HA), inflammatory type hepatocellular adenoma (HA-I), and well-differentiated hepatocellular carcinoma (WD-HCC) in sequential order: hematoxylin and eosin (H&E), and digitally transformed to hematoxylin blue, luminance, and morphological opening (× 400). |
Definitions of measured and calculated nuclear parameters
Nuclear density: the number of nuclei in 0.09 µm2 area; nuclear perimeter: the circumference of the nucleus; nuclear sphericity: the measurement of how closely the shape of a nucleus approaches a mathematically perfect sphere; nuclear eccentricity: the measurement of the deviation of the shape of a nucleus from a mathematically perfect sphere.
Statistical analysis
The statistical analysis in this study was performed in three steps. First, a one-way analysis of variance (ANOVA) with Tukey post hoc test was performed to test for the statistical significance of each quantified nuclear feature amongst the three groups (NNLT, HA, and WD-HCC). Second, unsupervised clustering of images based on the measured nuclear features was performed to determine whether the images naturally cluster into these three groups. A two-step unsupervised clustering approach was used: hierarchical followed by k-means clustering. For hierarchical clustering, Ward’s method was employed which merged pairs of clusters at each step by minimizing the total within-cluster variance and generated a dendrogram for estimation of the number of likely clusters within the studied population (Fig. 4) [19]. The estimates of hierarchical clustering were used to develop centroids for the k-means clustering. The resulting clusters were evaluated to determine their composition and correspondence to the original designation (pathological diagnosis) of the images within those groups [7]. Third, supervised cluster analysis (a predictive model) was designed, trained and validated on sets of photomicrographs and whole slide scans.
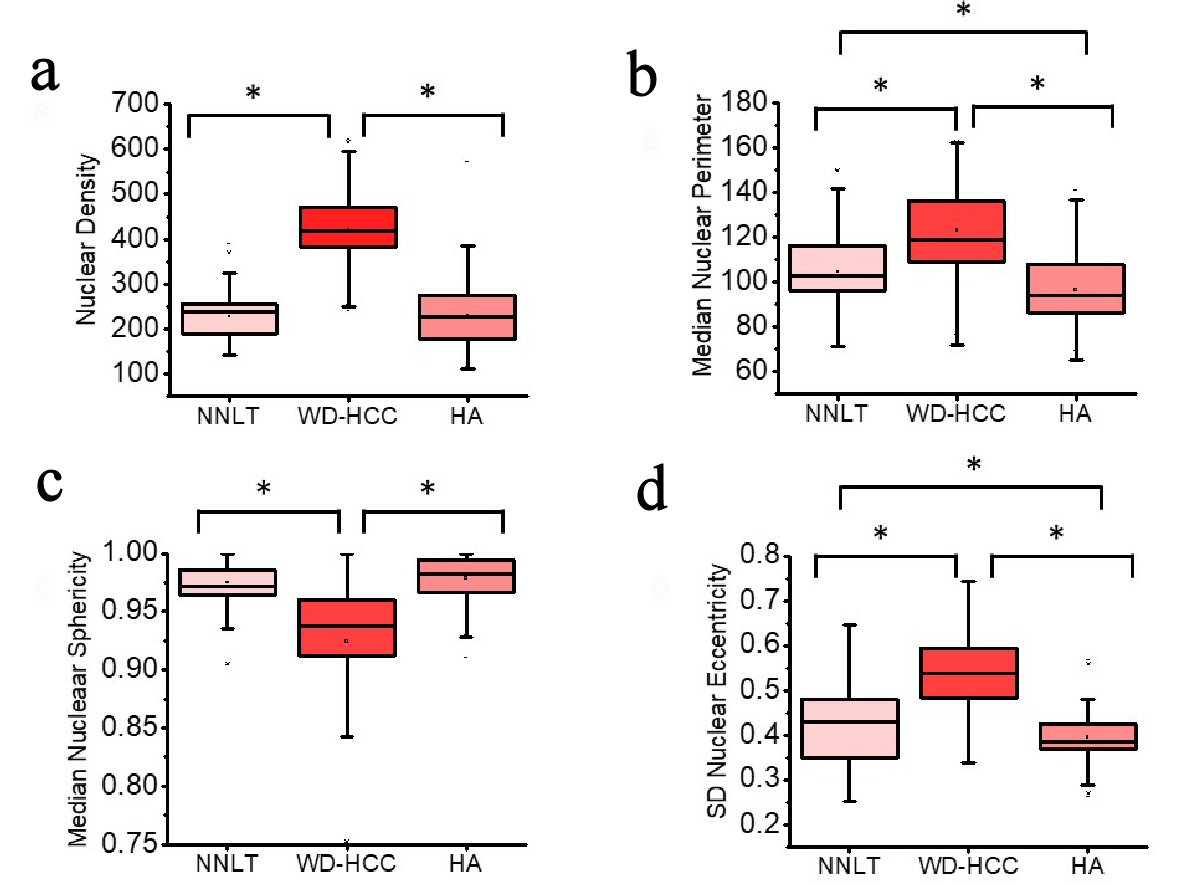 Click for large image | Figure 4. Distribution of nuclear density (a), median nuclear perimeter (b), median nuclear sphericity (c), and standard deviation (SD) nuclear eccentricity (d) of non-neoplastic liver tissue (NNLT) (n = 129), well-differentiated hepatocellular carcinoma (WD-HCC) (n = 183), and hepatocellular adenoma (HA) (n = 173) (P < 0.001; one-way analysis of variance (ANOVA)). Bars indicate 5th and 95th percentiles; boxes represent the 25th and 75th percentiles; lines inside the boxes are medians. Asterisks (*) indicate significant (P < 0.05) differences by Tukey post hoc test. |
The supervised cluster analysis used a randomly selected set comprising 383 (80%) of the total 485 images (99 NNLT, 135 HA, and 149 WD-HCC) for training, and the remaining 102 (20%) images (38 images for HA, 30 for NNLT, and 34 for WD-HCC) to validate the algorithm. Each of the 485 images was considered individually for analysis even when they were derived from different areas of the same case. Data from training images were subjected to Chi-square automatic interaction detection (CHAID) to build a decision tree model. This model combined all input variables with significant differences, namely: nuclear density, median nuclear perimeter, median nuclear sphericity, and SD nuclear eccentricity in each image (P < 0.05, one-way ANOVA). CHAID adopted the group-to-the-end strategy when choosing the optimal grouping factor. Decision tree model was used on test images and whole slide scans to validate the CHAID algorithm. The sensitivity and specificity of the model were evaluated by binary classification analysis (Fig. 1) [17, 20-23].
Statistical analyses were performed using SPSS (v.22.0).
| Results | ▴Top |
Quantification of nuclear morphometric features to differentiate HA, NNLT and WD-HCC
All photomicrographs were processed through deconvolution, noise reduction, Otsu thresholding, and morphologic opening (Fig. 1). The nuclear density, median nuclear perimeter, median nuclear sphericity and SD nuclear eccentricity of each image were quantified based on the source code of ImageJ.
A one-way ANOVA was conducted to compare nuclear density, median nuclear perimeter, median sphericity and SD nuclear eccentricity for the three diagnostic groups. Nuclear density was significantly different between the diagnostic groups: NNLT, HA and WD-HCC (mean ± SD: 227.2 ± 48.9; 230.1 ± 65.6; 421.5 ± 80.3; respectively; one-way ANOVA, F (2, 488) = 464.4, P < 0.001). Post hoc comparisons indicated the mean nuclear density in WD-HCC was significantly different from those in NNLT and HA (Tukey post hoc test, P < 0.05) (Table 1, Fig. 4a).
 Click to view | Table 1. Summary of Means of Quantified Nuclear Features |
Median nuclear perimeter was significantly different between the three diagnostic groups: NNLT, HA and WD-HCC (mean ± SD: 104.4 ± 16.9; 96.6 ± 16.0; 122.9 ± 17.7; respectively; one-way ANOVA, F (2, 488) = 114.3, P < 0.001). Post hoc comparisons indicated the median nuclear perimeter in WD-HCC was significantly different as compared to those in NNLT and HA. Median nuclear perimeter was also significantly different between NNLT and HA (Tukey post hoc test, P < 0.05) (Table 1, Fig. 4b).
Median nuclear sphericity was significantly different between the three diagnostic groups: NNLT, HA and WD-HCC (mean ± SD: 0.975 ± 0.189; 0.979 ± 0.019; 0.924 ± 0.060; respectively; one-way ANOVA, F (2, 488) = 103.1, P < 0.001). Post hoc comparisons indicated the median nuclear sphericity in WD-HCC was significantly different from those in NNLT and HA (Tukey post hoc test, P < 0.05) (Table 1, Fig. 4c).
SD nuclear eccentricity was significantly different between the three diagnostic groups: NNLT, HA and WD-HCC (mean ± SD: 0.428 ± 0.092; 0.395 ± 0.053; 0.536 ± 0.092; respectively; one-way ANOVA, F (2, 488) = 148.0, P < 0.001). Post hoc comparisons indicated the SD nuclear eccentricity in WD-HCC was significantly different from those in NNLT and HA. Also, SD nuclear eccentricity was significantly different between NNLT and HA (Tukey post hoc test, P < 0.05) (Table 1, Fig. 4d).
Other nuclear parameters investigated in this study (median eccentricity, median fill rate, median convex perimeter, median convex volume, SD perimeter, SD area, SD sphericity, SD fill ratio, SD convex perimeter, and convex volume) did not demonstrate significant differences between the three diagnostic groups (data not shown).
Unsupervised classification of the quantified nuclear features
Unsupervised hierarchical clustering analysis was applied to the four statistically significant variables (nuclear density, median nuclear perimeter, median nuclear sphericity, and SD nuclear eccentricity) using the Ward’s method. This produced a dendrogram with an estimation of three well-defined cluster groups of cases (Fig. 5a). Using the estimation of three classes in hierarchical clustering, the total data were subjected to a k-means cluster analysis (k = 3) (Fig. 5b, c). All images were classified into three clusters after nine iterations. Distance between clusters 1 and 2 (93.60) was less than the distance between clusters 2 and 3 (178.37) (Fig. 5b). Cluster 1 entirely consisted of benign livers (51 NNLT and 79 HA). Cluster 2 consisted of mixture of all three groups with majority of benign livers (78 NNLT, 91 HA, 32 WD-HCC). Cluster 3 consisted of mainly WD-HCC (three HA and 151 WD-HCC) (Fig. 5c).
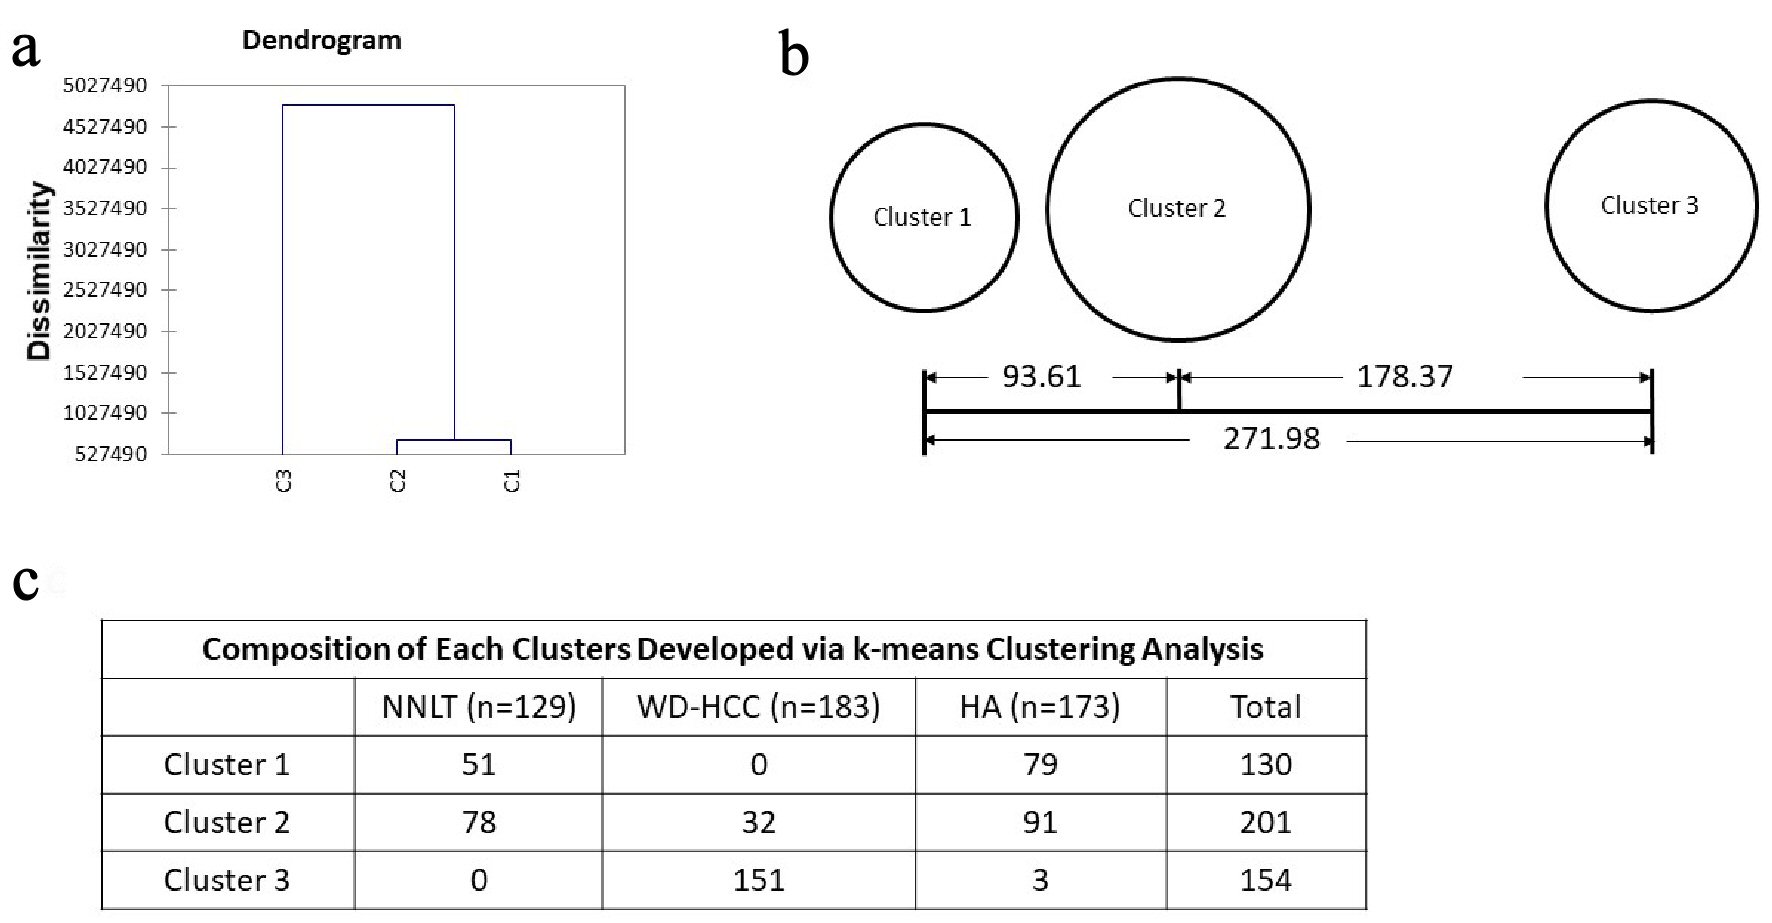 Click for large image | Figure 5. Unsupervised clustering. (a) Dendrogram developed with hierarchical clustering analysis. Dissimilarity is decided with euclidean distance. (b) Distances between the final cluster centers developed with k-means clustering analysis. (c) Composition of each cluster developed via k-means clustering analysis. |
Supervised classification of the quantified nuclear features
Using the variables of nuclear density, median perimeter, median sphericity and SD eccentricity of each image, the CHAID algorithm generated six ramifications from root node, through decision nodes, and terminated with 15 terminal nodes. The first step in the decision tree generation utilized nuclear density followed by the remaining three variables, to predict a diagnosis of NNLT, HA and WD-HCC.
Nuclear density (D)
1) D ≥ 377
Images with nuclear density ≥ 377 were classified as WD-HCC (node 6; purity 99.1%), and this proved to be the most powerful predictor for the differentiation of WD-HCC from HA and NNLT (Fig. 6).
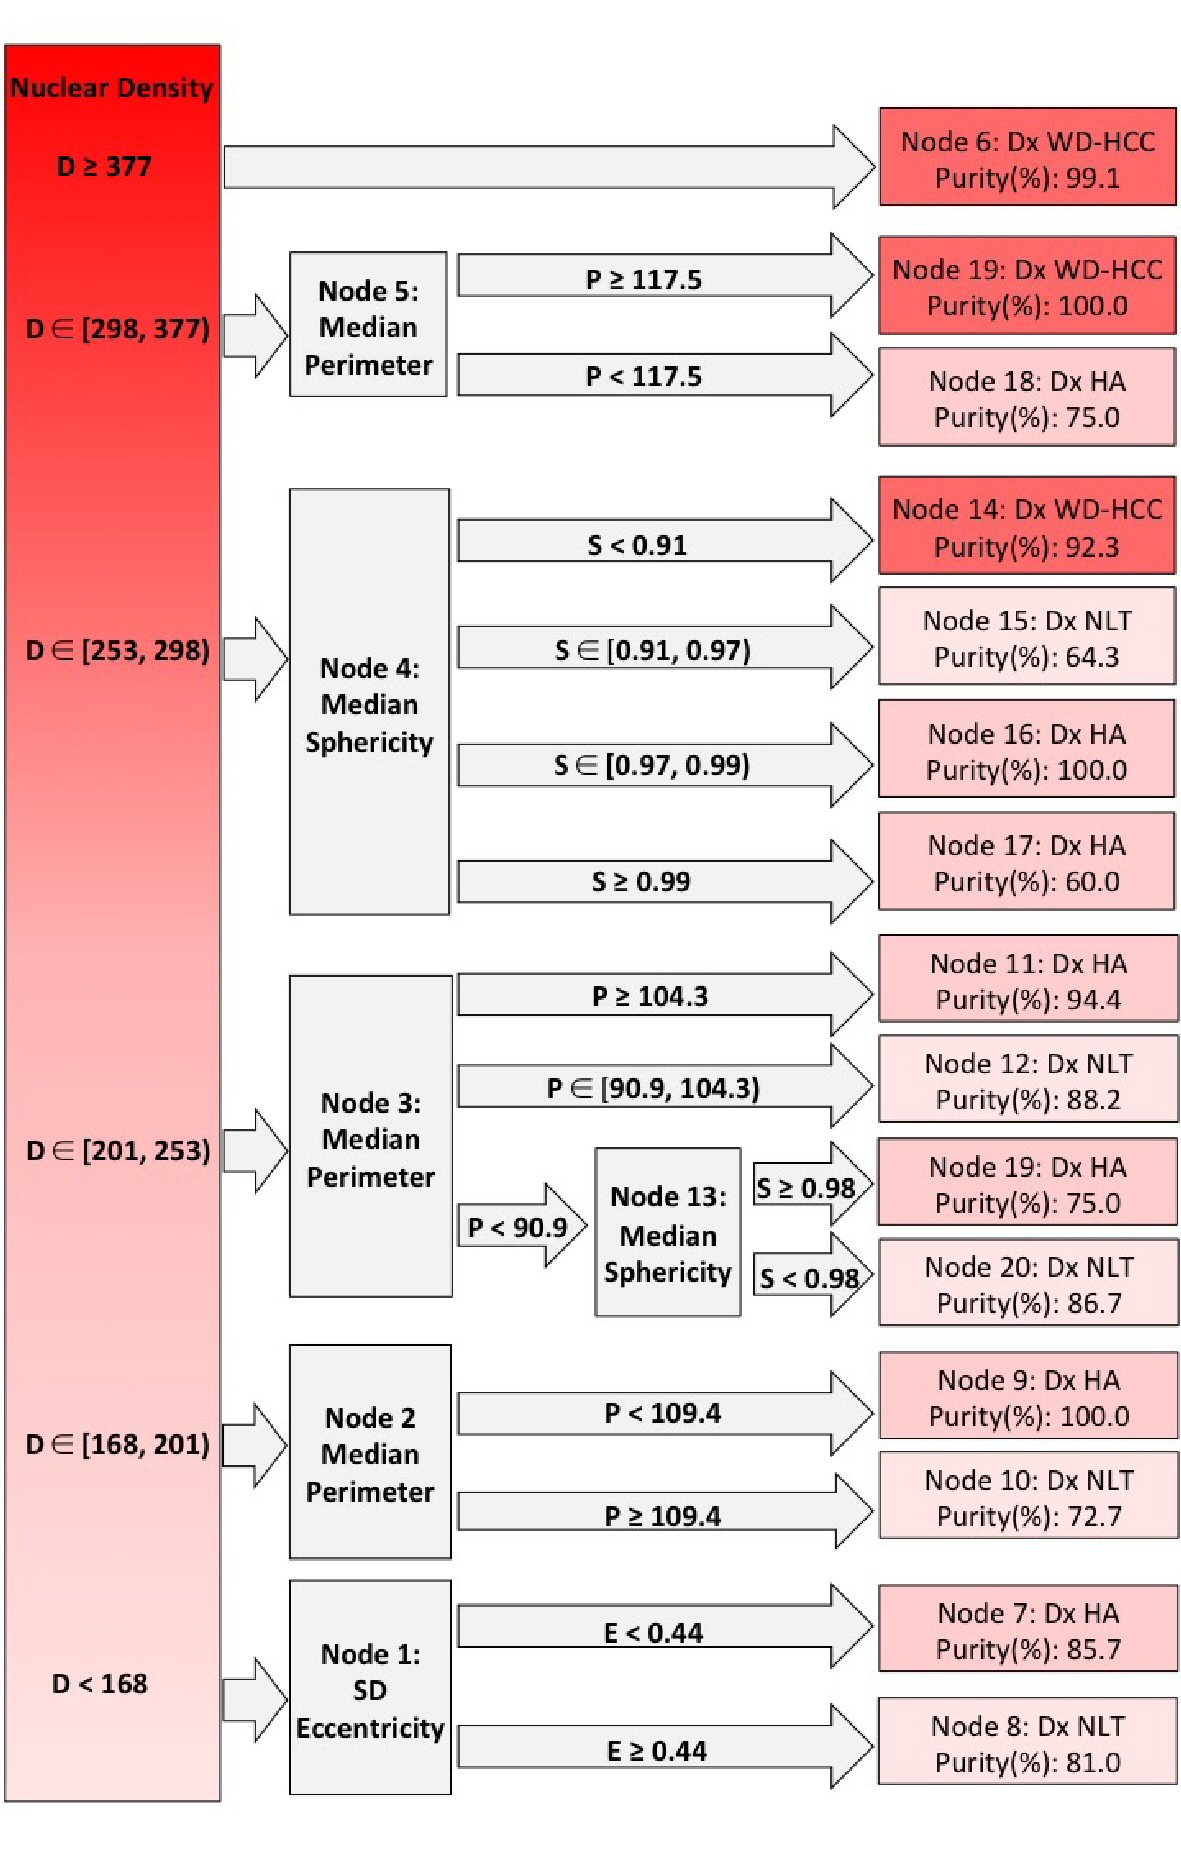 Click for large image | Figure 6. Decision tree from Chi-square automatic interaction detection (CHAID) analysis. Columns left to right: root nodes; decision nodes; terminal nodes. Shades of red from dark to light indicate well-differentiated hepatocellular carcinoma (WD-HCC), hepatocellular adenoma (HA), and non-neoplastic liver tissue (NNLT), respectively. Purity of each diagnosis is given in terminal nodes. D: nuclear density; E: standard deviation (SD) nuclear eccentricity; P: median nuclear perimeter; S: median nuclear sphericity. ∊: a set (number 1, number 2); ): number included in analysis; [: number excluded from analysis. |
2) D ∊ [298 - 377)
Nuclear density between 377 and 298 indicated WD-HCC or HA (node 5), and this population was subclassified on the basis of median perimeter with the diagnosis of WD-HCC if the median perimeter was ≥ 117.5 (node 19; purity 100%), and HA if the median perimeter was < 117.5 (node 18; purity 75%) (Fig. 6).
3) D ∊ [253 - 298)
When nuclear density was between 253 and 298 (node 4), digital images were subclassified on the basis of median sphericity into HA, NNLT or WD-HCC. If the median sphericity was ≥ 0.97, the images were categorized as HA (node 16; purity 100%; node 17; purity 60%). If the median sphericity was between 0.91 and 0.97, the images were categorized as NNLT (node 15; purity 64.3%), and if the median sphericity was < 0.91, the images were categorized as WD-HCC (node 14; purity 92.3%) (Fig. 6).
4) D ∊ [201 - 253)
When nuclear density was < 253, the images were considered as non-malignant lesion (HA or NNLT). The images with nuclear density between 201 and 253 were evaluated with median nuclear perimeter (node 3). If the median nuclear perimeter was ≥ 104.3, the images were grouped as HA (node 11; purity 94.4%). If the median nuclear perimeter was between 90.9 and 104.3, the images were grouped as NNLT (node 12; purity 88.2%). If the median nuclear perimeter was < 90.9, then the median sphericity was evaluated, images with median sphericity of < 0.98 were classified as NNLT (node 21; purity 86.7%), and images with median sphericity ≥ 0.98 were classified as HA (node 20; purity 86.7%) (Fig. 6).
5) D ∊ [168 - 201)
Images with nuclear density between 168 and 201 were evaluated with median nuclear perimeter (node 2). These images were grouped as HA if the median nuclear perimeter was < 109.4 (node 9; purity 100%), and grouped as NNLT if the median nuclear perimeter was ≥ 109.4 (node 10; purity 72.7%) (Fig. 6).
6) D < 168
When the nuclear density was < 168 (node 1), SD nuclear eccentricity was evaluated. Images with SD nuclear eccentricity < 0.44 were classified as NNLT (node 7; purity 85.7%), and images with SD nuclear eccentricity ≥ 0.44 were classified as HA (node 8; purity 81.0%) (Fig. 6).
Validation of the decision tree algorithm
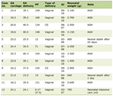
The decision tree algorithm, developed by CHAID, was validated through binary classification analysis on a set of 102 test images (30 NNLT, 38 HA, 34 WD-HCC). The algorithm detected WD-HCC with 100% sensitivity and 98.53% specificity, HA with 71.05% sensitivity and 85.94% specificity, and NNLT with 70.00% sensitivity and 86.11% specificity (Table 2).
Click to view | Table 2. List of Sensitivities and Specificities of the CHAID Analysis for Detection of WD-HCC, HA, and NNLT on the Training, Test Data, and Whole Slide Images |
Whole slide scans (three NNLT, three HA, three WD-HCC) were also used to validate the decision tree algorithm. The three WD-HCC were all detected with 100% sensitivity and 100% specificity. While the three NNLT were interpreted correctly, the three HA were misinterpreted by the decision tree algorithm as NNLT (Table 2).
| Discussion | ▴Top |
Differentiation of hepatocellular carcinoma, adenoma, and normal liver parenchyma based on histopathologic features alone is sometimes challenging, especially in core needle biopsies. Additional workup, involving use of special and immunochemical stains is often required, resulting in increased costs and delays [24, 25]. Computational methods present alternative means for improved diagnostic accuracy without increasing cost or turnaround time. For this study we designed and validated a computerized algorithm using nuclear morphometric features to differentiate NNLT, HA and WD-HCC.
Of the many nuclear features that we evaluated, four reliably features to differentiate NNLT, HA and WD-HCC are nuclear density, median nuclear sphericity, median nuclear perimeter, and SD nuclear eccentricity. Unsupervised hierarchical clustering followed by k-means cluster analysis of these four quantified nuclear features identified three well-defined cluster groups. Cluster 1 consisted entirely of benign conditions (51 NNLT, 79 HA), cluster 3 consisted mainly of WD-HCC (three HA, 151 WD-HCC), and cluster 2 consisted of a mixture of all three diagnostic categories (78 NNLT, 91 HA, 32 WD-HCC) (Fig. 4). The mixture of diagnostic categories in cluster 2 affirms our initial contention that some diagnoses are challenging by histopathology and morphometry, requiring supervised cluster analysis.
Supervised cluster analysis used nuclear density, median nuclear sphericity, median nuclear perimeter, and SD nuclear eccentricity to create a decision tree algorithm that correctly identified WD-HCC with a sensitivity of 100% and a specificity of 98.53%. Analysis of these nuclear features in whole slide scans yielded similar results distinguishing WD-HCC from HA and NNLT with 100% sensitivity and specificity.
The algorithm-based differentiation between HA and NNLT was less optimal. This may be explained in part by the methodological exclusion of portal triads during image acquisition, because of major distinguishing features of HA being absence of portal triads and presence of unpaired blood vessels. Thus, exclusion of architectural features in computational analysis renders nuclear features inadequate to distinguish HA and NNLT.
Three of 173 HA images were misclassified as WD-HCC by our computerized algorithm. All three were HA of the inflammatory subtype, which characteristically shows telangiectasia (sinusoidal dilatation), intensive inflammatory infiltration, and occasionally steatosis. The discrepancy may be due to infiltrated inflammatory cells in the liver parenchyma interfering with measurement of the nuclear density of the hepatocytes. Such outcomes necessitate review of computational analysis by experienced diagnosticians to exclude discrepancies caused by artifacts or unusual morphological features.
Whole slide scans were tested by the binary classification analysis for validation of the decision tree algorithm which identified WD-HCC with 100% sensitivity and specificity. However, on whole slide scans the model classified both NNLT and HA as NNLT. Broadly, the model differentiated benign from malignant but not benign (HA) from normal (NNLT). We speculate that as only nuclear morphometric features were used in the algorithm that excluded architectural features (portal triads), the algorithm failed to differentiate benign from normal. Additionally, absence of a well demarcated histological boundary between NNLT and HA may render morphometric analysis models impractical for their differentiation. Thus, the nuclear morphometric model is best utilized in differentiating benign from malignant hepatic neoplasms.
Recent studies involving use of image analysis have aimed to either automate the diagnostic process or aid the pathologist in diagnosis of disease. Most of these studies are aimed at applying artificial intelligence and neural networks to image analysis [26]. The caveat with a neural network-based approach, however, is the so called “black box” phenomenon; it is difficult to determine the decision-making process in neural networks and there are concerns about reproducibility. In this study we preferred a “white box” approach to clearly delineate the inner working and decision-making process of our algorithm. Thus, we followed a CHAID-based analysis of the extracted nuclear features rather than a convolutional neural network classification at image level (without feature extraction). CHAID algorithm has recently been recognized as a useful tool to stratify variables in clinical research. For example, CHAID analysis of radiologic lesion descriptors from magnetic resonance imaging was able to differentiate between intrahepatic cholangiocarcinoma and HCC in cirrhotic livers [23]. Also, using demographic and clinical features it was useful in predicting prognostic features of squamous cell carcinomas of the head and neck [21]. We believe that the CHAID-based computational analysis will continue to find useful applications in pathology especially because its “white box” approach allows for reproducibility of our algorithm by other investigators.
Differentiation of hepatic neoplasms is challenging both for the human eye and a computerized algorithm. As observed in the decision tree algorithm, for some cases, the definitive diagnosis could only be made after evaluating multiple morphometric features. Similarly, diagnosticians consider a variety of cellular and architectural characteristics before reaching a diagnosis. Therefore, an ideal algorithm should incorporate nuclear, cellular, and architectural features especially in cases with confounding features. Such technologies are best used for screening purposes with review and confirmation by expert diagnosticians, and are expected to bring accuracy and objectivity.
This study has shown promise in the use of computational and statistical analysis for diagnosis of the hepatic neoplasms. However, it has limitations that include a smaller sample size for adenoma subtypes and few whole slide scans. Further studies with a larger representation of hepatic neoplasms and use of greater number of photomicrographs and whole slide scans are expected to provide a more accurate analysis. We used non-neoplastic liver from autopsied and surgical specimens; these morphologically normal appearing liver samples, although representative, are not substitute for normal liver.
Our approach offers additional advantages over traditional diagnostic workup involving histopathological examination supplemented with immunohistochemistry and special staining. This computational image analysis provides reliable diagnosis on a limited tissue sample, which is often the case with needle biopsies, as it requires only a single high-power quality image. The images can be analyzed remotely, saving cost of ancillary testing and reducing turnaround time.
Statement of significance
Hepatocellular carcinoma (HCC) is the sixth most common type of cancer with a high mortality rate. Its early detection and diagnosis is important for an appropriate treatment plan and improved prognosis. Distinguishing malignant from benign liver neoplasms by histopathological examination is often challenging. Quantitative assessment of histological features by computational image analysis has been found to enhance objectivity and accuracy of the diagnosis. We used computational image processing and statistics to analyze nuclear features of neoplastic cells and developed a decision tree algorithm which differentiated malignant and benign liver neoplasms with high sensitivity and specificity. We found this approach to be useful in histopathological diagnosis of HCC, especially in diagnostically challenging cases. Our algorithm provides reliable diagnosis on a limited tissue sample, as in biopsies, and requires only a single image. It also can support remote analysis reducing turnaround time for consultation from outreach areas.
Conclusions
Application of the decision tree algorithm developed by CHAID successfully classified the images of WD-HCC, HA and NNLT based on four quantified nuclear features (nuclear density, median nuclear sphericity, median nuclear perimeter and SD nuclear eccentricity). This pilot study demonstrates that this algorithm can reliably assist in differentiating WD-HCC from both HA and NNLT. To the best of our knowledge, this is the first report that CHAID has been used to analyze morphologic features for histopathological interpretations, and larger studies are expected to bring it a step closer to clinical practice.
Acknowledgments
None to declare.
Financial Disclosure
No specific funding was used for this study.
Conflict of Interest
The authors declare no potential conflict of interest.
Informed Consent
Informed patient consent was not required as per the Institutional Review Board which approved this study (IRB: 1059689-1).
Author Contributions
RG and RX conceived and designed the study. RX, SS, and MIF selected cases and retrieved materials. RX, SS, EY, YP and MIF acquired images. RX, AM-B, YP, RA, MIF, MAH and RG analyzed data. RX, MAH, and RG wrote the paper. All authors read and approved the final manuscript.
Abbreviations
CHAID: Chi-square automatic interaction detection; HA: hepatocellular adenoma; NNLT: non-neoplastic liver tissue; SD: standard deviation; WD-HCC: well-differentiated hepatocellular carcinoma
| References | ▴Top |
- Shafizadeh N, Kakar S. Diagnosis of well-differentiated hepatocellular lesions: role of immunohistochemistry and other ancillary techniques. Adv Anat Pathol. 2011;18(6):438-445.
doi pubmed - Feng LH, Wang H, Dong H, Zhu YY, Cong WM. The stromal morphological changes for differential diagnosis of uninodular high-grade dysplastic nodule and well-differentiated small hepatocellular carcinoma. Oncotarget. 2017;8(50):87329-87339.
doi pubmed - Ferrell LD. Odze and Goldblum's surgical pathology of the GI tract, liver, biliary tract, and pancreas. In: Odze RD, Goldblum JR, ed. Benign and malignant tumors of the liver. Elsevier Health Sciences. 2014; p. 1541-1543.
- Poddar N, Ramlal R, Ravulapati S, Devlin SM, Gadani S, Vidal CI, Cao D, et al. Extrahepatic metastasis of hepatocellular carcinoma arising from a hepatic adenoma without concurrent intrahepatic recurrence. Curr Oncol. 2017;24(4):e333-e336.
doi pubmed - Tao LC. Oral contraceptive-associated liver cell adenoma and hepatocellular carcinoma. Cytomorphology and mechanism of malignant transformation. Cancer. 1991;68(2):341-347.
doi - Choi WT, Kakar S. Atypical hepatocellular neoplasms: review of clinical, morphologic, immunohistochemical, molecular, and cytogenetic features. Adv Anat Pathol. 2018;25(4):254-262.
doi pubmed - Momeni-Boroujeni A, Yousefi E, Somma J. Computer-assisted cytologic diagnosis in pancreatic FNA: An application of neural networks to image analysis. Cancer Cytopathol. 2017;125(12):926-933.
doi pubmed - Wang W, Ozolek JA, Rohde GK. Detection and classification of thyroid follicular lesions based on nuclear structure from histopathology images. Cytometry A. 2010;77(5):485-494.
doi pubmed - Paulik R, Micsik T, Kiszler G, Kaszal P, Szekely J, Paulik N, Varhalmi E, et al. An optimized image analysis algorithm for detecting nuclear signals in digital whole slides for histopathology. Cytometry A. 2017;91(6):595-608.
doi pubmed - Yamashita Y, Kiyuna T, Sakamoto M, Hashiguchi A, Ishikawa M, Murakami Y, Yamaguchi M. Development of a prototype for hepatocellular carcinoma classification based on morphological features automatically measured in whole slide images. Analytical Cellular Pathology. 2014;2014:817192.
doi - Gheonea DI, Streba CT, Vere CC, Serbanescu M, Pirici D, Comanescu M, Streba LA, et al. Diagnosis system for hepatocellular carcinoma based on fractal dimension of morphometric elements integrated in an artificial neural network. Biomed Res Int. 2014;2014:239706.
doi pubmed - Ishikawa M, Ahi ST, Murakami Y, Kimura F, Yamaguchi M, Abe T, Hashiguchi A, et al. Automatic segmentation of hepatocellular structure from HE-stained liver tissue. In: Medical Imaging 2013: Digital Pathology. Vol. 8676. International Society for Optics and Photonics; 2013:326-332.
doi - Yang LY, Fang F, Ou DP, Wu W, Zeng ZJ, Wu F. Solitary large hepatocellular carcinoma: a specific subtype of hepatocellular carcinoma with good outcome after hepatic resection. Ann Surg. 2009;249(1):118-123.
doi pubmed - Ault GT, Wren SM, Ralls PW, Reynolds TB, Stain SC. Selective management of hepatic adenomas. Am Surg. 1996;62(10):825-829.
- Dokmak S, Paradis V, Vilgrain V, Sauvanet A, Farges O, Valla D, Bedossa P, et al. A single-center surgical experience of 122 patients with single and multiple hepatocellular adenomas. Gastroenterology. 2009;137(5):1698-1705.
doi pubmed - Bankhead P, Loughrey MB, Fernandez JA, Dombrowski Y, McArt DG, Dunne PD, McQuaid S, et al. QuPath: Open source software for digital pathology image analysis. Sci Rep. 2017;7(1):16878.
doi pubmed - Xu H, Lu C, Berendt R, Jha N, Mandal M. Automated analysis and classification of melanocytic tumor on skin whole slide images. Comput Med Imaging Graph. 2018;66:124-134.
doi pubmed - de Chaumont F, Dallongeville S, Chenouard N, Herve N, Pop S, Provoost T, Meas-Yedid V, et al. Icy: an open bioimage informatics platform for extended reproducible research. Nat Methods. 2012;9(7):690-696.
doi pubmed - Lawrence KE, Forsyth SF, Vaatstra BL, McFadden A, Pulford DJ, Govindaraju K, Pomroy WE. Cluster analysis of the clinical histories of cattle affected with bovine anaemia associated with Theileria orientalis Ikeda type infection. N Z Vet J. 2017;65(6):305-312.
doi pubmed - Kobayashi D, Takahashi O, Arioka H, Koga S, Fukui T. A prediction rule for the development of delirium among patients in medical wards: Chi-Square Automatic Interaction Detector (CHAID) decision tree analysis model. Am J Geriatr Psychiatry. 2013;21(10):957-962.
doi pubmed - Aviles-Jurado FX, Leon X. Prognostic factors in head and neck squamous cell carcinoma: comparison of CHAID decision trees technology and Cox analysis. Head Neck. 2013;35(6):877-883.
doi pubmed - MacRitchie HM, Longbottom C, Robertson M, Nugent Z, Chan K, Radford JR, Pitts NB. Development of the Dundee Caries Risk Assessment Model (DCRAM) - risk model development using a novel application of CHAID analysis. Community Dent Oral Epidemiol. 2012;40(1):37-45.
doi pubmed - Wengert GJ, Baltzer PAT, Bickel H, Thurner P, Breitenseher J, Lazar M, Pones M, et al. Differentiation of intrahepatic cholangiocellular carcinoma from hepatocellular carcinoma in the cirrhotic liver using contrast-enhanced MR imaging. Acad Radiol. 2017;24(12):1491-1500.
doi pubmed - Yang GC, Yang GY, Tao LC. Distinguishing well-differentiated hepatocellular carcinoma from benign liver by the physical features of fine-needle aspirates. Mod Pathol. 2004;17(7):798-802.
doi pubmed - Bialecki ES, Di Bisceglie AM. Diagnosis of hepatocellular carcinoma. HPB (Oxford). 2005;7(1):26-34.
doi pubmed - Veremis B, Hanna M, Ramer N, Singh R. Digital pathology: a review. Oral Surgery, Oral Medicine, Oral Pathology and Oral Radiology. 2017;124:e210.
doi
This article is distributed under the terms of the Creative Commons Attribution Non-Commercial 4.0 International License, which permits unrestricted non-commercial use, distribution, and reproduction in any medium, provided the original work is properly cited.
Gastroenterology Research is published by Elmer Press Inc.