

| Gastroenterology Research, ISSN 1918-2805 print, 1918-2813 online, Open Access |
| Article copyright, the authors; Journal compilation copyright, Gastroenterol Res and Elmer Press Inc |
| Journal website https://www.gastrores.org |
Original Article
Volume 15, Number 2, April 2022, pages 75-81

Seasonal Variations of Hospital Admissions for Alcohol-Related Hepatitis in the United States
Aalam Sohala, Kanwal Bainsb, Armaan Dhaliwalc, Hunza Chaudhrya, h, Raghav Sharmad, Piyush Singlae, Gagan Guptae, Dino Dukovicf, Sunny Sandhua, Marina Roytmang, Steven Tringalia
aDepartment of Internal Medicine, University of California, Fresno, CA, USA
bDepartment of Clinical Nutrition, Brigham and Women’s Hospital, Boston, MA, USA
cDepartment of Internal Medicine, University of Arizona, South Campus, Tucson, AZ, USA
dPunjab Institute of Medical Sciences, Punjab, India
eDayanand Medical College and Hospital, Punjab, India
fRoss University School of Medicine, Bridgetown, Barbados
gDepartment of Gastroenterology and Hepatology, University of California, Fresno, CA, USA
hCorresponding Author: Hunza Chaudhry, Department of Internal Medicine, UCSF Fresno, Fresno, CA 93722, USA
Manuscript submitted February 11, 2022, accepted April 16, 2022, published online April 23, 2022
Short title: Seasonal Hospital Admissions for AH
doi: https://doi.org/10.14740/gr1506
| Abstract | ▴Top |
Background: Clinical experience suggests an increased hospitalization rate for alcohol-related hepatitis (AH) in the winter months; however, seasonal variations in the prevalence of hospitalizations for AH have not been described previously. We hypothesized that AH hospitalizations would be higher in the winter months due to the holiday season and increased alcohol sales.
Methods: Patients with primary or secondary discharge diagnosis of AH were included in the study (International Classification of Diseases, Clinical Modification-10th Revision codes K70.4 and K70.1) between January 2016 and December 2019. The primary outcome measure for this study was daily hospitalizations by each month of the year. Secondary outcome measures included the rate of in-hospital mortality associated with AH, for each month.
Results: The highest number of AH-related admissions was reported in July (n = 56,800; 9%), followed by August (n = 55,700; 8.8%) and May (n = 54,865; 8.7%). February had the lowest number of admissions (n = 46,550; 7.37%). The adjusted mortality was highest in December (overall mortality: 9.6%; adjusted odds ratio: 1.29; 95% confidence interval: 1.142 - 1.461; P < 0.0001) and lowest in May (overall mortality rate: 7.7%). No difference was noted between length of stay and total hospitalization cost between months.
Conclusion: Our findings demonstrate that seasonal variations in hospitalizations related to AH do exist across the United States. Regional differences also exist and follow unique patterns. The increase in admissions for AH is in line with other studies suggesting that heavy drinking happens during the warm season. Hospital administrators and other stewards of healthcare resources can use seasonal patterns to guide allocation of resources.
Keywords: Alcohol-related hepatitis; Seasonal; Trends; NIS; Alcohol; Cirrhosis
| Introduction | ▴Top |
Alcohol consumption has been engraved into American culture and slices across racial, socio-economic, and geographical lines. Based on the DSM-5 criteria, 12-month and lifetime prevalences of alcohol use disorder were 13.9% and 29.1%, respectively [1]. Excessive alcohol intake is the third leading preventable cause of mortality in the United States with alcohol-related liver disease being the most common etiology of alcohol-related deaths [2]. Persistent and excessive intake of alcohol leads to cirrhosis in majority of cases but acute development of inflammatory changes in the liver can lead to the development of alcohol-related hepatitis (AH) which has grave consequences. AH is a syndrome characterized by jaundice and liver failure occurring after years of heavy alcohol consumption. A study conducted in Denmark concluded a 28-day mortality rate of 14-24% in patients with AH, reinforcing the grim prognosis the disease holds [3]. The severity of symptoms leads most patients to inpatient hospital care adding to the burden of the US healthcare expenditure. In a survey conducted in 2017, the USA encountered 56,000 cases of AH hospitalizations with an average cost of $37,769 per hospitalization [4].
Clinical experience suggests an increased hospitalization rate for AH in the winter months; however, seasonal variations in the prevalence of hospitalizations for AH have not been described previously. There are data suggesting that heavy alcohol use happens in summer while the winter months in the USA are marked by a period of holidays including but not limited to Thanksgiving, Christmas, and New Year’s. Alcohol consumption has been shown to increase during the holidays and special occasions also [5]. Additionally, data from national alcohol sales reveal significantly increased consumption of alcoholic beverages in the winter months [6, 7]. We hypothesized that this behavior would lead to an increase in AH hospitalizations in the winter months.
| Materials and Methods | ▴Top |
Data source
Nationwide Inpatient Sample (NIS) database is the largest openly accessible all-payer inpatient healthcare database in the United States [8]. The NIS database was created by the Healthcare Cost and Utilization Project (HCUP) and is used to frame health policies at the federal, state, and county levels. The HCUP is a program developed by the Agency for Healthcare Research and Quality. It comprises de-identified hospitalization records for more than 7 million unweighted annual hospital stays and 35 million weighted annual hospitalizations in the USA. The NIS records 7 - 8 million hospitalizations annually in an unweighted fashion. However, by applying weights we can extrapolate the data to provide information on all hospitalizations in United States. We included data for hospitalizations from 2016 to 2019. IRB approval was not required as the data are de-identified. This study was conducted in compliance with the ethical standards of the responsible institution on human subjects as well as with the Helsinki Declaration.
Study population
Patients from the dataset were selected based on International Classification of Diseases, Clinical Modification-10th Revision (ICD-10-CM) codes. Cases hospitalized with primary or secondary discharge diagnosis of AH were included in the study (ICD-10-CM codes K70.4 and K70.1). Patients with missing data on admission month or mortality were excluded.
Study outcomes and variables
The primary outcome measure for this study was the frequency of daily hospitalizations by each month of the year. Comparisons of the primary outcome were made between each month of the year. Average daily admissions were compared to account for months having different number of days. For example, January has 31 days, so total cases were divided by 124 days to adjust for differences in the days between each month. Secondary outcome measures included the rate of in-hospital mortality associated with AH. These variables served as surrogate markers for the severity of AH. Average daily mortality rates were used to account for differing lengths of months as above.
We performed pre-specified subgroup analyses for admission and in-hospital mortality rates for each geographic region in the USA. HCUP divides the regions into northeast, mid-west, south and west. The list of states included in each region is submitted in the Supplementary Material 1 (www.gastrores.org). Mortality rates were also compared after adjusting for potential confounders and covariates in a multivariate regression analysis, including age, sex, race, comorbidities (by Charlson Comorbidity Index) [9], length of stay, admission status, and hospital characteristics (location and teaching status).
Statistical analysis
Demographics are presented in tabular format. The incidence rate ratio was calculated for the months using Poisson regression analysis while adjusting for patient demographics, hospital characteristics, and Charlson Comorbidity Index. Multivariable regression analysis was done to calculate the mortality for each month while adjusting for patient demographics, hospital characteristics, and Charlson comorbidities. All statistical analyses were performed using STATA, version 17.0 (Stata Corp., College Station, TX, USA).
| Results | ▴Top |
Demographics
Between 2016 and 2019, a total of 631,070 hospitalizations for AH were included in the study sample. The mean age of the study population was 49.5 years, with the age group of 45 - 65 years constituting 56.3% of all hospitalizations. Men comprised 67% of cases, with the most common race being White (70.1%), followed by Hispanic (13.2%), and Black (10%) (Table 1).
 Click to view | Table 1. Characteristic of Patients Admitted With Alcohol-Related Hepatitis |
Hospitalization volume
The highest number of AH-related admissions was reported in July (n = 56,800; 9%), followed by August (n = 55,700; 8.8%) and May (n = 54,865; 8.7%). February had the lowest number of admissions (n = 46,550; 7.37%). Table 2 summarizes the total number of hospitalizations for each month.
Click to view | Table 2. Incidence Risk Ratio of Alcohol-Related Hepatitis for Each Month |
We further compared the months based on average daily hospitalizations. January had the fewest number of hospitalizations of AH per day (410.4 admissions per day) in contrast to July which had the highest daily admission rate (458.1 admissions per day) (Table 2 and Fig. 1).
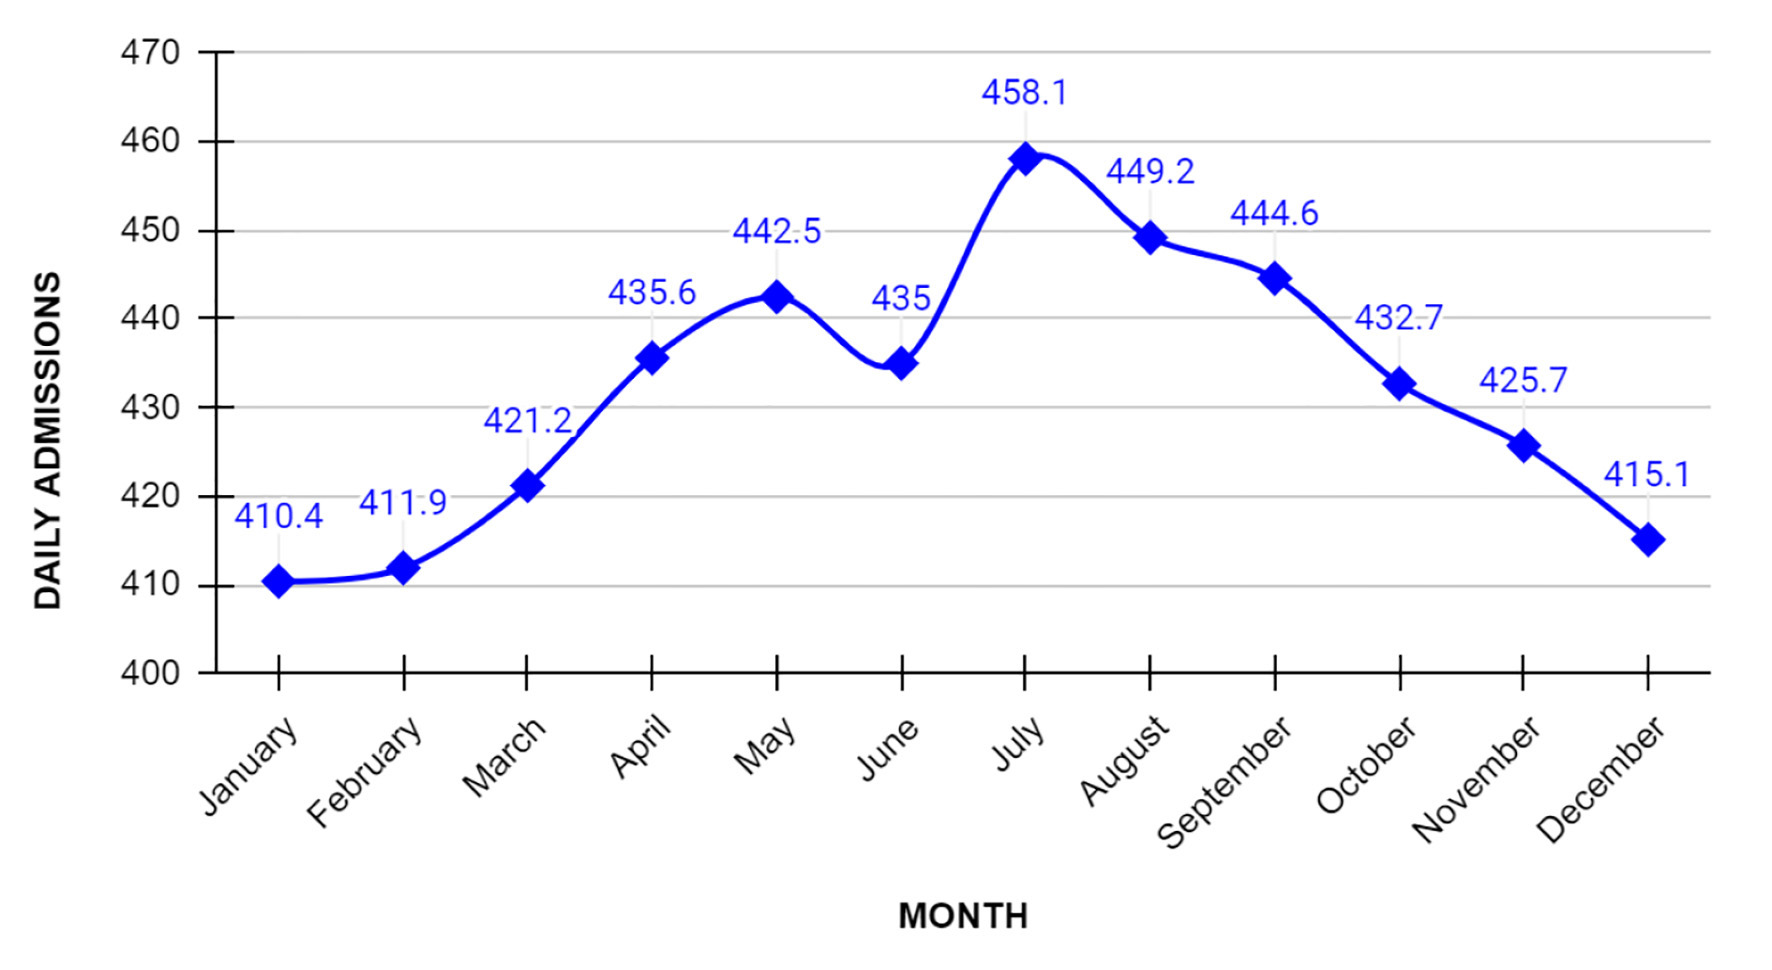 Click for large image | Figure 1. Daily admission for alcohol-related hepatitis based on each month. July was noted to have the highest number of daily admissions for alcohol-related hepatitis in the country. |
Mortality
The highest and lowest in-hospital mortality rates occurred in December (27.4 per day) and May (22.4 per day), respectively (Table 2 and Fig. 2). In-hospital mortality was further compared for each month by adjusting for various confounding factors in the regression analysis with May as the reference month. The regression analysis adjusted for age, sex, race, comorbidities (Charlson Comorbidity Index), length of stay, elective/non-elective admission status, hospital location and hospital teaching status. The adjusted mortality was highest in December (overall mortality: 9.6%, adjusted odds ratio: 1.29; 95% confidence interval: 1.142 - 1.461; P < 0.0001) and lowest in May (overall mortality rate: 7.7%) (Table 3).
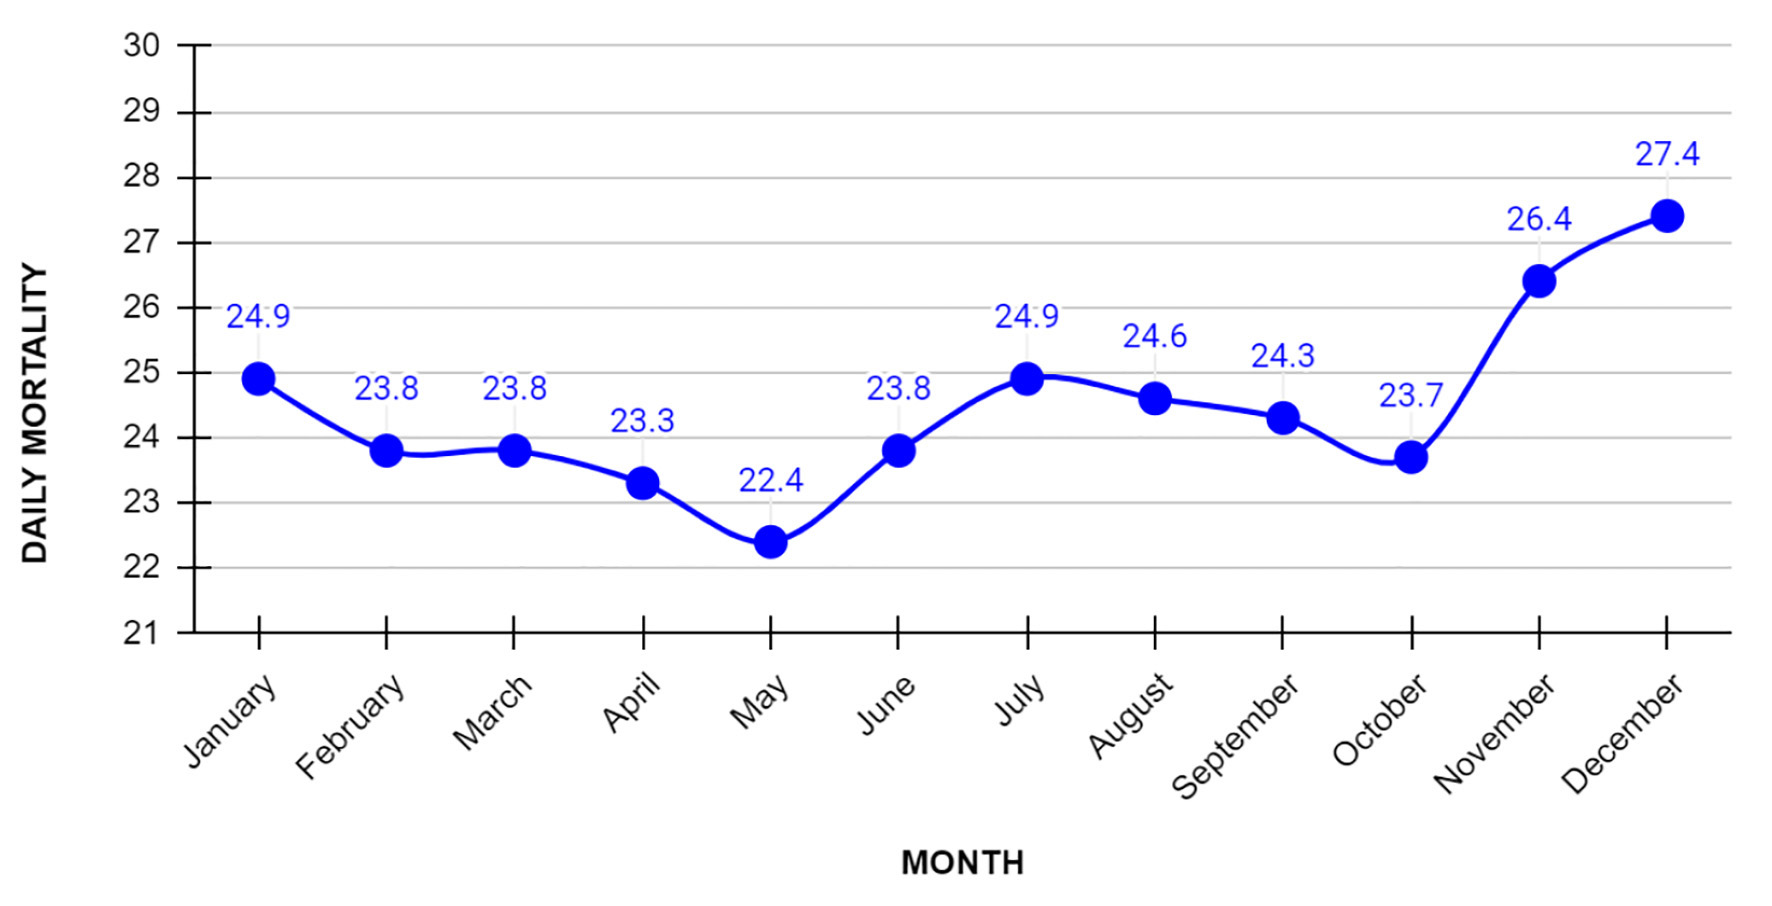 Click for large image | Figure 2. Daily mortality for alcohol-related hepatitis based on each month. December was noted to have the highest number of daily mortality. |
Click to view | Table 3. Adjusted Odds Ratio for Each Month With May as a Reference Month |
US regional analysis
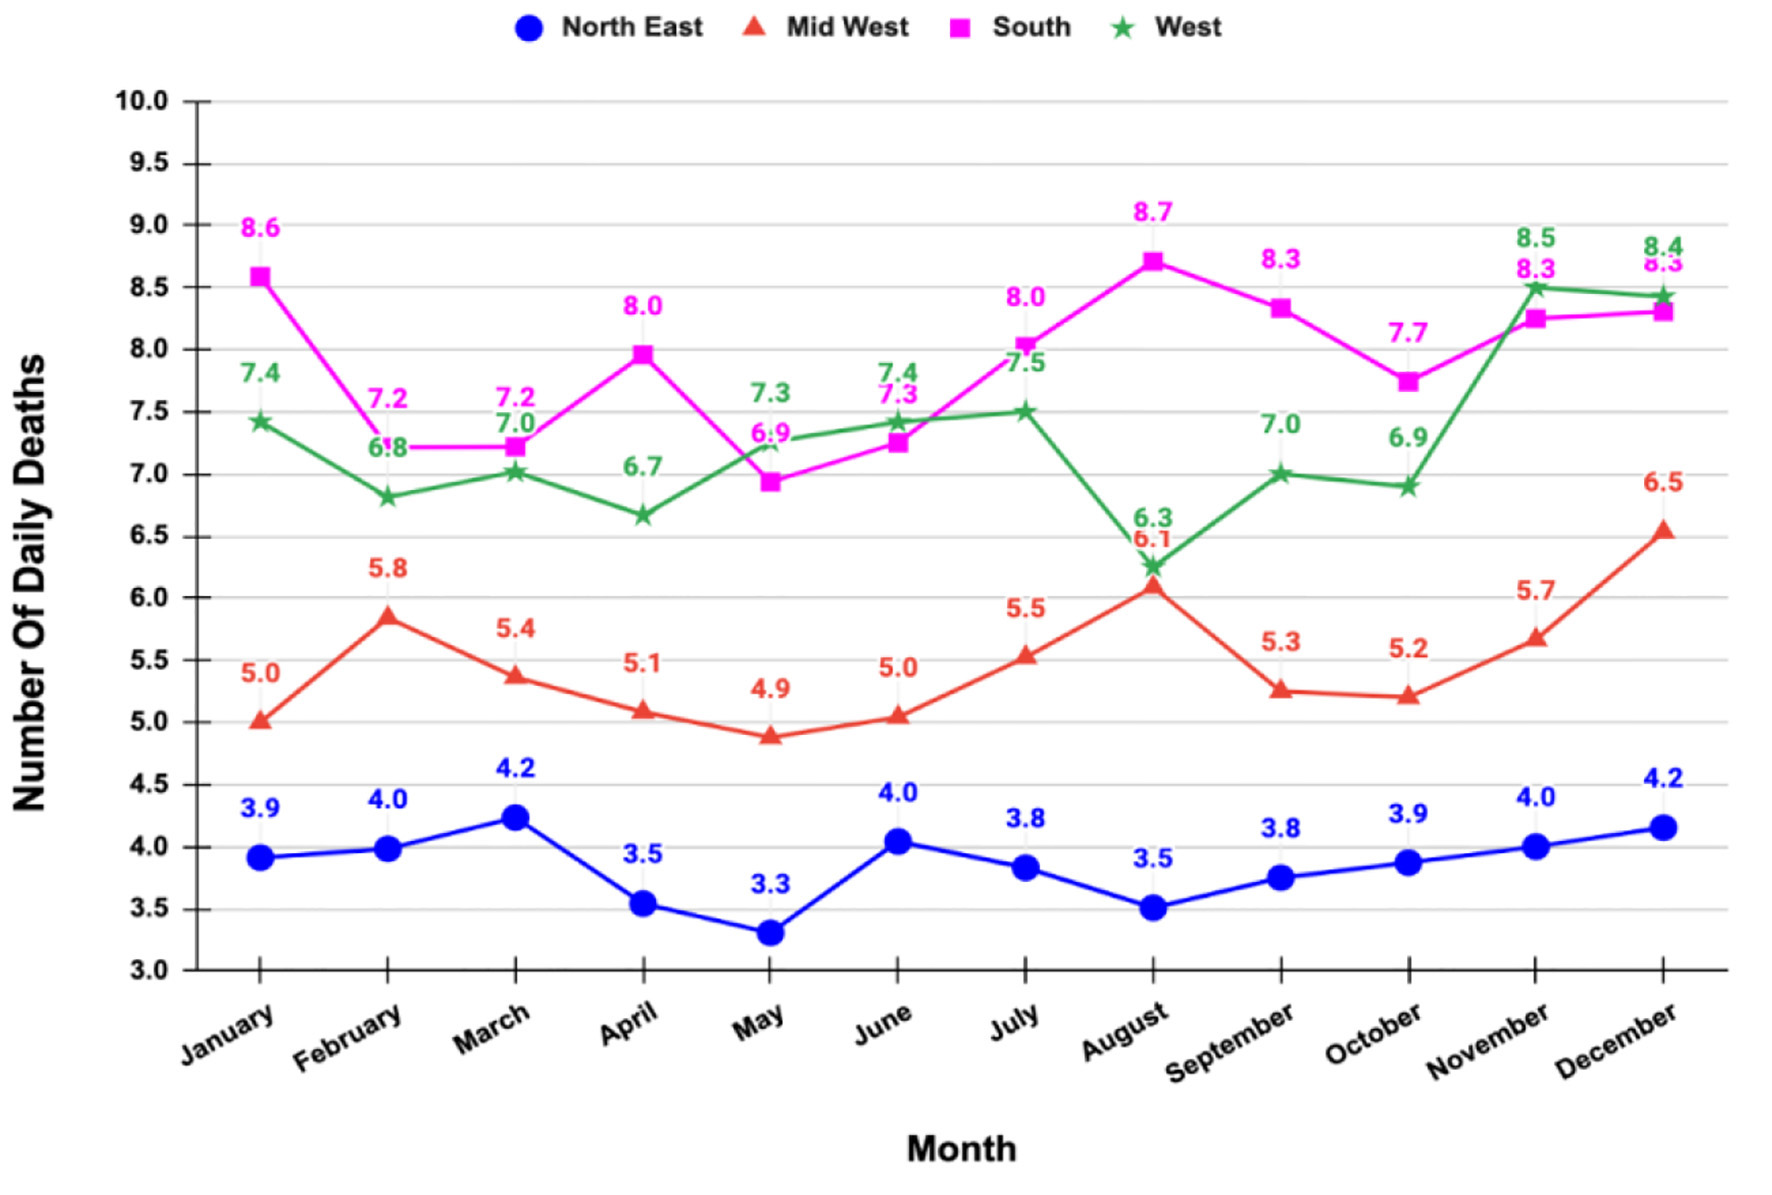
In the pre-specified regional analysis, the overall rates of hospitalization for acute AH were higher in hospitals located in the south. This was followed by hospitals in the west and mid-west while the northeast had the lowest number of hospitalizations (Fig. 3). Across all four geographical areas, there was an increase in AH hospitalizations in July and August. All-cause in-hospital mortality associated with AH for each region is summarized in Figure 4. In-hospital mortality was relatively higher in winter months in the south, mid-west, and west regions. However, the mortality rate was relatively stable in the northeast region.
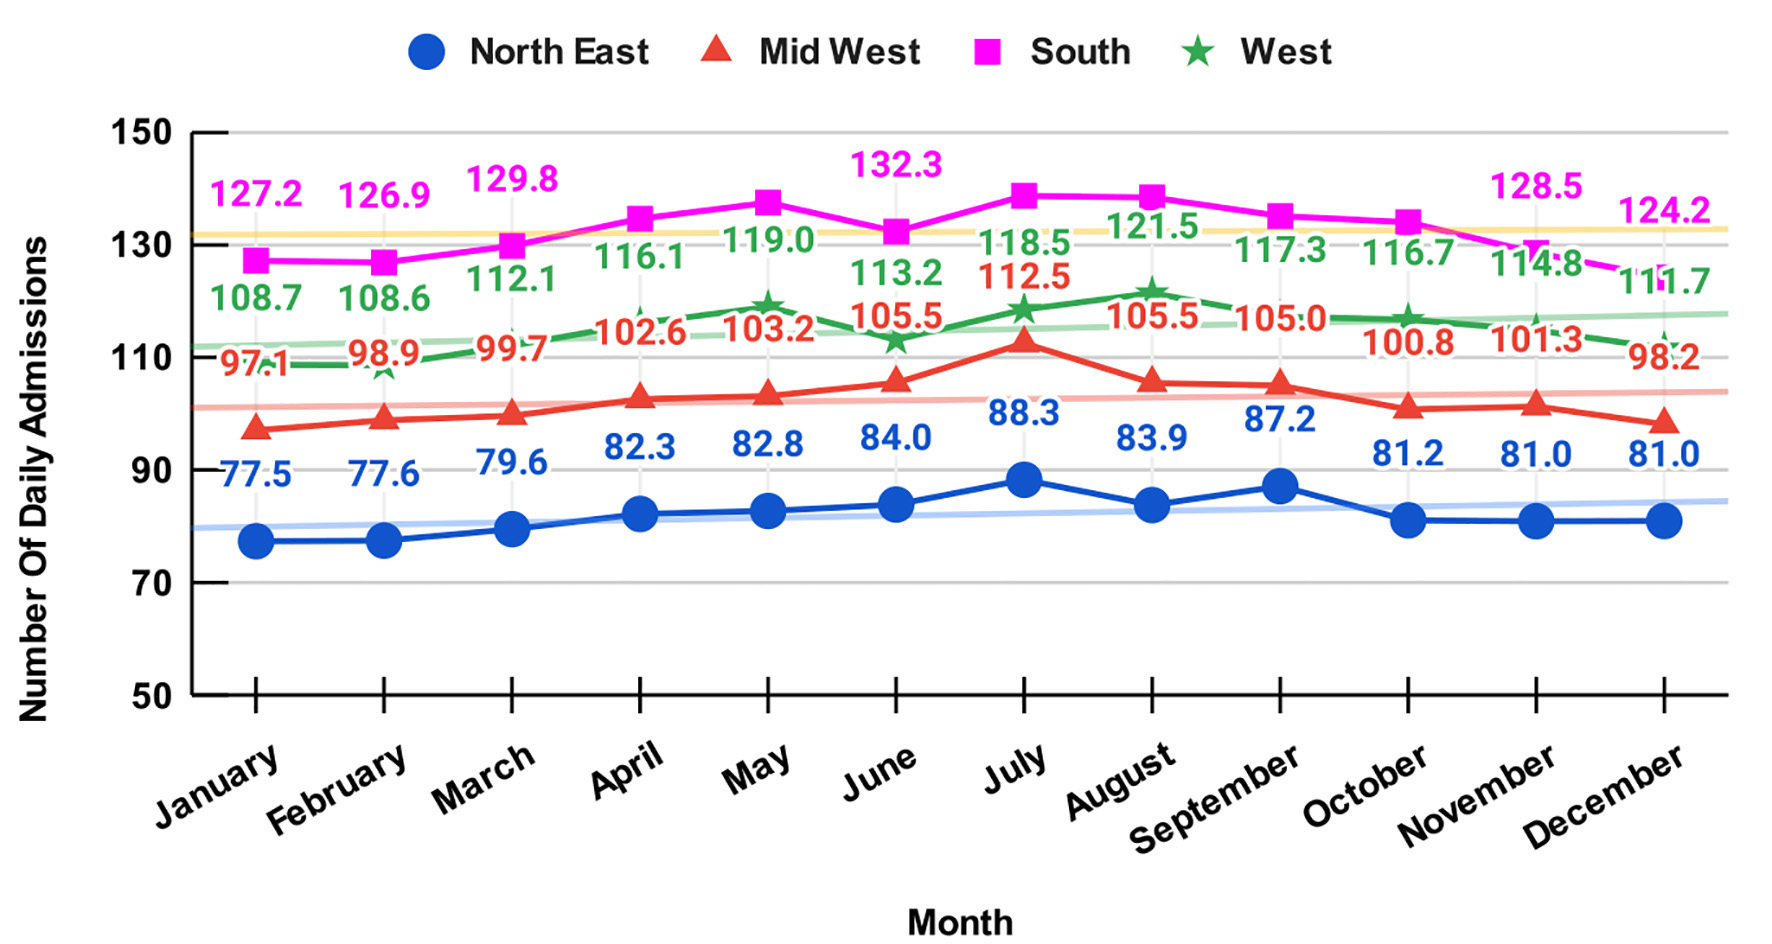 Click for large image | Figure 3. Regional differences in daily admissions for alcohol-related hepatitis. |
 Click for large image | Figure 4. Regional differences in daily mortality for alcohol-related hepatitis. |
| Discussion | ▴Top |
AH is one of the most florid manifestations of alcohol-induced liver injury and leads to significant morbidity, mortality, and financial burden. In this study, we report specific key findings on the effect of seasonality on hospitalization for AH.
July and August are months with the highest number of average daily hospital admissions. January had the lowest number of average daily hospital admissions. Our study shows a rise in the number of cases for AH as we approach June followed by a downtrend. To the best of our knowledge, this is the first study looking at the impact of seasonality on AH in the United States. A study of AH hospitalizations in Canada reports that 28% of all hospitalizations occurred in the spring season, followed by the fall (26%) [10]. A related study conducted on patients with alcoholic and biliary pancreatitis in the United States revealed that alcohol-related pancreatitis was also associated with seasonality. This study also showed higher admission during the summer (June - September) [11]. Along with our data, these studies do not support the hypothesis that the hospitalizations for alcohol-related diseases are highest during the holiday season despite the peak in alcohol sales. This increase in AH can be attributed to heavy drinking in summer which was mentioned in a study done on seasonal variation in alcohol use [12]. As per the study, majority of the population drinks in winter but heavy drinking is seen generally in summer which leads to AH and alcohol-related pancreatitis.
The highest national in-hospital mortality rates occurred in November and December while the lowest national in-patient mortality was noted to be in May. This may be due to the strain that our health system faces during the holiday season. The holiday season is associated with closed primary care offices and decreased workforce on consultative services such as hepatology which may lead to patients not receiving appropriate intervention promptly. In contrast, there are relatively few holidays in April and May (except for Memorial Day and Easter). A similar seasonal trend in mortality can also be seen in other conditions such as heart failure [13] and coronary artery disease [14]. Hospitals are also overwhelmed during the winter season with patients being admitted for influenza causing further strain on the healthcare resources. There was also a difference in mortality by seasons in various regions. A higher mortality rate was seen in the south, west and mid-west in months of November and December (Fig. 3). It is pertinent to note that HCUP includes 14 states in the south and 12 states in the west, which might be responsible for the higher mortality rates (Supplementary Material 1, www.gastrores.org). Further research is required to study the impact of climate or other confounding factors in the differences among the mortality rates in various regions. The overall rate of hospitalization for AH was highest in hospitals located in the south (Fig. 4). The lowest hospitalizations were in northeast. We found that in every region, more patients were admitted with AH during the summer months. Further studies with propensity matching will be required to study if there are regional differences in admissions for AH.
These findings could be used to help in health planning to prepare for seasons or months in certain geographical areas. To get the most out of state and federal funds, looking at trends in geography and time can be beneficial in terms of hospitalization for AH. According to previous studies, the 30-day mortality for AH is high and recently we have seen an increase in the use of liver transplantation as early therapy for AH [15]. Since AH hospitalization costs are on the rise, early cessation programs for persons at risk of chronic alcohol use and binge drinking are crucial [16].
We believe this study has significant clinical and economic implications. Primary care physicians can screen patients who are at risk of alcohol use disorder and its complications specifically before these months. Allocating more resources such as timely education and appropriate education during this high-risk period of increased hospitalizations can lead to improved healthcare.
Our study has several limitations. This study relied on a large nationwide database and is subject to the limitations of observational data. Individual chart review was not possible. The monetary burden of AH-related hospitalizations is likely underestimated as it does not include indirect costs such as lost workdays, long-term care costs of rehabilitation facilities and subsequent outpatient encounters. This study also relied heavily on the accuracy of the ICD-10 codes entered at the time of discharge from the hospital. Although various practitioners will have different thresholds for coding AH as a diagnosis, we believe that it captured most of the patients who had alcohol-induced liver damage. Finally, Maddrey’s discriminant function and MELD score could not be calculated from the variables available in the database. NIS database takes into account one admission and as a result patients with multiple admissions could not be differentiated.
Our findings demonstrate that seasonal variations in hospitalizations related to AH do exist across the United States. Most of the cases occur in July and August, yet mortality is higher in the winter. Hospital administrators and other stewards of healthcare resources can use seasonal patterns to guide allocation of resources.
| Supplementary Material | ▴Top |
Suppl 1. States in Each Region, Specific by Healthcare Cost and Utilization Project.
Acknowledgments
None to declare.
Financial Disclosure
None to declare.
Conflict of Interest
None to declare.
Informed Consent
Not applicable.
Author Contributions
Aalam Sohal, Kanwal Bains, Armaan Dhaliwal, Hunza Chaudhry, Piyush Singla, Raghav Sharma, Gagan Gupta and Dino Dukovic reviewed the literature, drafted the manuscript, revised it for important intellectual content and were involved in the final approval of the version to be published. Marina Roytman, Steven Tringali and Sunny Sandhu revised the manuscript and were involved in the final approval of the version to be published.
Data Availability
The data supporting the findings of this study are available from the corresponding author upon reasonable request.
| References | ▴Top |
- Grant BF, Goldstein RB, Saha TD, Chou SP, Jung J, Zhang H, Pickering RP, et al. Epidemiology of DSM-5 alcohol use disorder: results from the national epidemiologic survey on alcohol and related conditions III. JAMA Psychiatry. 2015;72(8):757-766.
doi pubmed - Hosseini N, Shor J, Szabo G. Alcoholic hepatitis: a review. Alcohol Alcohol. 2019;54(4):408-416.
doi pubmed - Sandahl TD, Jepsen P, Thomsen KL, Vilstrup H. Incidence and mortality of alcoholic hepatitis in Denmark 1999-2008: a nationwide population based cohort study. J Hepatol. 2011;54(4):760-764.
doi pubmed - Liangpunsakul S. Clinical characteristics and mortality of hospitalized alcoholic hepatitis patients in the United States. J Clin Gastroenterol. 2011;45(8):714-719.
doi pubmed - Bellis MA, Hughes K, Jones L, Morleo M, Nicholls J, McCoy E, Webster J, et al. Holidays, celebrations, and commiserations: measuring drinking during feasting and fasting to improve national and individual estimates of alcohol consumption. BMC Med. 2015;13:113.
doi pubmed - Healthcare Cost and Utilization Project (HCUP) Statistical Briefs. Rockville (MD). 2006.
- Roberts SE, Akbari A, Thorne K, Atkinson M, Evans PA. The incidence of acute pancreatitis: impact of social deprivation, alcohol consumption, seasonal and demographic factors. Aliment Pharmacol Ther. 2013;38(5):539-548.
doi pubmed - Mojica-Perez Y, Callinan S, Livingston M. Time of Year Effects on Self-Reported Estimates of Past-Year Alcohol Consumption. Alcohol Alcohol. 2019;54(5):540-544.
doi pubmed - Quan H, Sundararajan V, Halfon P, Fong A, Burnand B, Luthi JC, Saunders LD, et al. Coding algorithms for defining comorbidities in ICD-9-CM and ICD-10 administrative data. Med Care. 2005;43(11):1130-1139.
doi pubmed - Iluz-Freundlich D, Uhanova J, Minuk GY. Seasonal variability in the activity of common chronic liver diseases. Can Liver J. 2019;2(4):184-189.
doi - Shmelev A, Sill AM, Horrigan T, Cunningham SC. Trends and seasonality in hospitalizations for acute alcohol-related and biliary pancreatitis in the USA. Hepatobiliary Pancreat Dis Int. 2021;20(2):173-181.
doi pubmed - Uitenbroek DG. Seasonal variation in alcohol use. J Stud Alcohol. 1996;57(1):47-52.
doi pubmed - Akintoye E, Briasoulis A, Egbe A, Adegbala O, Alliu S, Sheikh M, Singh M, et al. Seasonal variation in hospitalization outcomes in patients admitted for heart failure in the United States. Clin Cardiol. 2017;40(11):1105-1111.
doi pubmed - Seto TB, Mittleman MA, Davis RB, Taira DA, Kawachi I. Seasonal variation in coronary artery disease mortality in Hawaii: observational study. BMJ. 1998;316(7149):1946-1947.
doi pubmed - Lee BP, Chen PH, Haugen C, Hernaez R, Gurakar A, Philosophe B, Dagher N, et al. Three-year results of a pilot program in early liver transplantation for severe alcoholic hepatitis. Ann Surg. 2017;265(1):20-29.
doi pubmed - Jinjuvadia R, Liangpunsakul S, Translational R. Evolving Alcoholic Hepatitis Treatment Consortium. Trends in alcoholic hepatitis-related hospitalizations, financial burden, and mortality in the United States. J Clin Gastroenterol. 2015;49(6):506-511.
doi pubmed
This article is distributed under the terms of the Creative Commons Attribution Non-Commercial 4.0 International License, which permits unrestricted non-commercial use, distribution, and reproduction in any medium, provided the original work is properly cited.
Gastroenterology Research is published by Elmer Press Inc.