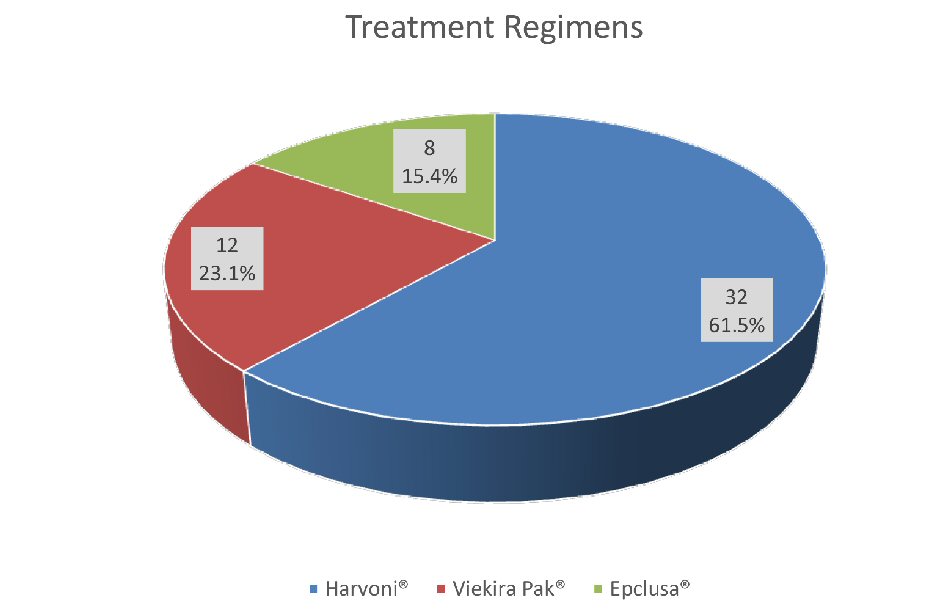
Figure 1. Treatment groups with different regimens.
| Gastroenterology Research, ISSN 1918-2805 print, 1918-2813 online, Open Access |
| Article copyright, the authors; Journal compilation copyright, Gastroenterol Res and Elmer Press Inc |
| Journal website http://www.gastrores.org |
Original Article
Volume 11, Number 2, April 2018, pages 130-137
Direct-Acting Antivirals in Chronic Hepatitis C Genotype 4 Infection in Community Care Setting
Figures
Tables
| Characteristics | All patients (n = 52) | Treatment regimens | P value | ||
|---|---|---|---|---|---|
| Harvoni® (n = 32) | Viekira Pak® (n = 12) | Epclusa® (n = 8) | |||
| Data are presented as mean (range) or number (percentage). *P value < 0.05: statistically significant. BMI: body mass index; HCV: hepatitis C virus; RNA: ribonucleic acid; APRI: AST-to-platelet ratio index; MELD: model for end-stage liver disease; AST: aspartate transaminase; ALT: alanine transaminase. | |||||
| Age (years) | 52.2 (19 - 79) | 53.5 (22 - 79) | 49.3 (19 - 70) | 51.1 (36 - 72) | 0.698 |
| Sex | |||||
| Male | 39 (75.0) | 25 (78.1) | 8 (66.7) | 6 (75.0) | 0.737 |
| Female | 13 (25.0) | 7 (21.9) | 4 (33.3) | 2 (25.0) | |
| BMI (kg/m2) | 28.0 (17.0 - 43.7) | 27.8 (18.0 - 43.7) | 27.6 (17.0 - 37.0) | 29.6 (20.0 - 39.0) | 0.683 |
| HCV RNA (IU/mL) | |||||
| < 800,000 | 23 (44.2) | 16 (50.0) | 5 (41.7) | 2 (25.0) | 0.435 |
| ≥ 800,000 | 29 (55.8) | 16 (50.0) | 7 (58.3) | 6 (75.0) | |
| Prior treatment | |||||
| Naive | 43 (82.7) | 26 (81.3) | 11 (91.7) | 6 (75.0) | 0.591 |
| Experienced | 9 (17.3) | 6 (18.8) | 1 (8.3) | 2 (25.0) | |
| Comorbidities | |||||
| Diabetes | 15 (28.8) | 8 (53.3) | 5 (33.3) | 2 (13.3) | 0.535 |
| Hypertension | 28 (53.8) | 16 (57.1) | 7 (25.0) | 5 (17.9) | 0.768 |
| Coronary artery disease | 2 (3.8) | 1 (50.0) | 1 (50.0) | 0 | 0.601 |
| Kidney disease | 3 (5.8) | 0 | 2 (66.7) | 1 (33.3) | 0.073 |
| Chronic anemia | 2 (3.8) | 0 | 1 (50.0) | 1 (50.0) | 0.169 |
| Cirrhosis | |||||
| Absent | 42 (80.8) | 28 (87.5) | 11 (91.7) | 3 (37.5) | 0.003* |
| Present | 10 (19.2) | 4 (12.5) | 1 (8.3) | 5 (62.5) | |
| MELD score | |||||
| < 10 | 44 (84.6) | 29 (90.6) | 10 (83.3) | 5 (62.5) | 0.142 |
| ≥ 10 | 8 (15.4) | 3 (9.3) | 2 (16.7) | 3 (37.5) | |
| Laboratory tests | |||||
| Hemoglobin (g/dL) | 13.7 (9.0 - 17.0) | 13.8 (10.0 - 17.0) | 13.1 (9.0 - 16.0) | 13.9 (10.0 - 16.0) | 0.476 |
| Platelets (×1000/mL) | 203.4 (35 - 341) | 201.8 (63 - 341) | 245.5 (152 - 330) | 146.6 (35 - 199) | 0.004* |
| Albumin (g/dL) | 4.2 (3.0 - 4.7) | 4.2 (3.2 - 4.7) | 4.1 (3.0 - 4.6) | 3.9 (3.0 - 4.7) | 0.224 |
| AST (IU/L) | 41.1 (13 - 123) | 39.2 (14 - 92) | 35.3 (13 - 107) | 57.1 (21 - 123) | 0.154 |
| ALT (IU/L) | 55.5 (9 - 220) | 51.1 (9 - 165) | 50.3 (10 - 220) | 81.2 (48 - 141) | 0.154 |
| Bilirubin (mg/dL) | 0.6 (0.2 - 1.9) | 0.6 (0.2 - 1.9) | 0.5 (0.2 - 0.9) | 0.6 (0.2 - 1.1) | 0.762 |
| Characteristics | All patients (n = 52) | Treatment response | Univariate P value | Multivariate P value | |
|---|---|---|---|---|---|
| SVR (n = 49) | No SVR (n = 3) | ||||
| Data are presented as mean (range) or number (percentage). *Only variables with the P value < 0.05 in univariate analysis were assessed. BMI: body mass index; HCV: hepatitis C virus; RNA: ribonucleic acid; APRI: AST-to-platelet ratio index; MELD: model for end-stage liver disease; AST: aspartate transaminase; ALT: alanine transaminase. | |||||
| Age (years) | 52.2 (19 - 79) | 51.2 (19 - 79) | 68.0 (64 - 74) | 0.055 | NA |
| Age group | |||||
| < 65 | 39 (75.0) | 38 (77.6) | 1 (33.3) | 0.151 | NA |
| ≥ 65 | 13 (25.0) | 11 (22.4) | 2 (66.7) | ||
| Sex | |||||
| Male | 39 (75.0) | 36 (73.5) | 3 (100) | 0.414 | NA |
| Female | 13 (25.0) | 13 (26.5) | 0 | ||
| BMI (kg/m2) | 28.0 (17.0 - 43.7) | 28.1 (17.0 - 43.7) | 26.5 (25.0 - 27.4) | 0.630 | NA |
| BMI (kg/m2) | |||||
| < 30 | 35 (67.3) | 32 (65.3) | 3 (100) | 0.296 | NA |
| ≥ 30 | 17 (32.7) | 17 (34.7) | 0 | ||
| HCV RNA (IU/mL) | |||||
| < 800,000 | 23 (44.2) | 21 (42.9) | 2 (66.7) | 0.412 | NA |
| ≥ 800,000 | 29 (55.8) | 28 (57.1) | 1 (33.3) | ||
| Prior treatment | |||||
| Naive | 43 (82.7) | 41 (83.7) | 2 (66.7) | 0.442 | NA |
| Experienced | 9 (17.3) | 8 (16.3) | 1 (33.3) | ||
| Comorbidities | |||||
| Diabetes | 15 (28.8) | 13 (86.7) | 2 (13.3) | 0.196 | NA |
| Hypertension | 28 (53.8) | 26 (92.9) | 2 (7.1) | 0.559 | NA |
| Coronary artery disease | 2 (3.8) | 2 (100) | 0 | 0.887 | NA |
| Kidney disease | 3 (5.8) | 2 (66.7) | 1 (33.3) | 0.166 | NA |
| Chronic anemia | 2 (3.8) | 2 (100) | 0 | 0.887 | NA |
| Cirrhosis | |||||
| Absent | 42 (80.8) | 41 (83.7) | 1 (33.3) | 0.091 | NA |
| Present | 10 (19.2) | 8 (16.3) | 2 (66.7) | ||
| MELD score | |||||
| < 10 | 44 (84.6) | 43 (87.8) | 1 (33.3) | 0.058 | NA |
| ≥ 10 | 8 (15.4) | 6 (12.2) | 2 (66.7) | ||
| Laboratory tests | |||||
| Hemoglobin (g/dL) | 13.7 (9.0 - 17.0) | 13.7 (9.0 - 17.0) | 13.5 (12.5 - 14) | 0.872 | NA |
| Platelets (×1000/mL) | 203.4 (35 - 341) | 206.3 (35 - 341) | 156.7 (63 - 299) | 0.228 | NA |
| Albumin (g/dL) | 4.2 (3.0 - 4.7) | 4.2 (3.0 - 4.7) | 3.6 (3.2 - 3.9) | 0.039 | 0.99* |
| AST (IU/L) | 41.1 (13 - 123) | 40.0 (13 - 123) | 58.0 (34 - 98) | 0.252 | NA |
| ALT (IU/L) | 55.5 (9 - 220) | 56.2 (9 - 220) | 45.0(16 - 92) | 0.650 | NA |
| Bilirubin (mg/dL) | 0.6 (0.2 - 1.9) | 0.5 (0.2 - 1.2) | 1.0 (0.3 - 1.9) | 0.048 | 0.99* |
| Response | SVR 12 rate | Univariate P value | Multivariate P value |
|---|---|---|---|
| Data presented as number/total number (percent). *Only variables with the P value < 0.05 in univariate analysis were assessed. BMI: body mass index; HCV: hepatitis C virus; RNA: ribonucleic acid; APRI: AST-to-platelet ratio index; MELD: model for end-stage liver disease; ALT: alanine transaminase. | |||
| Overall | 30/32 (93.8) | ||
| Age group | |||
| < 65 | 22/23 (95.7) | 0.490 | NA |
| ≥ 65 | 8/9 (88.9) | ||
| Sex | |||
| Male | 23/25 (92.0) | 1.000 | NA |
| Female | 7/7 (100) | ||
| BMI (kg/m2) | |||
| < 30 | 21/23 (91.3) | 1.000 | NA |
| ≥ 30 | 9/9 (100) | ||
| HCV RNA (IU/mL) | |||
| < 800,000 | 14/16 (87.5) | 0.242 | NA |
| ≥ 800,000 | 16/16 (100) | ||
| Prior treatment | |||
| Naive | 25/26 (96.2) | 0.345 | NA |
| Experienced | 5/6 (83.3) | ||
| Comorbidities | |||
| Diabetes | 7/8 (87.5) | 0.444 | NA |
| Hypertension | 15/16 (93.8) | 1.000 | NA |
| CAD | 1/1 (100) | 1.000 | NA |
| Kidney disease | 0 | N/A | NA |
| Chronic anemia | 0 | N/A | NA |
| Cirrhosis | |||
| Absent | 28/28 (100) | 0.012 | 0.996* |
| Present | 2/4 (50) | ||
| ALT (IU/L) | |||
| < 40 | 15/17 (88.2) | 0.486 | NA |
| ≥ 40 | 15/15 (100) | ||
| Response | SVR 12 rate | P value |
|---|---|---|
| Data presented as number/total number (percent). BMI: body mass index; HCV: hepatitis C virus; RNA: ribonucleic acid; APRI: AST-to-platelet ratio index; MELD: model for end-stage liver disease; ALT: alanine transaminase. | ||
| Overall | 11/12 (91.7) | |
| Age group | ||
| < 65 | 9/9 (100) | 0.250 |
| ≥ 65 | 2/3 (66.7) | |
| Sex | ||
| Male | 7/8 (87.5) | 1.000 |
| Female | 4/4 (100) | |
| BMI (kg/m2) | ||
| < 30 | 7/8 (87.5) | 1.000 |
| ≥ 30 | 4/4 (100) | |
| HCV RNA (IU/mL) | ||
| < 800,000 | 5/5 (100) | 0.583 |
| ≥ 800,000 | 6/7 (85.7) | |
| Prior treatment | ||
| Naive | 10/11 (90.9) | 1.000 |
| Experienced | 1/1 (100) | |
| Comorbidities | ||
| Diabetes | 4/5 (80.0) | 0.417 |
| Hypertension | 6/7 (85.7) | 1.000 |
| CAD | 1/1 (100) | 1.000 |
| Kidney disease | 1/2 (50) | 0.167 |
| Chronic anemia | 1/1 (100) | 1.000 |
| Cirrhosis | ||
| Absent | 10/11 (90.9) | 1.000 |
| Present | 1/1 (100) | |
| MELD score | ||
| < 10 | 9/10 (90.0) | 1.000 |
| ≥ 10 | 2/2 (100) | |
| ALT (IU/L) | ||
| < 40 | 8/8 (100) | 0.333 |
| ≥ 40 | 3/4 (75) | |
| Response | SVR 12 rate | P value |
|---|---|---|
| Data presented as number/total number (percent). BMI: body mass index; HCV: hepatitis C virus; RNA: ribonucleic acid; APRI: AST-to-platelet ratio index; MELD: model for end-stage liver disease; ALT: alanine transaminase. | ||
| Overall | 8/8 (100) | |
| Age group | ||
| < 65 | 7/7 (100) | N/A |
| ≥ 65 | 1/1 (100) | |
| Sex | ||
| Male | 6/6 (100) | N/A |
| Female | 2/2 (100) | |
| BMI (kg/m2) | ||
| < 30 | 4/4 (100) | N/A |
| ≥ 30 | 4/4 (100) | |
| HCV RNA (IU/mL) | ||
| < 800,000 | 2/2 (100) | N/A |
| ≥ 800,000 | 6/6 (100) | |
| Prior treatment | ||
| Naive | 6/6 (100) | N/A |
| Experienced | 2/2 (100) | |
| Comorbidities | ||
| Diabetes | 2/2 (100) | N/A |
| Hypertension | 5/5 (100) | N/A |
| CAD | 0 | N/A |
| Kidney disease | 1/1 (100) | N/A |
| Chronic anemia | 1/1 (100) | N/A |
| Cirrhosis | ||
| Absent | 3/3 (100) | N/A |
| Present | 5/5 (100) | |
| MELD score | ||
| < 10 | 5/5 (100) | N/A |
| ≥ 10 | 3/3 (100) | |
| ALT (IU/L) | ||
| < 40 | 0 | N/A |
| ≥ 40 | 8/8 (100) | |
| Adverse event | Treatment Regimen | P value | ||
|---|---|---|---|---|
| Harvoni® | Viekira Pak® | Epclusa® | ||
| Data presented as number (percent). | ||||
| Fatigue | 12 (37.5) | 1 (8.3) | 1 (12.5) | 0.092 |
| Headache | 1 (3.1) | 0 | 0 | 0.727 |
| Dizziness | 4 (12.5) | 1 (8.3) | 0 | 0.554 |
| Nausea | 3 (9.4) | 0 | 2 (25.0) | 0.178 |
| Vomiting | 1 (3.1) | 0 | 0 | 0.727 |
| Photosensitivity | 2 (6.3) | 0 | 1 (12.5) | 0.493 |
| Skin rash | 2 (6.3) | 0 | 0 | 0.522 |
| Itching | 4 (12.5) | 0 | 0 | 0.258 |
| Arthralgia | 5 (15.6) | 1 (8.3) | 0 | 0.430 |
| Anemia | 3 (9.4) | 5 (41.7) | 1 (12.5) | 0.039 |
| Thrombocytopenia | 1 (3.1) | 0 | 1 (12.5) | 0.342 |
| Leukopenia | 3 (9.4) | 2 (16.7) | 1 (12.5) | 0.793 |