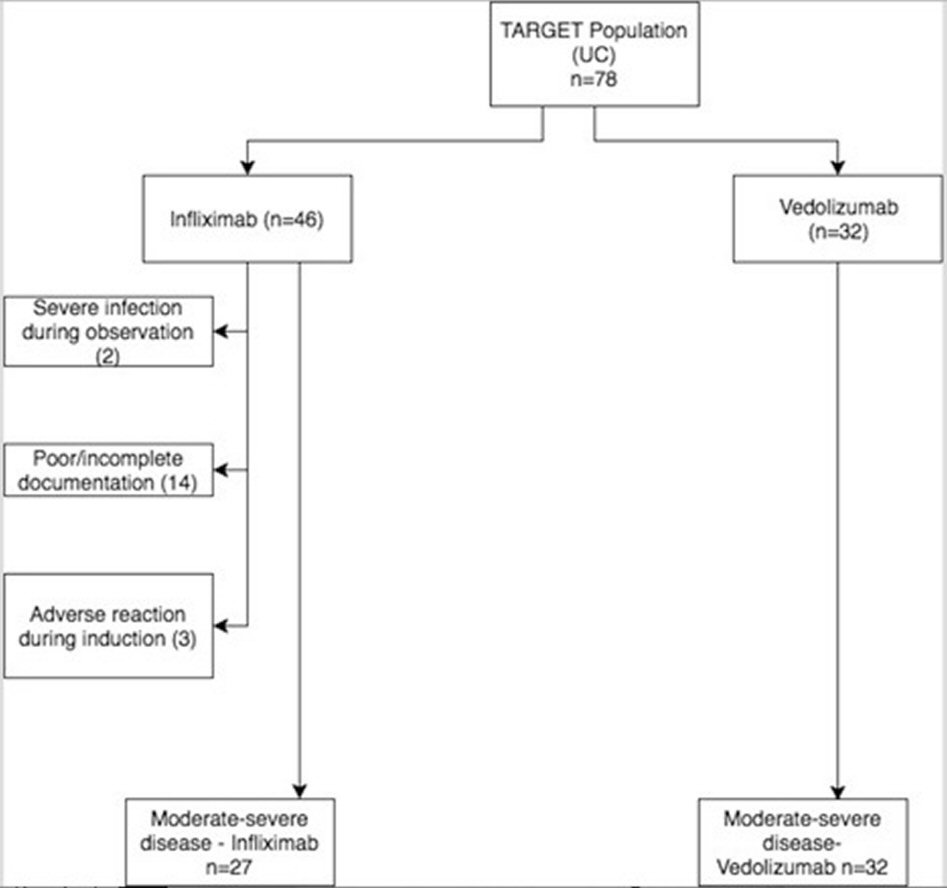
Figure 1. Flowchart of patients who met inclusion/exclusion criteria. UC: ulcerative colitis.
| Gastroenterology Research, ISSN 1918-2805 print, 1918-2813 online, Open Access |
| Article copyright, the authors; Journal compilation copyright, Gastroenterol Res and Elmer Press Inc |
| Journal website http://www.gastrores.org |
Original Article
Volume 11, Number 1, February 2018, pages 41-45
Comparative Effectiveness of Vedolizumab vs. Infliximab Induction Therapy in Ulcerative Colitis: Experience of a Real-World Cohort at a Tertiary Inflammatory Bowel Disease Center
Figure
Tables
| Infliximab (N = 27 ) | Vedolizumab (N = 32) | P-value | |
|---|---|---|---|
| STD: standard deviation; 5-ASA: 5-aminosalicylates; PPI: proton pump inhibitor; BMI: body mass index. | |||
| Age in year, mean (STD) | 42.3 (18.5) | 54.5 (17.9) | 0.0135 |
| DOD | 5.8 (5.8) | 6.6 (8.6) | 0.6682 |
| Race, % | 0.6692 | ||
| Non-Hispanic white | 18 (66.7) | 21 (65.6) | |
| Black | 7 (25.9) | 10 (31.2) | |
| Other | 2 (7.4) | 1 (3.1) | |
| Gender | 1.0000 | ||
| 0 (male) | 11 (40.7) | 14 (43.8) | |
| 1 (female) | 16 (59.3) | 18 (56.2) | |
| Nicotine use | 1 (3.7) | 2 (6.3) | 1.0000 |
| Steroid use | 8 (29.6) | 5 (15.6) | 0.1587 |
| 5-ASA | 18 (66.7) | 15 (46.9) | 0.1086 |
| Thiopurine | 7 (25.9) | 10 (31.3) | 0.7756 |
| Methotrexate | 3 (11.1) | 2 (6.2) | 0.6523 |
| TNF blocker experienced | 6 (22.2) | 19 (59.4) | 0.0076 |
| Vedolizumab exp. | 3 (11.1) | 0 (0) | 0.0900 |
| Vitamin D def. | 7 (25.9) | 11 (34.4) | 0.1059 |
| PPI use | 3 (11.1) | 6 (18.8) | 0.4877 |
| BMI | 25.7 (5.3) | 25.8 (5.4) | 0.5440 |
| Duration of clinical follow-up after induction, mean (weeks) | 12.38 | 15 | |
| Clinical response | 18 (66.7%) | 25 (78.1%) | 0.3861 |
| Proportion with response | Number with response | Number of total person weeks | Response rate (no. with response/PW)* | IRR (95% CI) | |
|---|---|---|---|---|---|
| *Response rate per 100 person-weeks. IRR: incidence rate ratio; CI: confidence interval. | |||||
| Overall | 43/59 (72.9%) | 43 | 814 | ||
| Infliximab | 18/27 (66.7%) | 18 | 334 | 5.38 | 1 |
| Vedolizumab | 25/32 (78.1%) | 25 | 480 | 5.21 | 0.97 (0.53 - 1.77) |
| Proportion with response | Response rate (number with response/PW)* | IRR (95% CI) | |
|---|---|---|---|
| *Response rate per 100 person-weeks. IRR: incidence rate ratio; CI: confidence interval. | |||
| Infliximab | 16/21 (76.2%) | 6.48 | 1 |
| Vedolizumab | 10/13 (76.9%) | 6.74 | 1.04 (0.47 - 2.29) |
| Clinical cohort | Proportion with response | Response rate (number with response/PW)* | IRR (95% CI) |
|---|---|---|---|
| *Response rate per 100 person-weeks. | |||
| Infliximab | 2/6 (33.3%) | 2.29 | 1 |
| Vedolizumab | 15/19 (78.9%) | 4.52 | 1.97 (0.45 - 8.63) |