| Age recipient: mean ± SD | 51.58 ± 11.17 | Hepatic encephalopathy | |
| Age donor: mean ± SD | | None, % (n) | 21.8% (6,732) |
| Gender recipient: male, % (n) | 64.8% (20,034) | Mild to moderate, % (n) | 59.8% (18,505) |
| Gender donor: male, % (n) | 59.8% (18,495) | Severe, % (n) | 17.4% (5,396) |
| Race recipient | | Unknown, % (n) | 1% (295) |
| White, % (n) | 71.3% (22,066) | Final MELD, mean ± SD | 27.366 ± 8.48 |
| Others, % (n) | 28.7% (8,862) | MELD groups | |
| Race donor | | 16 - 20, % (n) | 25.2% (7,806) |
| White, % (n) | 67.5% (20,862) | 21 - 25, % (n) | 24.4% (7,549) |
| Others, % (n) | 32.5% (10,066) | 26 - 30, % (n) | 17.8% (5,500) |
| Ethnicity recipient | | 31 - 35, % (n) | 13.6% (4,214) |
| Non-Hispanic, % (n) | 86.4% (26,735) | > 36, % (n) | 18.9% (5,859) |
| Hispanic, % (n) | 13.6% (4,193) | Child-Pugh score | |
| BMI, mean ± SD | 28.30 ± 7.10 | Class A, % (n) | 1.7% (518) |
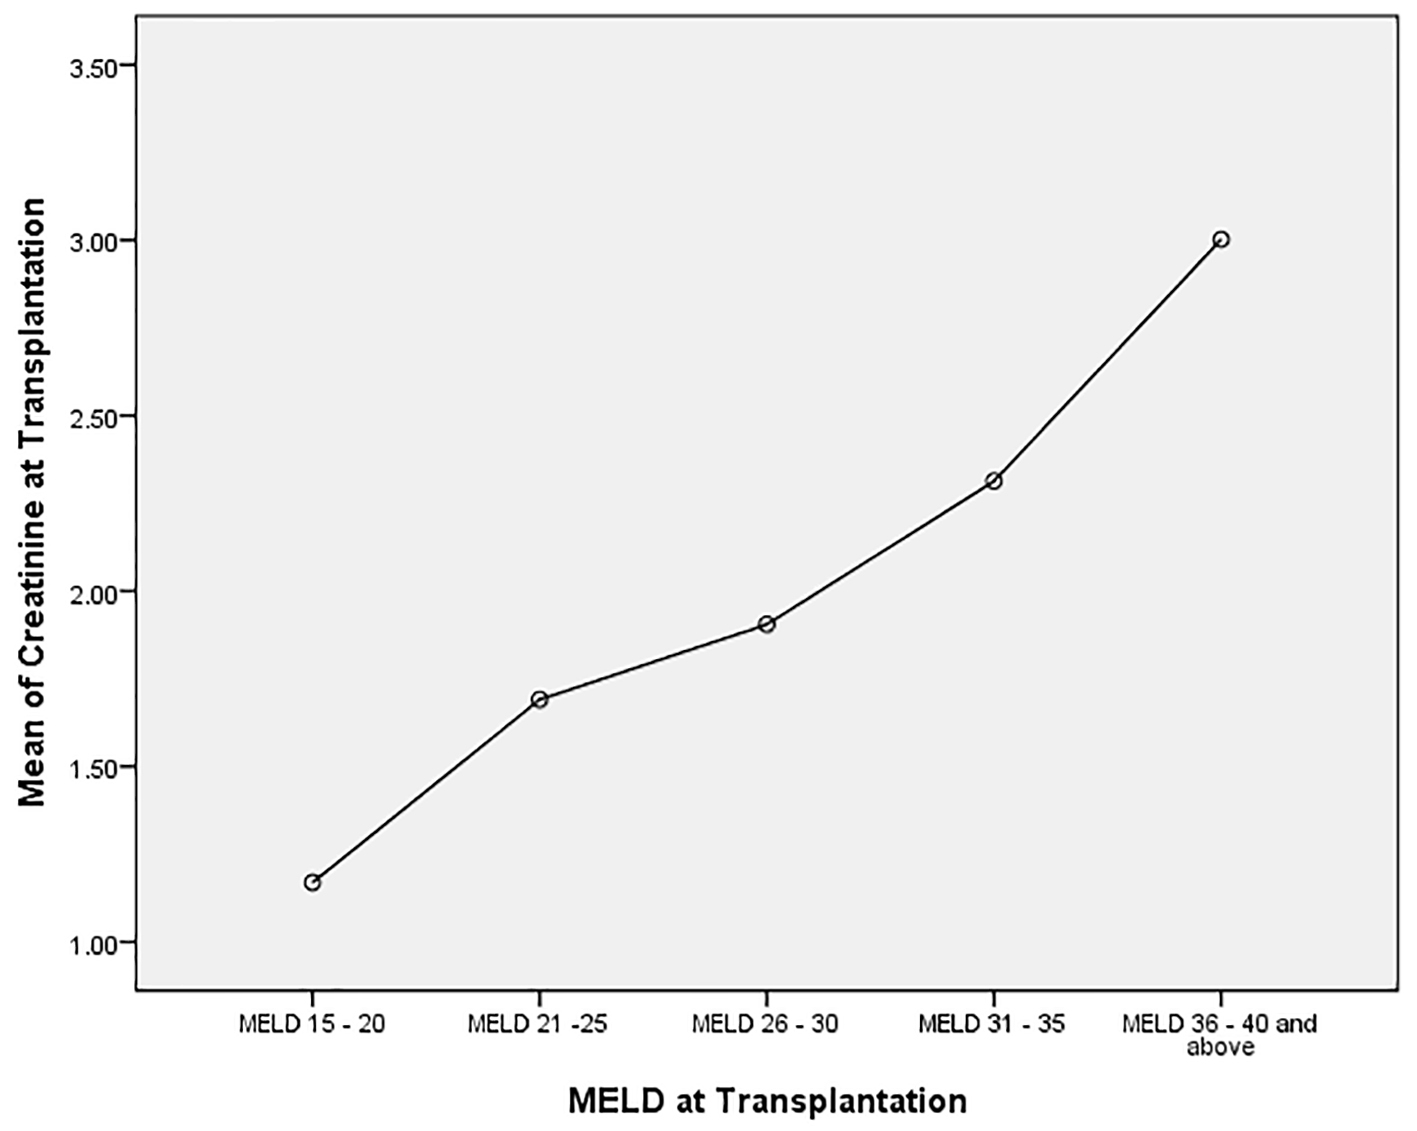
| Creatinine at Tx, mg/dL, mean ± SD | 1.93 ± 1.56 | Class B, % (n) | 25.9% (8,025) |
| Dialysis at Tx, % (n) | 16.4% (5,084) | Class C, % (n) | 67.1% (20,759) |
| Albumin at Tx, mean ± SD | 2.84 ± 0.73 | Missing, % (n) | 5.3% (1,626) |
| INR at Tx, mean ± SD | 2.2 ± 1.7 | Distribution of patients based on renal functions | |
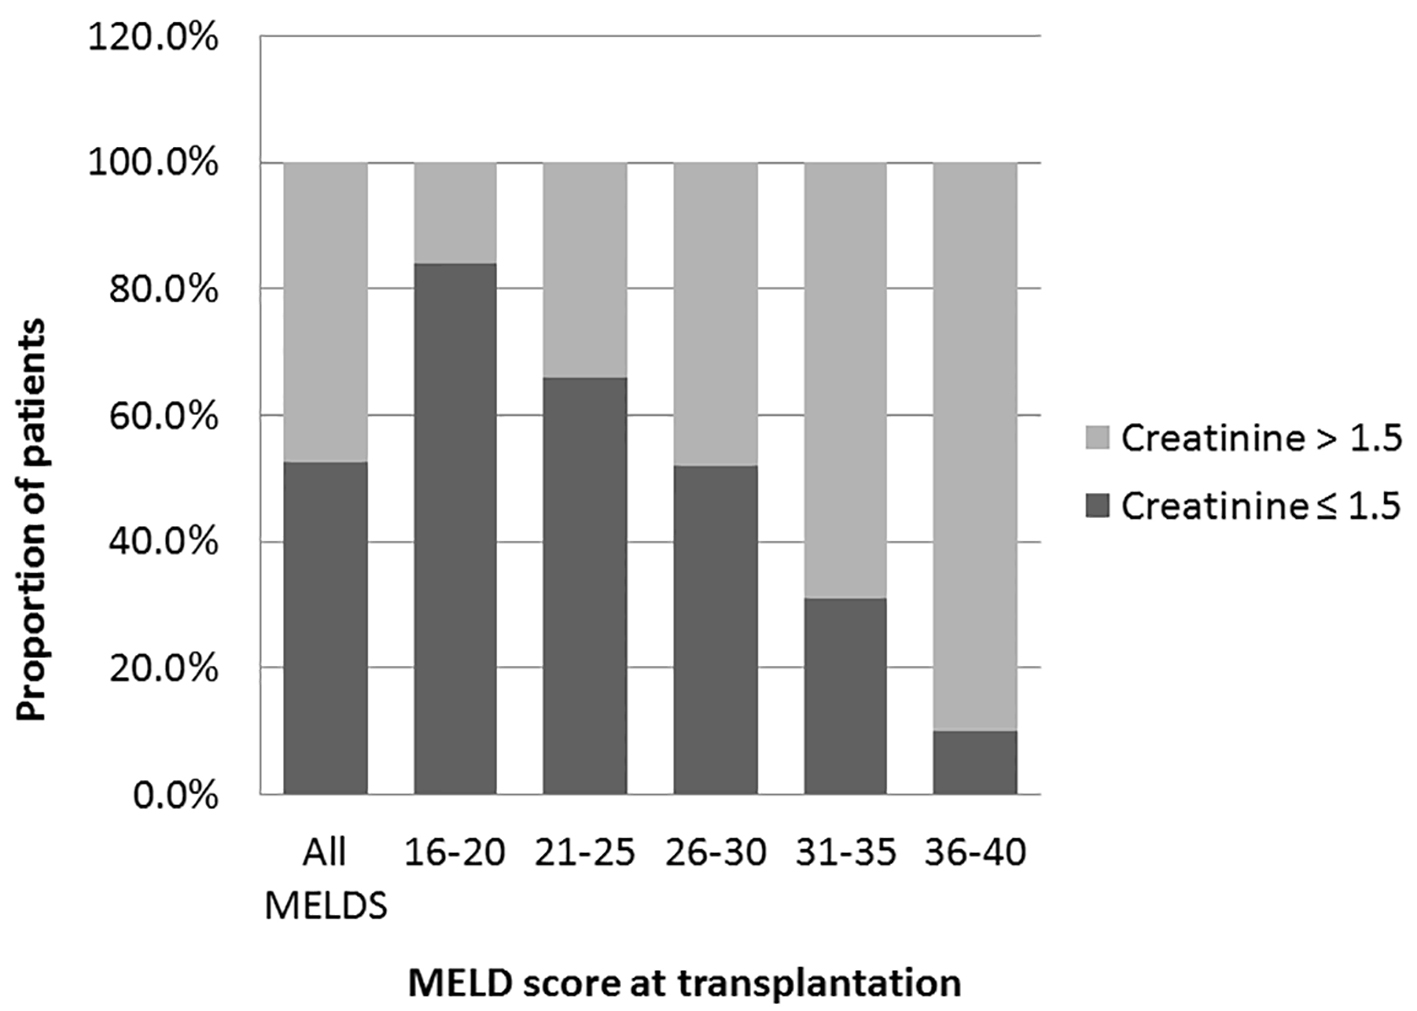
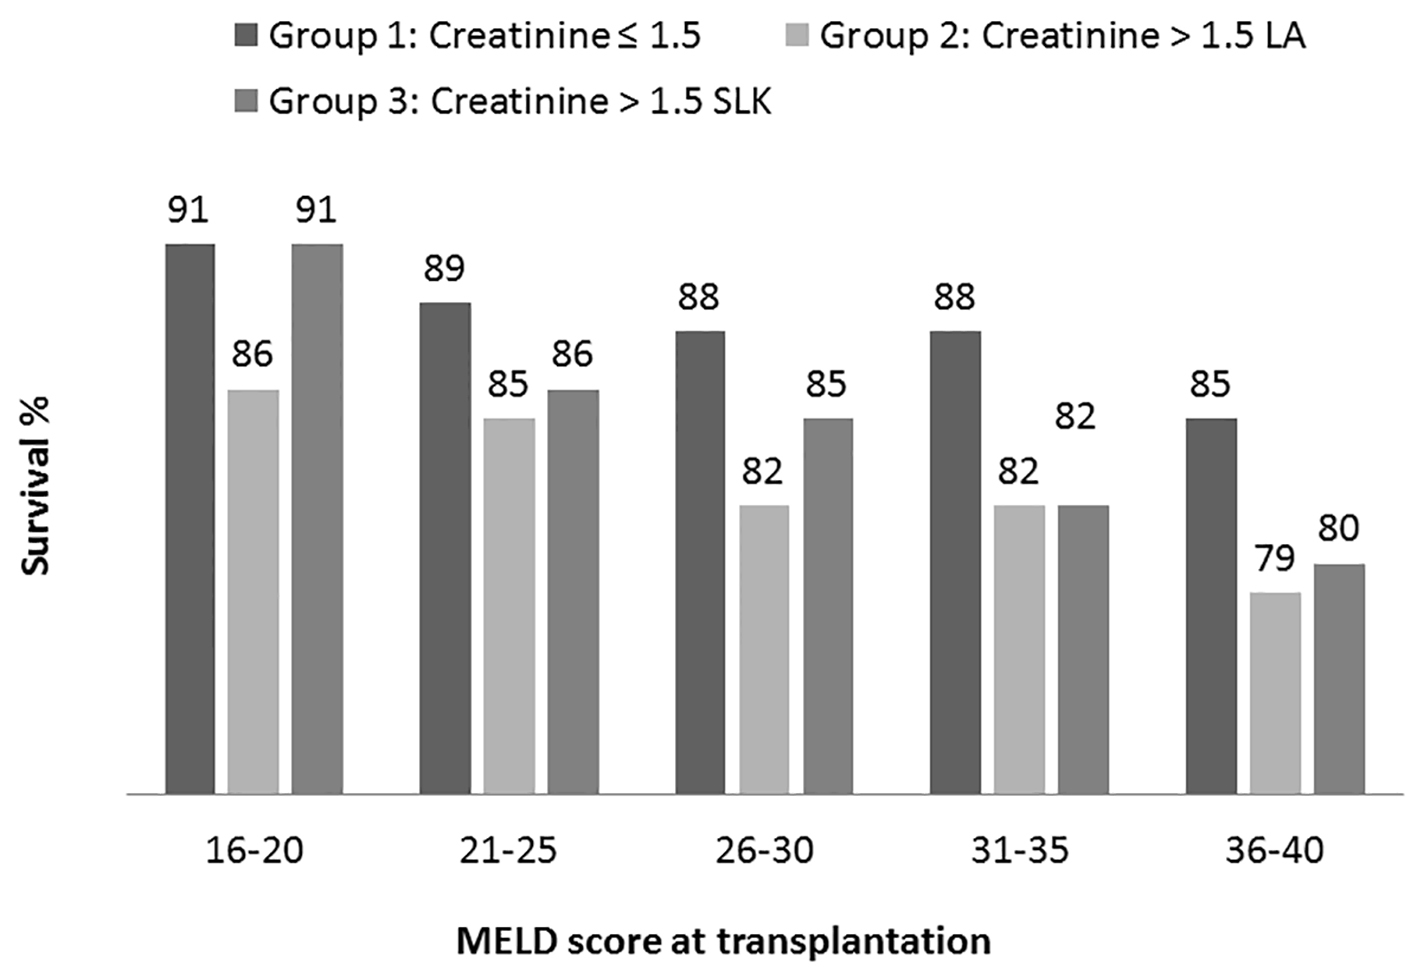
| T. bilirubin at Tx, mg/dL, mean ± SD | 12.27 ± 12.5 | Creatinine 1.5 or less, % (n) | 52.5% (16,249) |
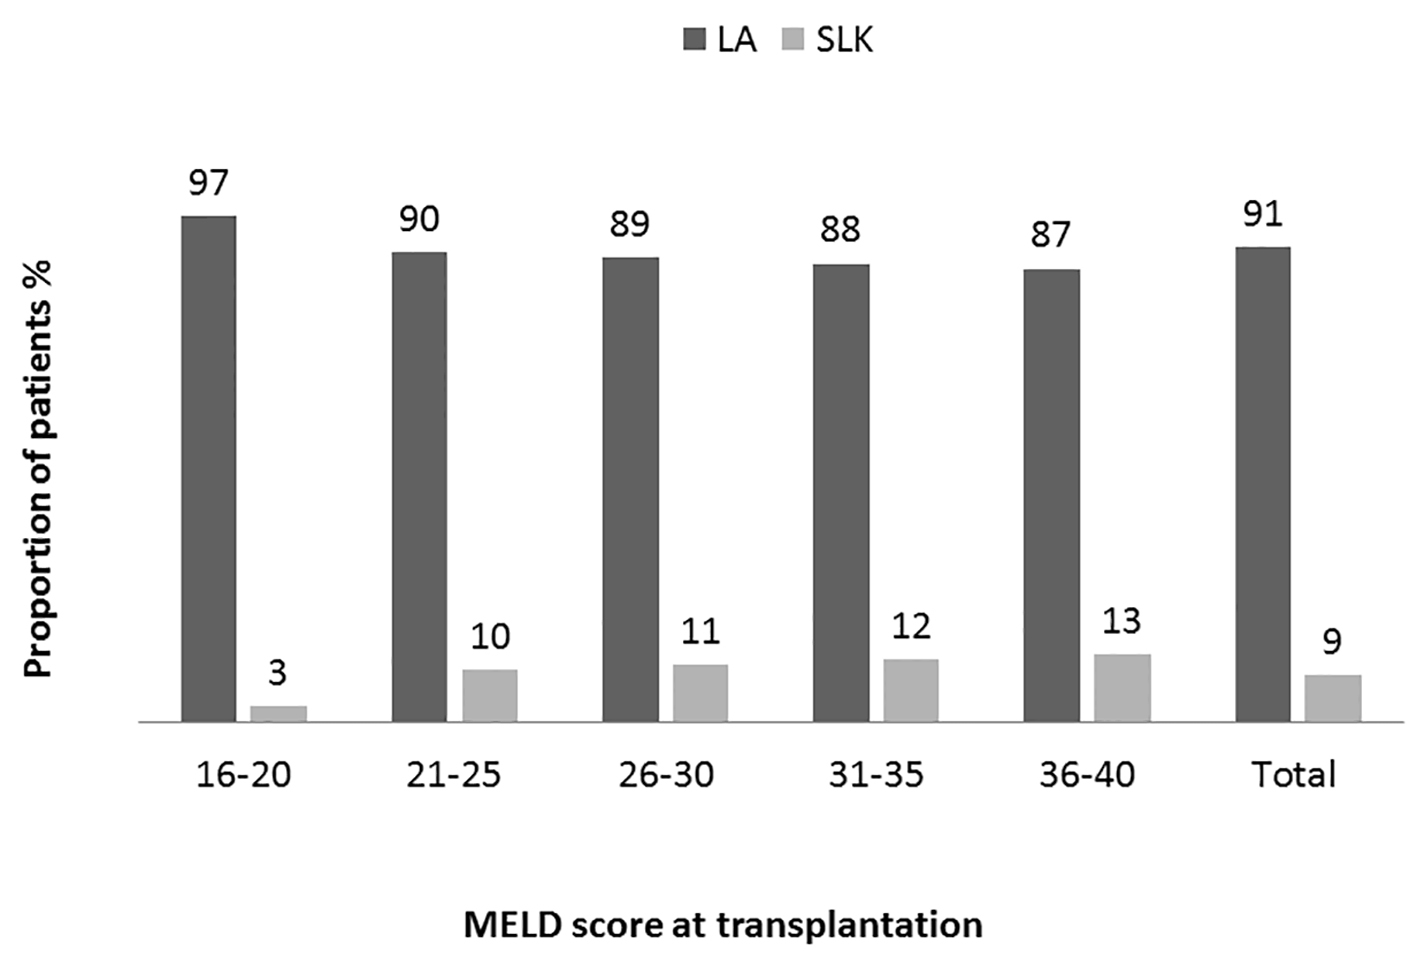
| Ascites | | Creatine > 1.5 non-dialysis LTA, % (n) | 28.1% (8,701) |
| None, % (n) | 12.9% (3,986) | Creatine > 1.5 non-dialysis SLKT, % (n) | 2.9 % (894) |
| Mild to moderate, % (n) | 48.9% (15,129) | Creatine > 1.5 dialysis LTA, % (n) | 10.2% (3,161) |
| Severe, % (n) | 37.2 (11,520) | Creatine > 1.5 dialysis SLKT, % (n) | 6.2% (1,923) |
| Unknown, % (n) | 0.9% (293) | LOS, mean ± SD | 18.91 ± 24.46) |