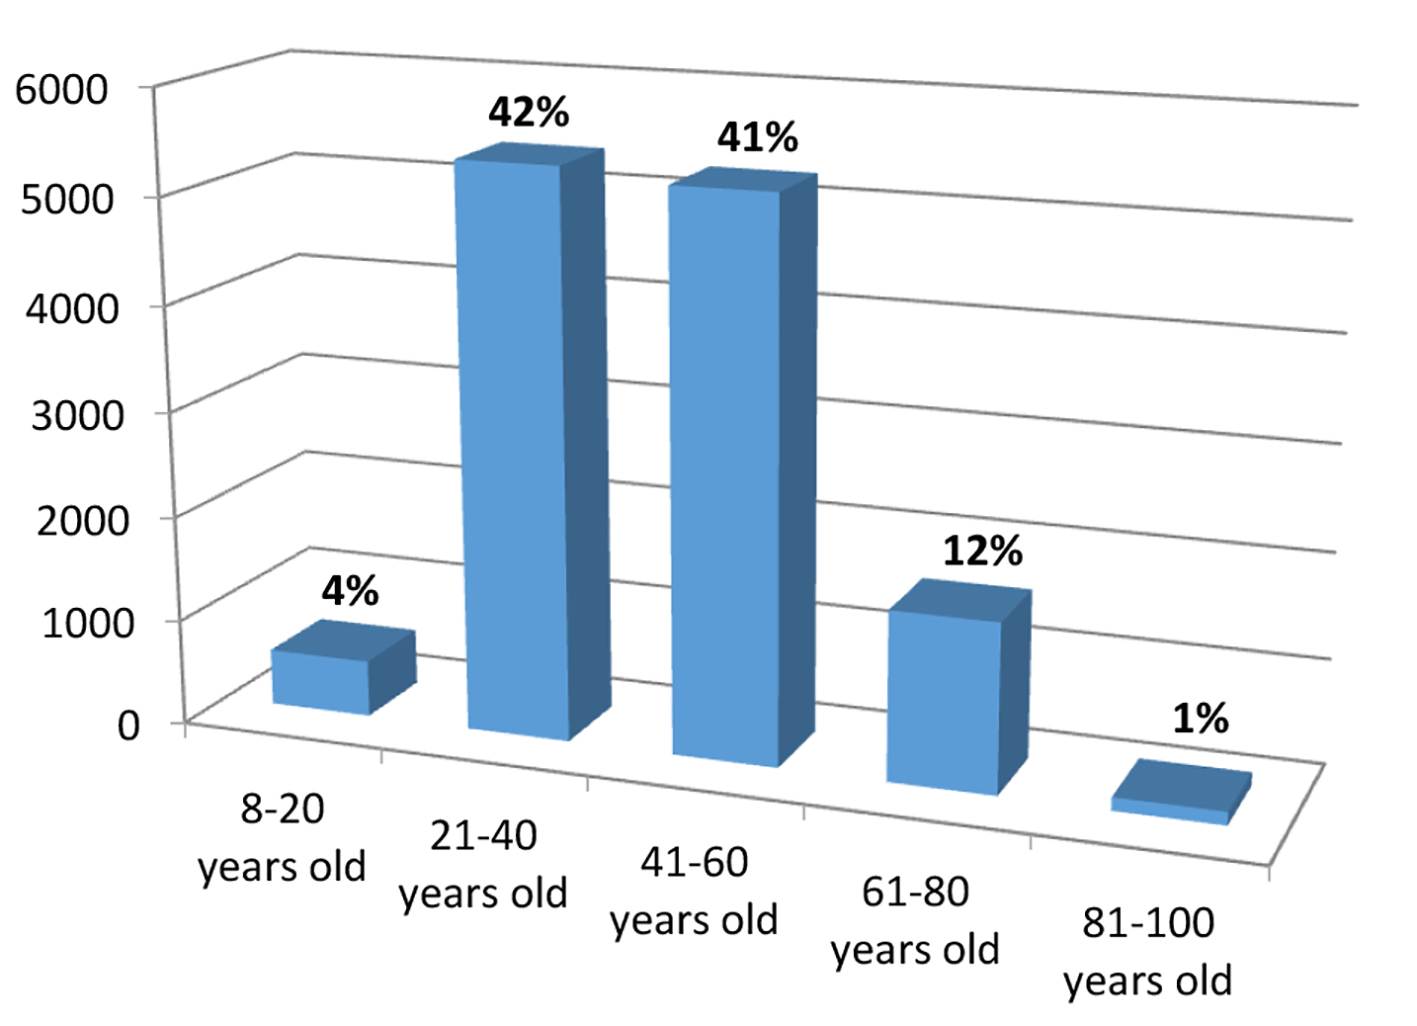
Figure 1. Age group of patients with positive H. pylori infection.
| Gastroenterology Research, ISSN 1918-2805 print, 1918-2813 online, Open Access |
| Article copyright, the authors; Journal compilation copyright, Gastroenterol Res and Elmer Press Inc |
| Journal website http://www.gastrores.org |
Original Article
Volume 10, Number 1, February 2017, pages 33-41
Prevalence of Helicobacter pylori Infection in Samples of Gastric Biopsies
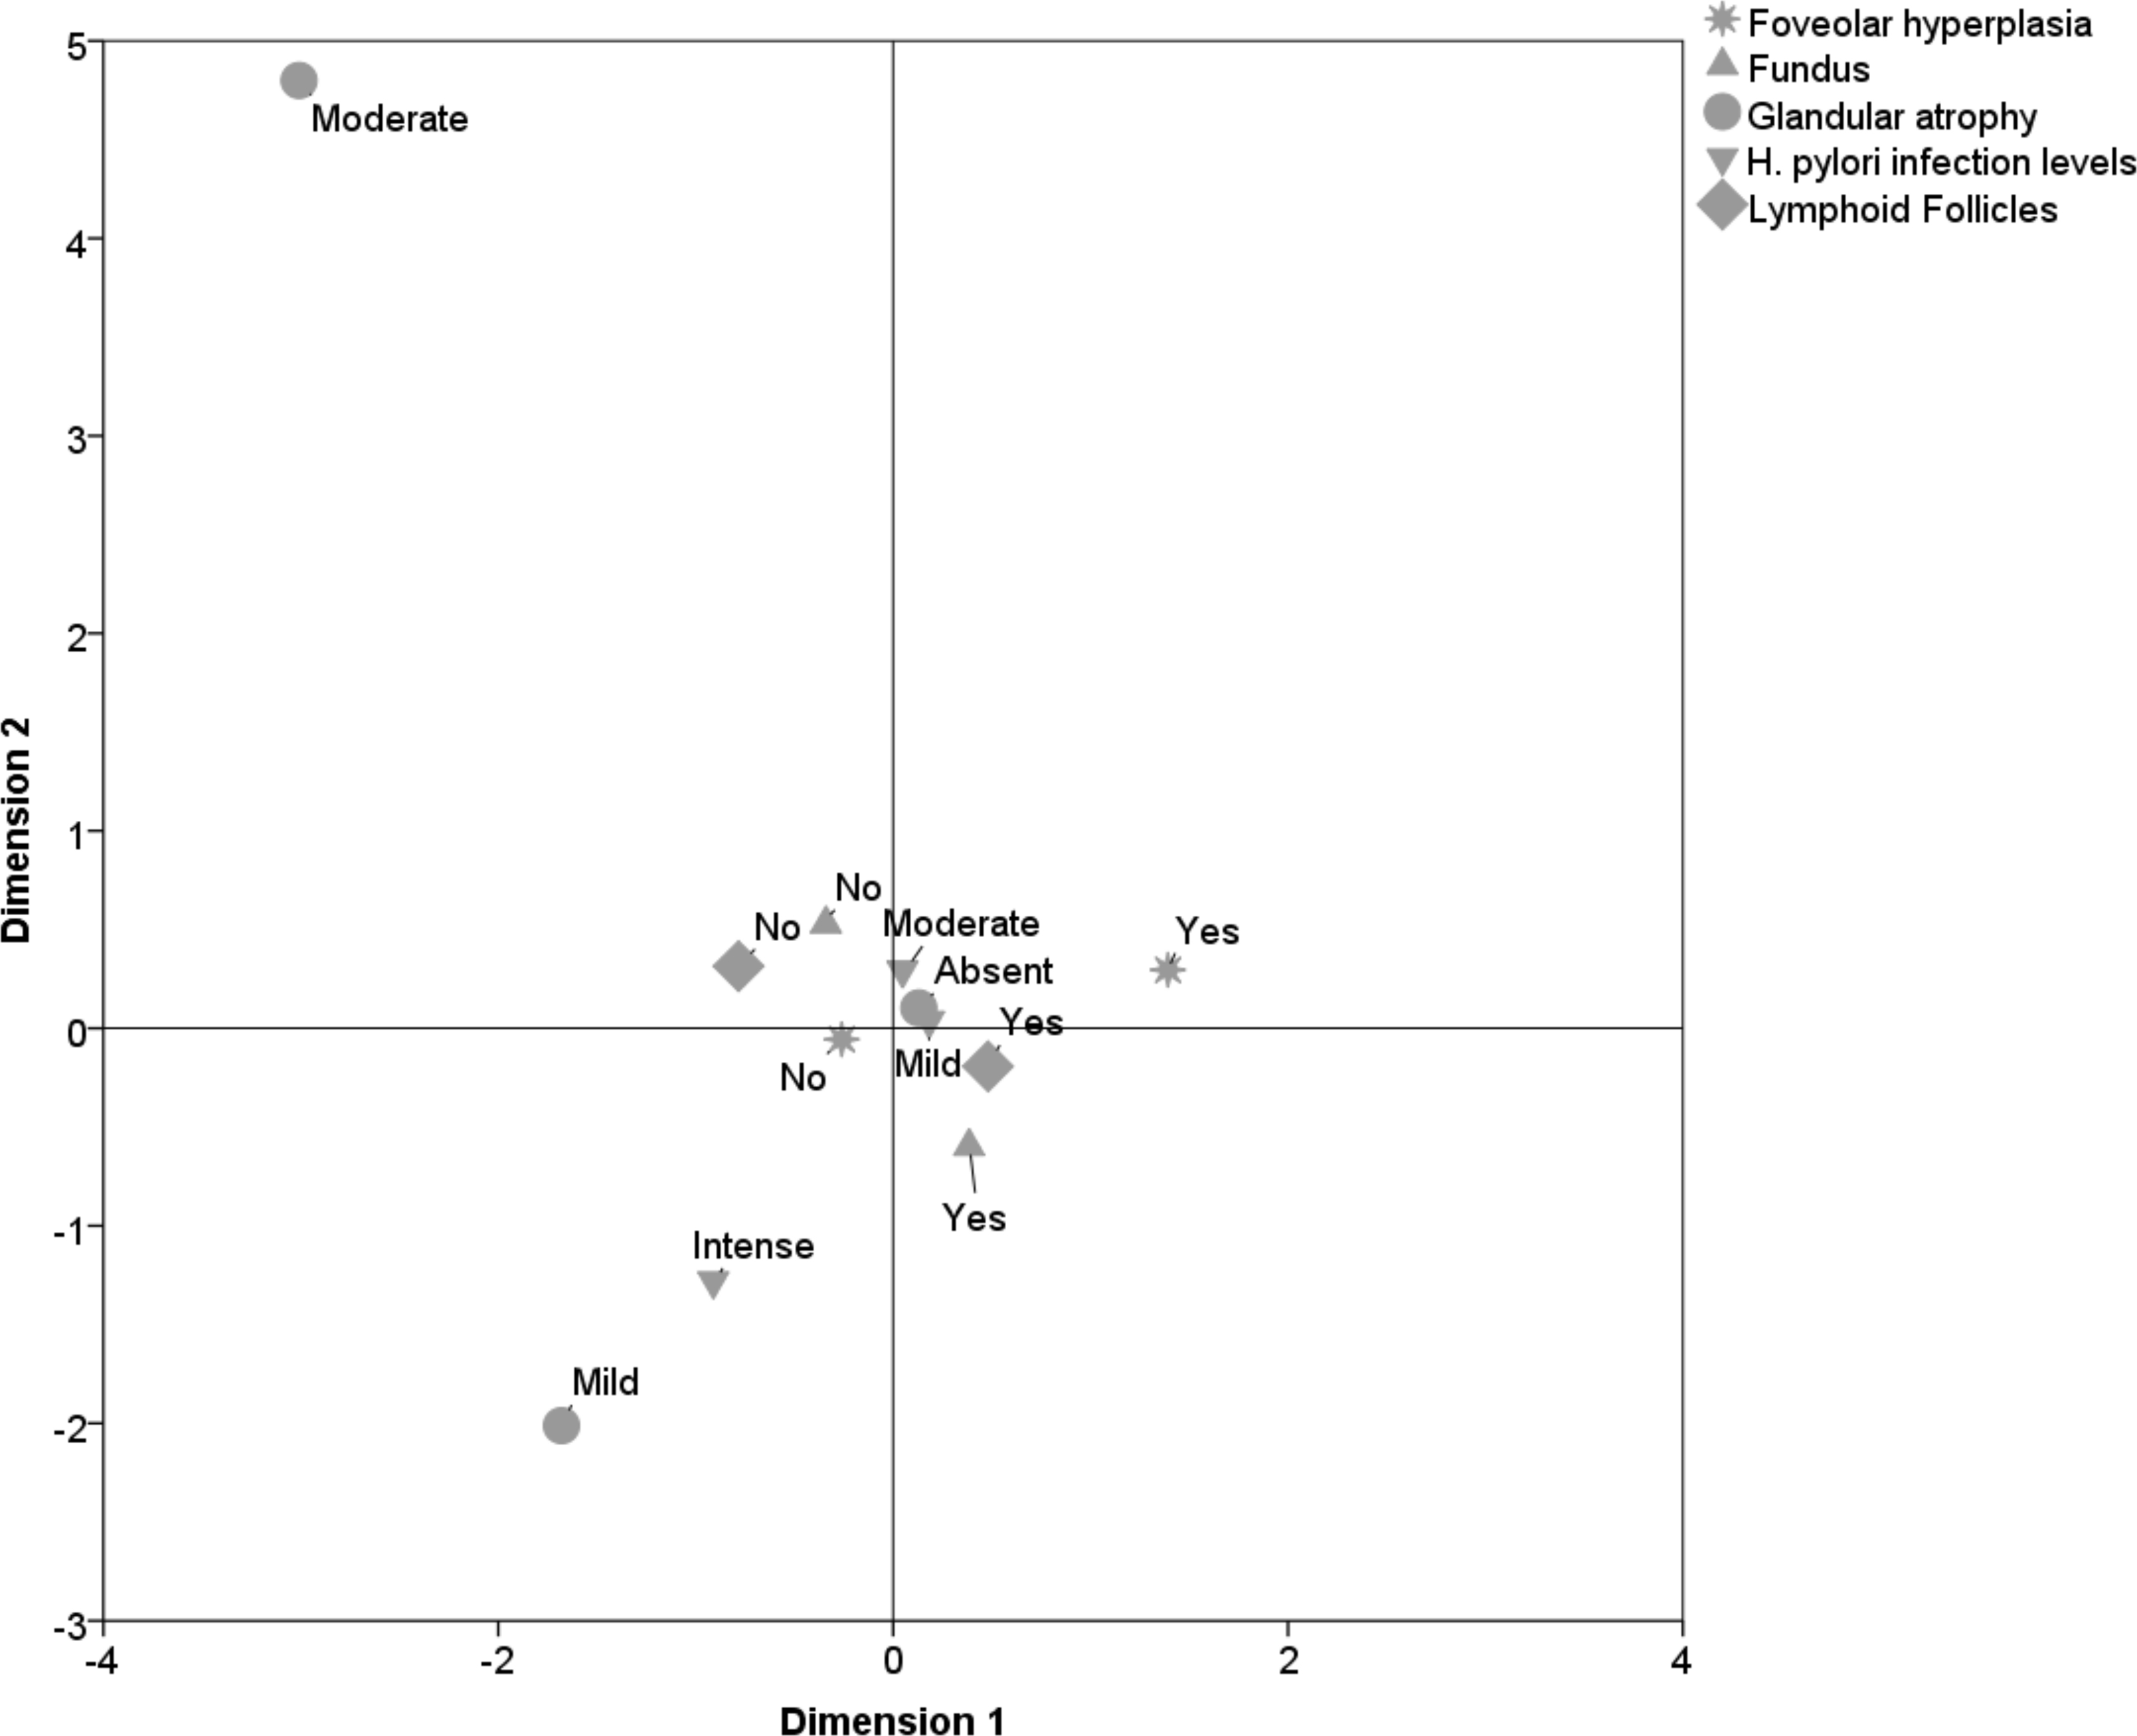
Figures
Tables
| N | % | |
|---|---|---|
| Mucosa type | ||
| Antrum | 12,322 | 95.5 |
| Fundus | 6,058 | 46.9 |
| Antrum and fundus | 5,504 | 42.6 |
| Cardia | 3 | 0.02 |
| Body | 62 | 0.5 |
| Antral-fundic transition | 75 | 0.6 |
| H. pylori infection levels | ||
| Mild | 5,857 | 45.4 |
| Moderate | 5,587 | 43.3 |
| Severe | 1,465 | 11.3 |
| N | % | |
|---|---|---|
| Glandular atrophy | ||
| Absent | 12,033 | 93.23 |
| Mild | 793 | 6.14 |
| Moderate | 75 | 0.58 |
| Severe | 5 | 0.04 |
| Metaplasia classification | ||
| Absent | 11,548 | 89.5 |
| Focal | 939 | 7.3 |
| Multifocal | 310 | 2.4 |
| Diffuse | 112 | 0.9 |
| Evidence of ulcerated injury | 538 | 4.2 |
| Fibrinoleukocytic crust | 289 | 2.2 |
| Foveolar hyperplasia | 2,033 | 15.7 |
| Lymphoid follicles | 8,001 | 62 |
| Granulomas | 23 | 0.2 |
| Antral | Fundus | Cardia | Body | Antral-fundic transition | ||||||
|---|---|---|---|---|---|---|---|---|---|---|
| N | % | N | % | N | % | N | % | N | % | |
| Chronic inflammation | ||||||||||
| Absent | 5 | 0.04 | 91 | 1.5 | 0 | 0 | 1 | 1.6 | 0 | 0 |
| Mild | 1,599 | 12.97 | 1,324 | 21.9 | 0 | 0 | 20 | 31.7 | 2 | 2.7 |
| Moderate | 8,335 | 67.64 | 3,875 | 64 | 2 | 66.7 | 41 | 65.1 | 56 | 74.7 |
| Severe | 2,383 | 19.33 | 768 | 12.7 | 1 | 33.3 | 1 | 1.6 | 17 | 22.7 |
| Inflammatory activity | ||||||||||
| Absent | 506 | 4.1 | 514 | 8.5 | 0 | 0 | 6 | 9.7 | 7 | 9.3 |
| Mild | 4,934 | 40 | 2,495 | 41.2 | 1 | 33.3 | 25 | 40.3 | 31 | 41.3 |
| Moderate | 6,024 | 48.9 | 2,809 | 46.3 | 1 | 33.3 | 30 | 48.4 | 32 | 42.7 |
| Severe | 858 | 7.0 | 240 | 4 | 1 | 33.3 | 1 | 1.6 | 5 | 6.7 |
| Antral | Others regions | X2 (P-value) | |||
|---|---|---|---|---|---|
| N | % | N | % | ||
| X2: Chi-square test. *Linear association. | |||||
| Glandular atrophy | |||||
| Absent | 11,453 | 92.97 | 580 | 98.8 | 25.8 (< 0.001)* |
| Mild | 788 | 6.40 | 5 | 0.9 | |
| Moderate | 73 | 0.59 | 2 | 0.3 | |
| Severe | 5 | 0.04 | 0 | 0 | |
| H. pylori search | |||||
| Mild (+/3+) | 5,539 | 45 | 318 | 54.1 | 27.4 (< 0.001)* |
| Moderate (++/3+) | 5,353 | 43.4 | 234 | 39.9 | |
| Severe (+++/3) | 1,430 | 11.6 | 35 | 6 | |
| Metaplastic classification | |||||
| Absent | 10,975 | 89.1 | 573 | 97,6 | 43.5 (< 0.001) |
| Focal | 111 | 0.9 | 1 | 0.2 | |
| Multifocal | 928 | 7.5 | 11 | 1.9 | |
| Diffuse | 308 | 2.5 | 2 | 0.3 | |
| Evidence of ulcerated injury | 528 | 4.3 | 10 | 1.7 | 9.3 (0.002) |
| Fibrinoleucocytic crust | 279 | 2.3 | 10 | 1.7 | 0.80 (0.370) |
| Foveolar hyperplasia | 1,997 | 16.2 | 36 | 6.1 | 42.8 (< 0.001) |
| Lymphoid follicles | 7,780 | 63.1 | 221 | 37.6 | 154 (< 0.001) |
| Granulomas | 22 | 0.02 | 1 | 0.02 | 0.002 (0.963) |
| Fundus | Other regions | X2 (P-value) | |||
|---|---|---|---|---|---|
| N | % | N | % | ||
| X2: Chi-square test. *Linear association. | |||||
| Glandular atrophy | |||||
| Absent | 5,688 | 93.92 | 6,345 | 92.63 | 9.6 (0.002)* |
| Mild | 339 | 5.60 | 454 | 6.63 | |
| Moderate | 27 | 0.45 | 48 | 0.7 | |
| Severe | 2 | 0.03 | 3 | 0.04 | |
| H. pylori infection levels | |||||
| Mild (+/3+) | 2,807 | 46.3 | 3,050 | 44.5 | 5.6 (0.018)* |
| Moderate (++/3+) | 2,595 | 42.8 | 2,992 | 43.7 | |
| Severe (+++/3+) | 656 | 10.8 | 809 | 11.8 | |
| Metaplastic classification | |||||
| Absent | 5,451 | 90 | 6,097 | 89 | 5.7 (0.127) |
| Focal | 55 | 0.9 | 57 | 0.8 | |
| Multifocal | 424 | 7 | 515 | 7.5 | |
| Diffuse | 128 | 2.1 | 182 | 2.7 | |
| Evidence of ulcerated injury | 257 | 4.2 | 281 | 4.1 | 0.16 (0.690) |
| Fibrinoleucocytic crust | 97 | 1.6 | 192 | 2.8 | 21.2 (< 0.001) |
| Foveolar hyperplasia | 1,015 | 16.8 | 1,018 | 14.5 | 8.7 (0.003) |
| Lymphoid follicles | 3,984 | 65.8 | 4,017 | 58.6 | 69.3 (< 0.001) |
| Granulomas | 15 | 0.2 | 8 | 0.1 | 3.09 (0.079) |