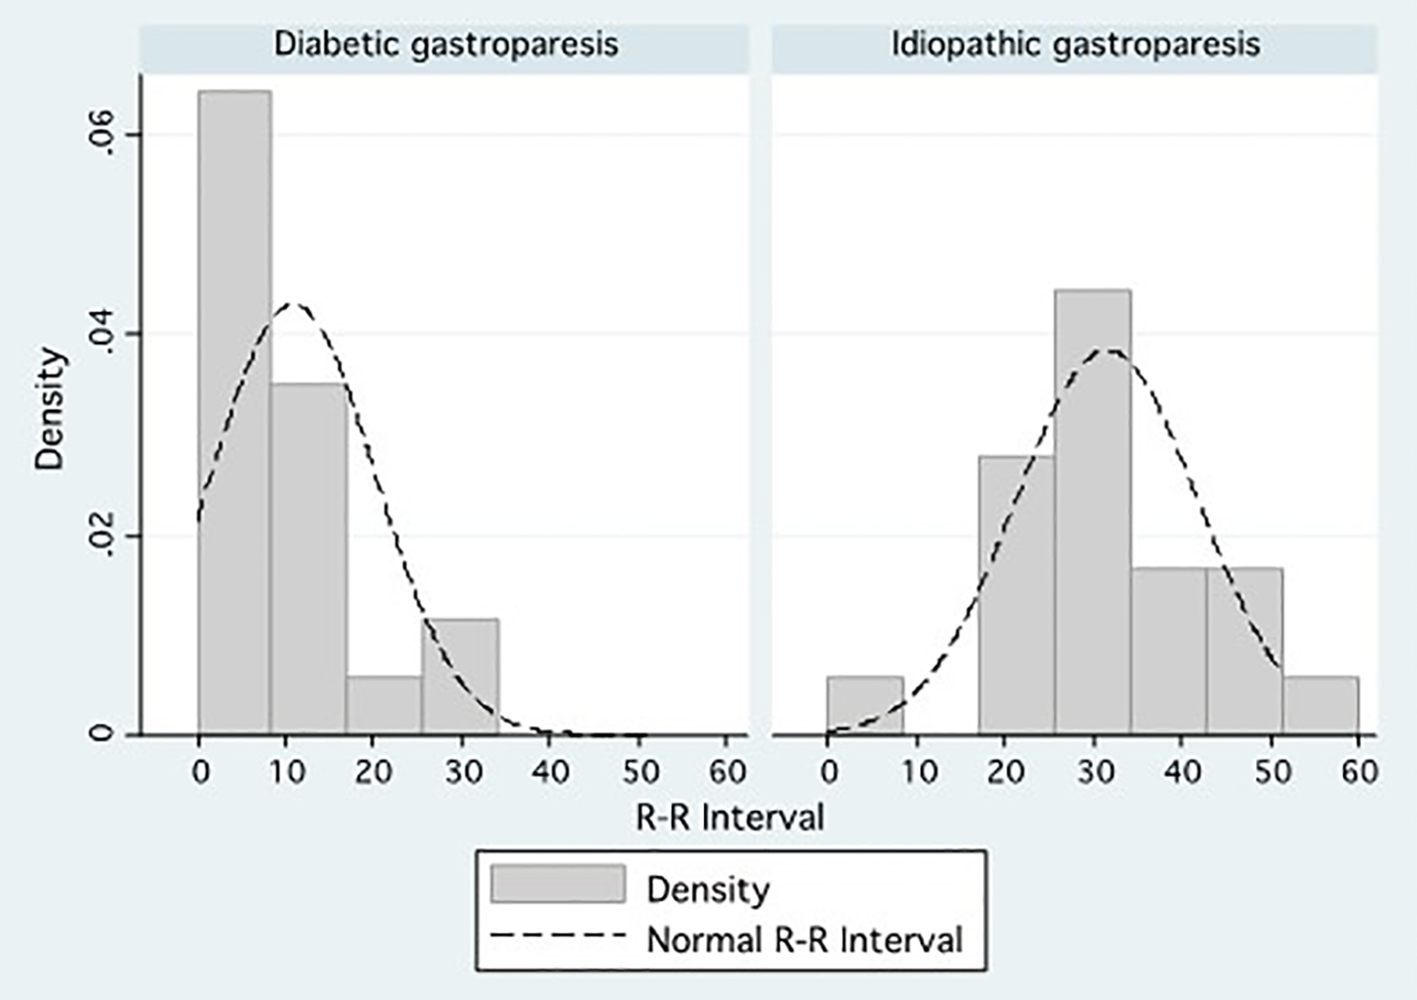
Figure 1. Density distributions comparing the percentage R-R interval variation between patients with diabetic gastroparesis and patients with idiopathic gastroparesis.
| Gastroenterology Research, ISSN 1918-2805 print, 1918-2813 online, Open Access |
| Article copyright, the authors; Journal compilation copyright, Gastroenterol Res and Elmer Press Inc |
| Journal website http://www.gastrores.org |
Original Article
Volume 9, Number 4-5, October 2016, pages 65-69
Measures of Autonomic Dysfunction in Diabetic and Idiopathic Gastroparesis
Figure
Tables
| DG (n = 20) | IG (n = 21) | P-value | |
|---|---|---|---|
| P < 0.05 considered significant. IQR: interquartile range. | |||
| Female sex, n (%) | 14 (70%) | 14 (67%) | 1.000 |
| Age in years, median (IQR) | 42 (33 - 52) | 37 (33 - 42) | 0.108 |
| Race (white), n (%) | 17 (85%) | 18 (86%) | 1.000 |
| Symptoms duration in months, median (IQR) | 15 (12 - 24) | 33 (15 - 60) | 0.030 |
| Percentage vasoconstriction, median (IQR) | 45 (26 - 84) | 84 (69 - 98) | 0.005 |
| Postural adjustment ratio (PAR), median (IQR) | 16 (11 - 27) | 27 (15 - 44) | 0.046 |
| Vasoconstriction and PAR, median (IQR) | 57 (39 - 106) | 111 (92 - 127) | 0.002 |
| R-R interval percentage variation, median (IQR) | 8 (5 - 15) | 33 (23 - 51) | < 0.001 |
| P-value | aOR | 95% CI | |
|---|---|---|---|
| P < 0.05 considered significant. Linear regression model: P = 0.002, R2 = 0.548. | |||
| Age | 0.923 | NS | - |
| Percentage vasoconstriction (VC%) | 0.736 | NS | - |
| Postural adjustment ratio (PAR) | 0.742 | NS | - |
| VC% and PAR | 0.83 | NS | - |
| R-R interval percentage variation | 0.001 | 1.02 | 1.01 - 1.03 |
| Symptoms duration | 0.597 | NS | - |