Figures
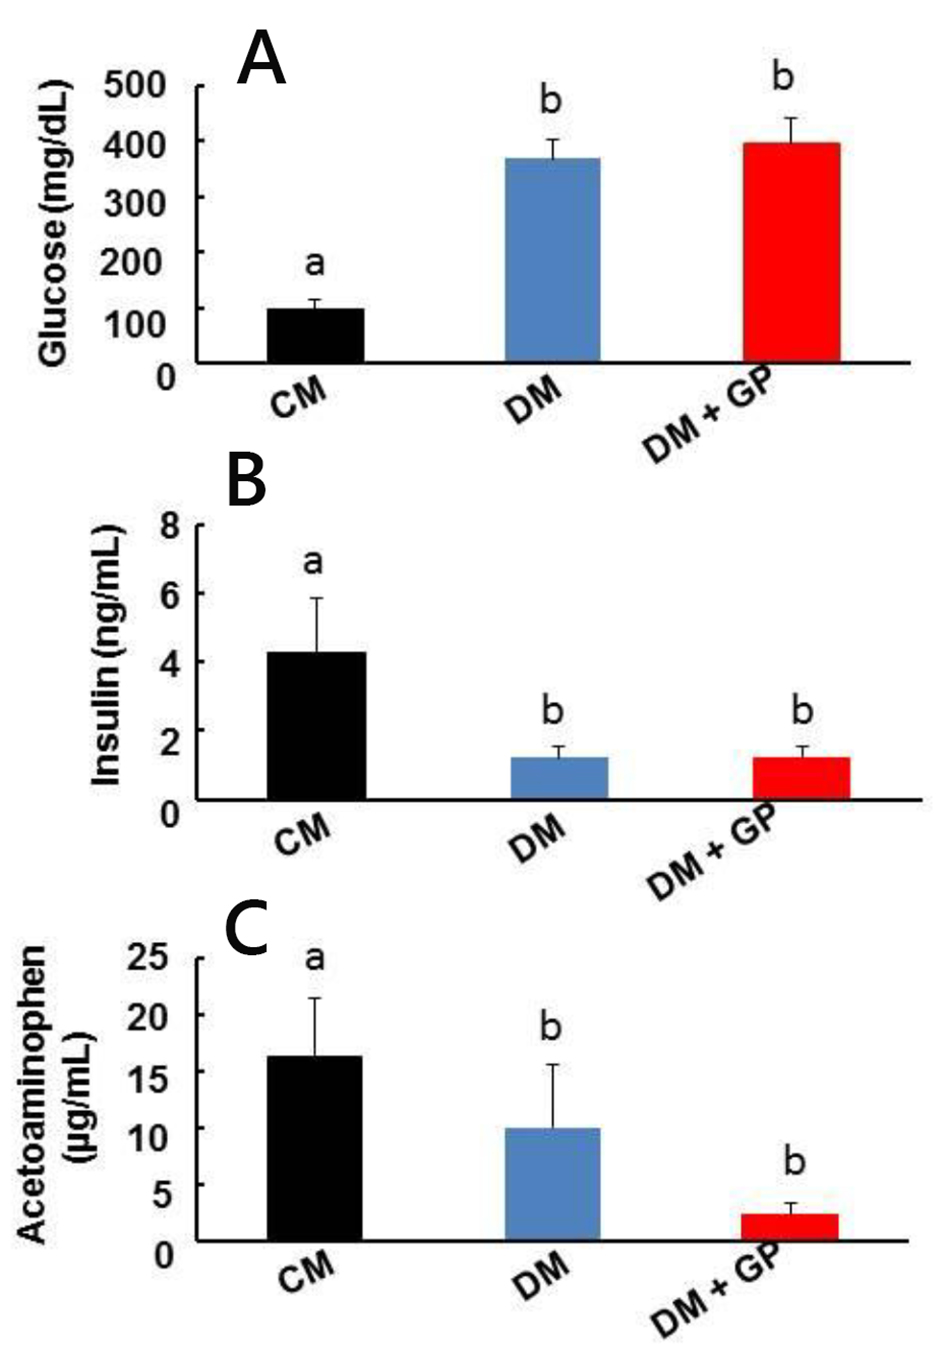
Figure 1. Pathophysiology of healthy, diabetic, and diabetic gastroparetic male rats. CM: age-matched control male rats injected with the same volume of citrate buffer without STZ. DM: male rats developed diabetes following STZ administration. DM + GP: male rats injected with STZ that developed diabetes and gastroparesis. The difference in values is marked as “a” and “b”. Five rats were included in each group. (A) DM + GP rats and DM rats had no significant difference in glucose levels (396.2 ± 45.9 vs. 367.8 ± 33.2 mg/dL). CM: 4.27 ± 1.56. (B) Insulin levels: serum insulin level measured in CM, DM, and DM + GP rats. Both DM and DM + GP rats had reduced insulin levels (1.20 ± 0.34 ng/mL and 1.21 ± 0.31 ng/mL; overall ANOVA, P = 0.0001, respectively) compared to control rats (4.27 ± 1.56 ng/mL). Each column represents the mean ± standard deviation of five rats per group. P ˂ 0.05. (C) The difference between fasting and post-feeding acetaminophen levels is used as the index of gastric emptying. Slower gastric emptying was only detected in DM + GP rats and not in CM and DM (16.16 ± 5.25 µg/mL vs. 2.22 ± 1.05 and 9.96 ± 5.58; overall ANOVA, P = 0.0001).
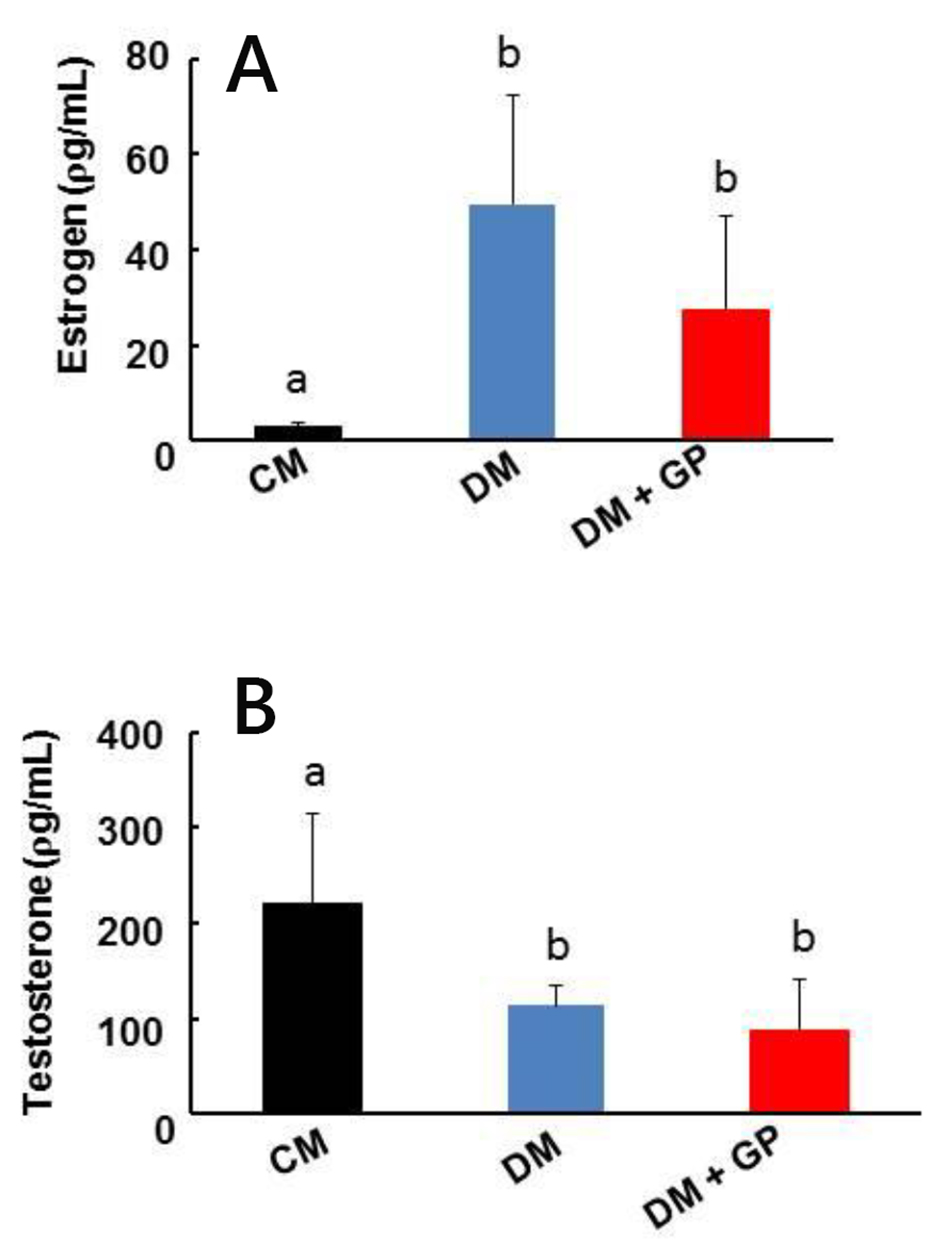
Figure 2. Serum sex hormone level in healthy, diabetic, and diabetes gastroparetic rats. Five rats were included in each group. (A) Estrogen: increases in estrogen (E2) were observed in DM and DM + GP rats (DM: 49.50 ± 22.77 ρg/mL; DM + GP: 27.28 ± 19.59 ρg/mL, respectively; overall ANOVA, P = 0.0004) compared to CM rats (2.94 ± 0.71 ρg/mL). (B) Testosterone: testosterone concentrations were decreased in the DM (113.87 ± 21.80 ρg/mL) and DM + GP rats (88.51 ± 52.69 ρg/mL; overall ANOVA, P = 0.012) and groups compared to the CM group (219.82 ± 95.47 ρg/mL). Each column represents the mean ± standard deviation of five rats per group. The difference in values is marked as “a” and “b”.
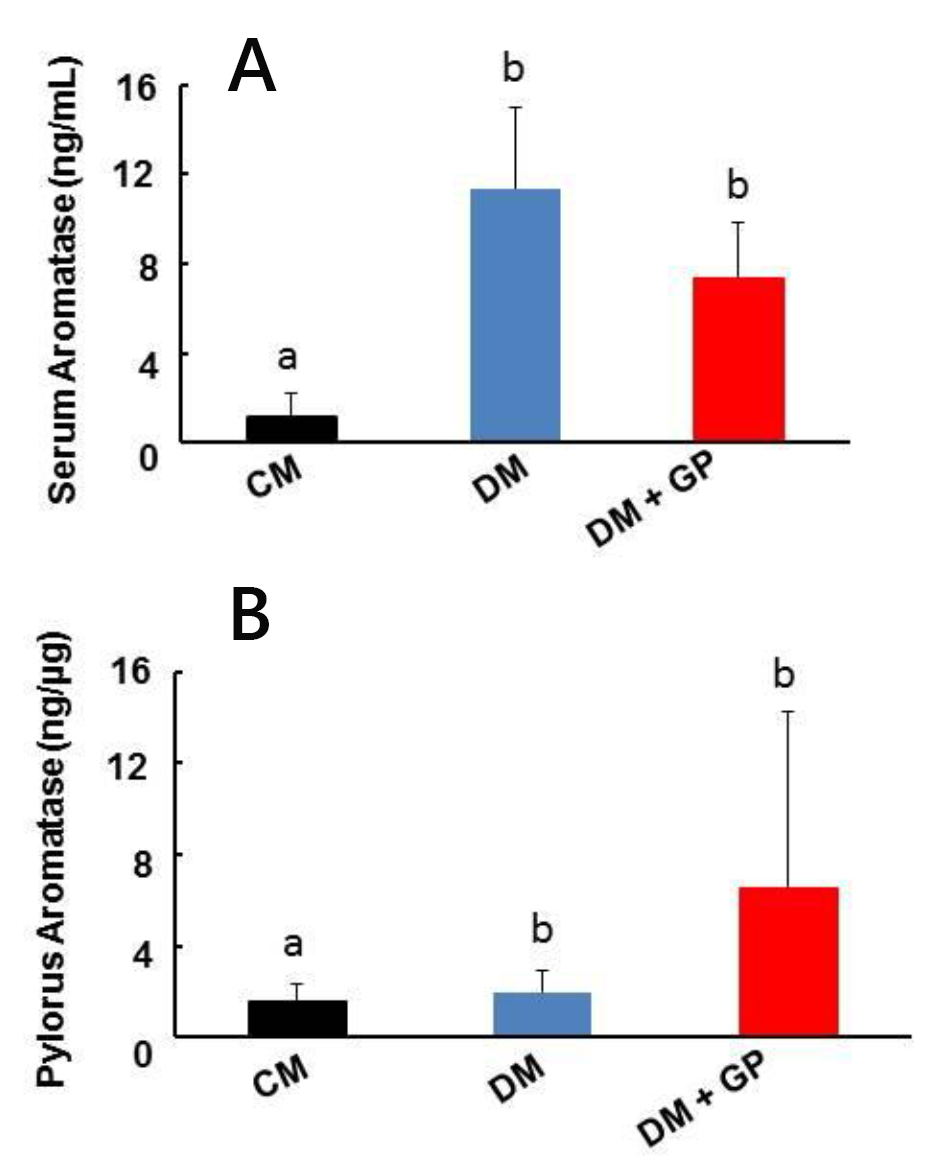
Figure 3. Aromatase levels in control, diabetic, diabetes and gastroparetic rats. Five rats were included in each group. (A) Serum levels of aromatase from DM (11.37 ± 3.65 ng/mL) and DM + GP (7.37 ± 2.44 ng/mL; overall ANOVA, P = 0.003) rats were increased compared to levels in CM rats (1.12 ± 1.11 ng/mL). Each column represents the mean ± standard deviation of five rats per group. (B) Pyloric tissue level of aromatase: compared with CM rats (1.59 ± 0.78 ng/mL), there was no change in tissue aromatase level in both DM (2.00 ± 0.91 ng/mL) and DM + GP rats (6.54 ± 7.74 ng/mL; overall ANOVA, P = 0.144). Each column represents the mean ± standard deviation of five rats per group. The difference in values is marked as “a” and “b”.
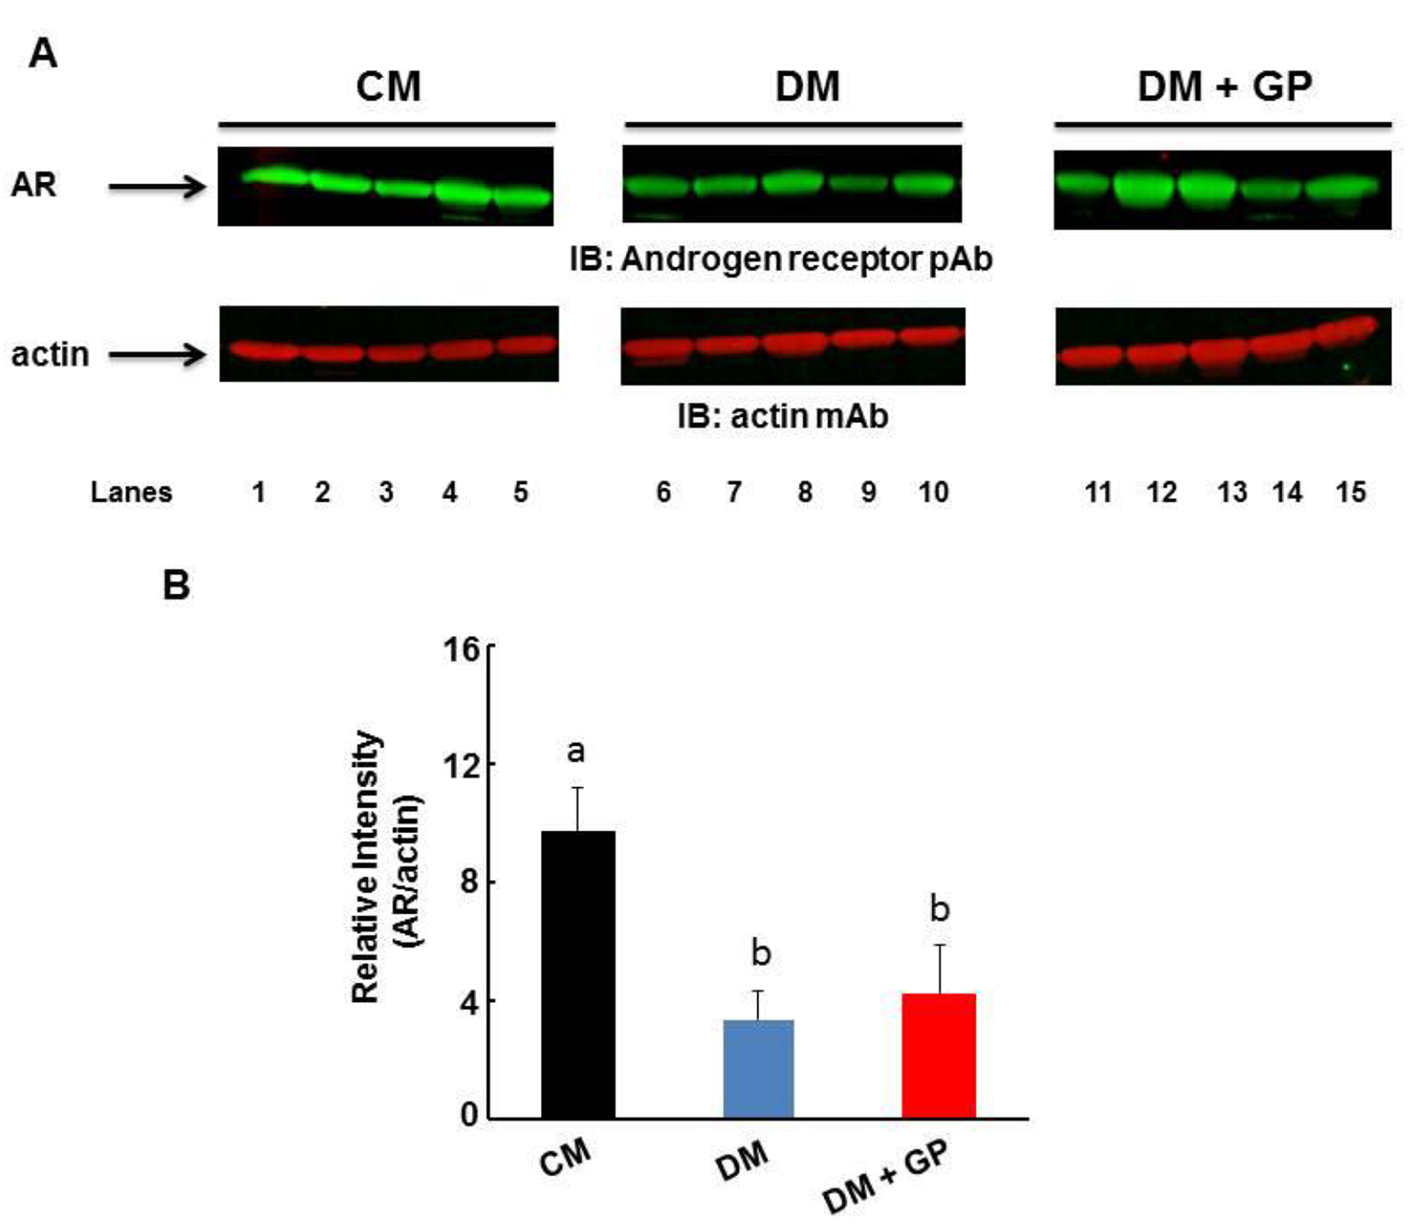
Figure 4. Expression of AR in the gastric pylorus. Five rats were included in each group. (A) Representative immunoblot showing the level of AR (upper panel) and actin (lower panel). (B) The level of AR was normalized to that of actin by densitometric analysis and expressed as arbitrary units. The relative intensity of the AR protein was shown to be decreased in both DM (3.37 ± 0.95) and DM + GP (4.2 ± 1.66) compared to CM (9.67 ± 1.52; overall ANOVA, P = 0.00002; P ˂ 0.05). Data are expressed as the mean ± standard deviation of five animals per group. The difference in values is marked as “a” and “b”.
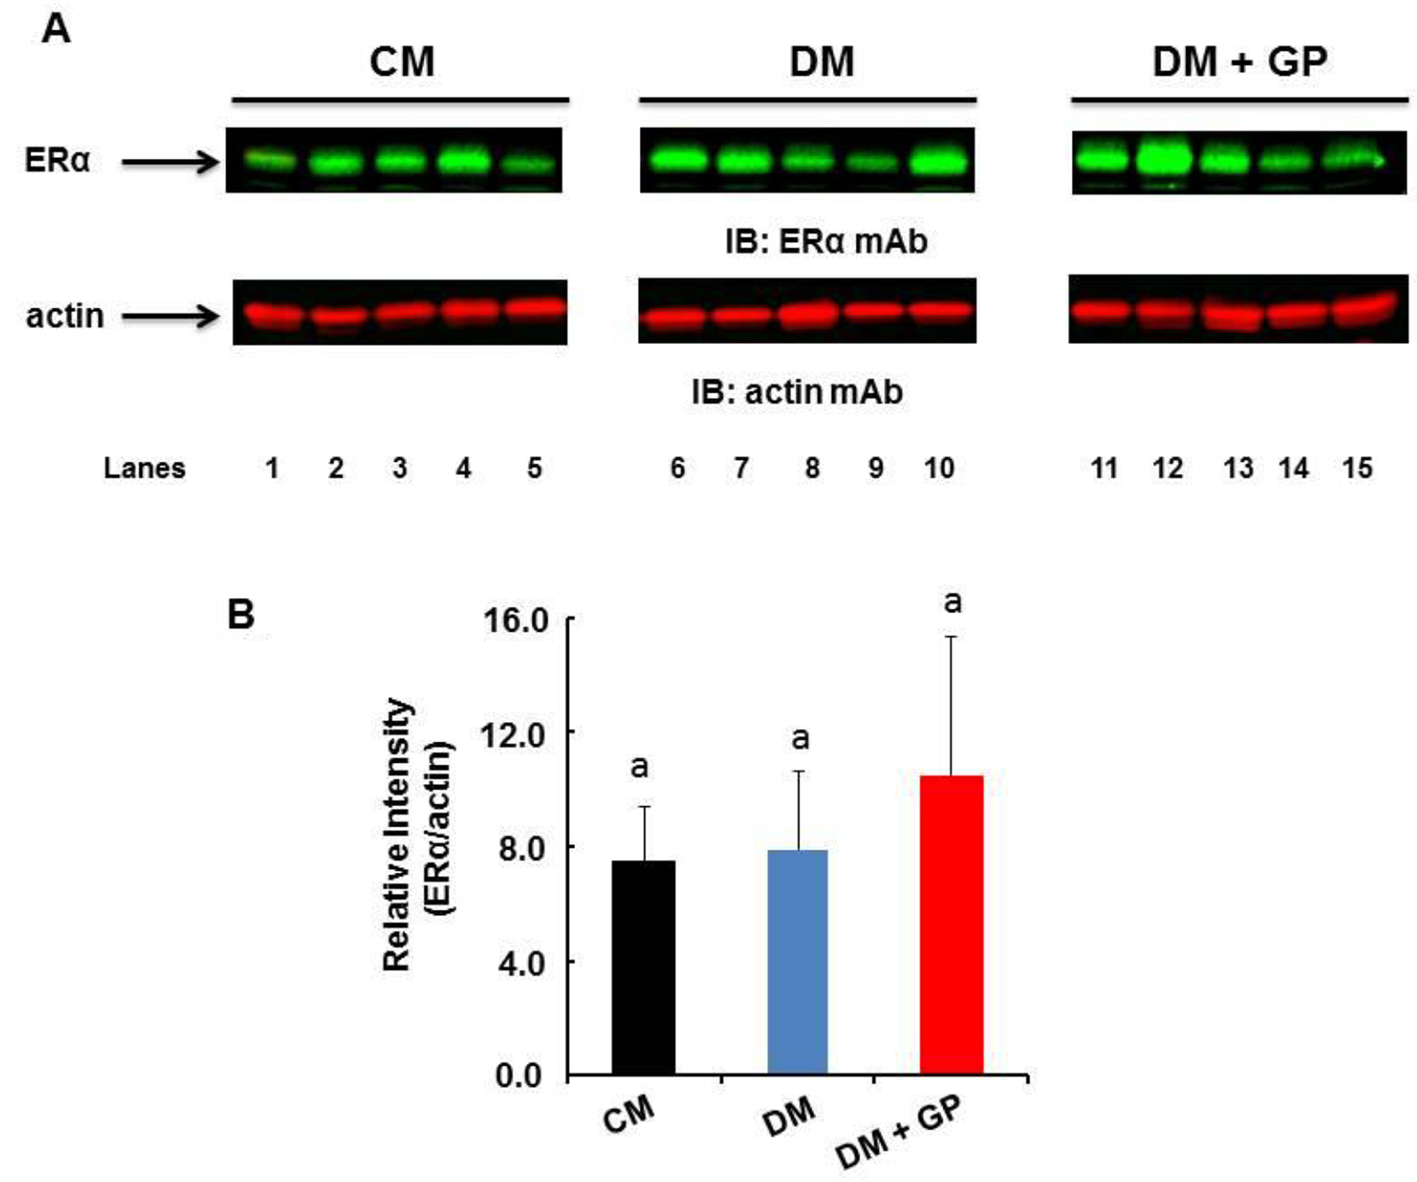
Figure 5. Expression of ERα in the gastric pylorus. Five rats were included in each group. (A) Representative immunoblot showing the level of ERα (upper panel) and actin (lower panel) in the pylorus. (B) The level of ERα was normalized to that of actin by densitometric analysis and expressed as arbitrary units. The values are expressed as arbitrary units (DM + GP rats 8.90 ± 6.61 vs. DM 5.82 ± 3.1 and CM 5.68 ± 2.16; overall ANOVA, P = 0.45). Data are expressed as the mean ± standard deviation of five animals per group. The difference in values is marked as “a” and “b”.
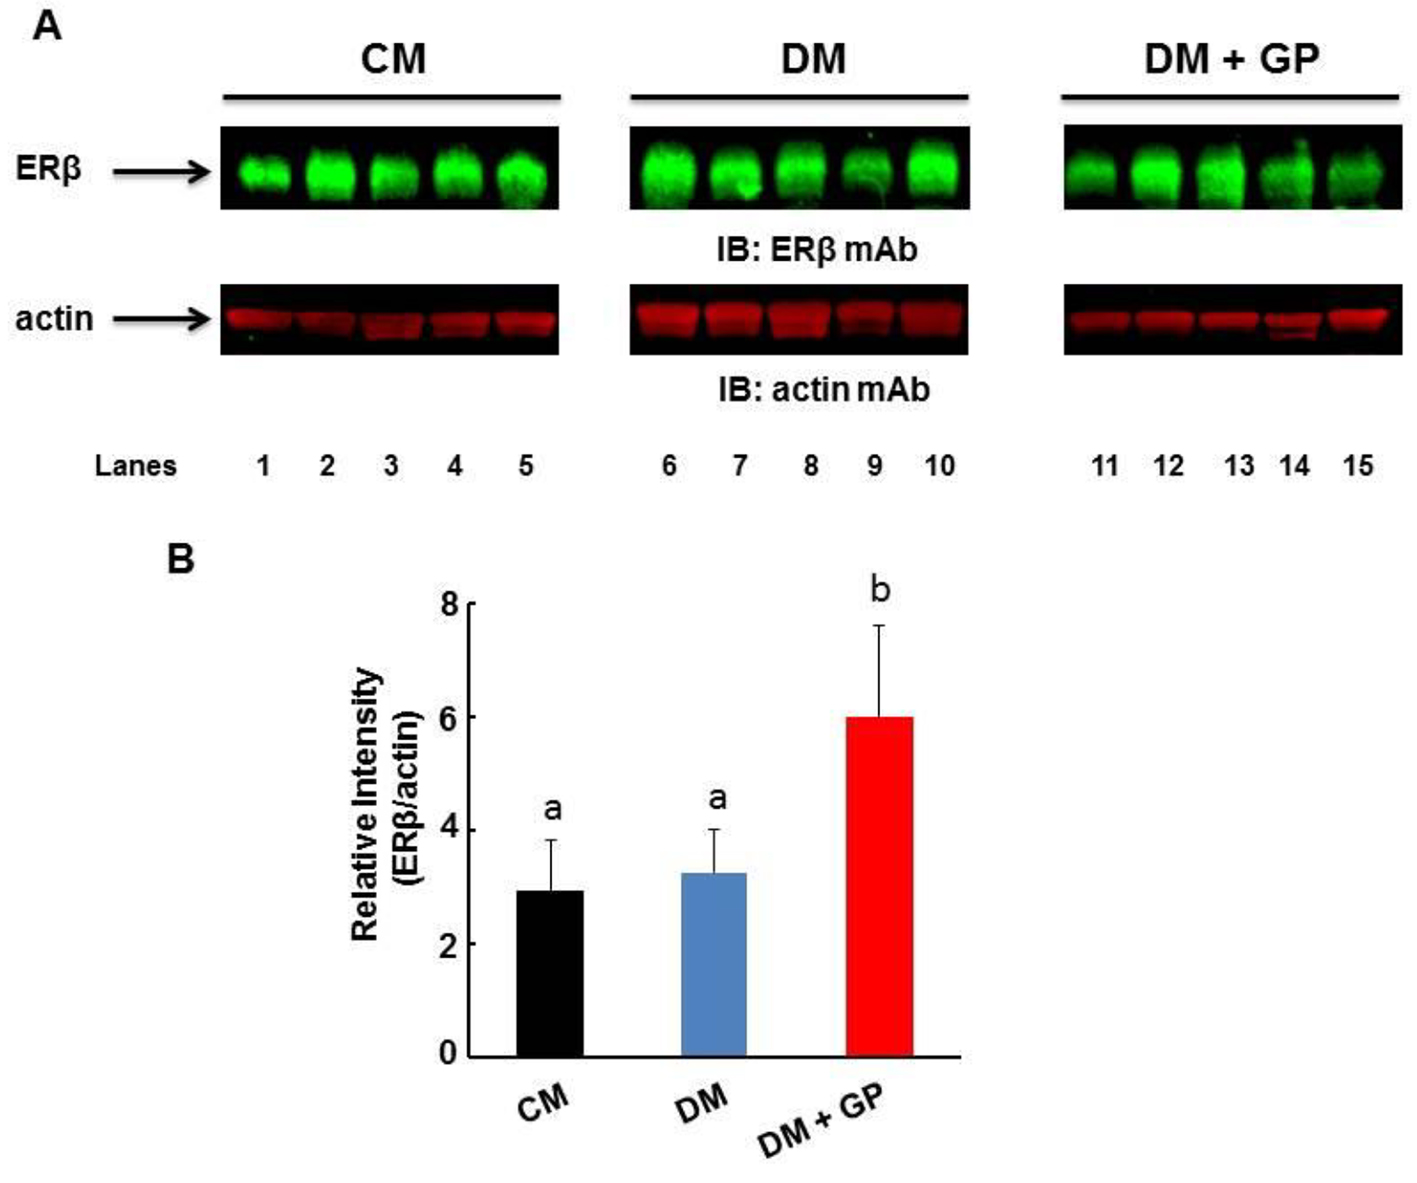
Figure 6. Expression of ERβ in the gastric pylorus. Five rats were included in each group. (A) Representative immunoblot showing the level of ERβ (upper panel) and actin (lower panel) in the pylorus. (B) The level of ERβ was normalized to that of actin by densitometric analysis and expressed as arbitrary units. The values are expressed as arbitrary units (DM + GP rats 5.49 ± 2.16 vs. DM 3.25 ± 2.77 and CM 2.9 ± 0.91; overall ANOVA, P = 0.028). Data are expressed as the mean ± standard deviation of five animals per group. The difference in values ise marked as “a” and “b”.