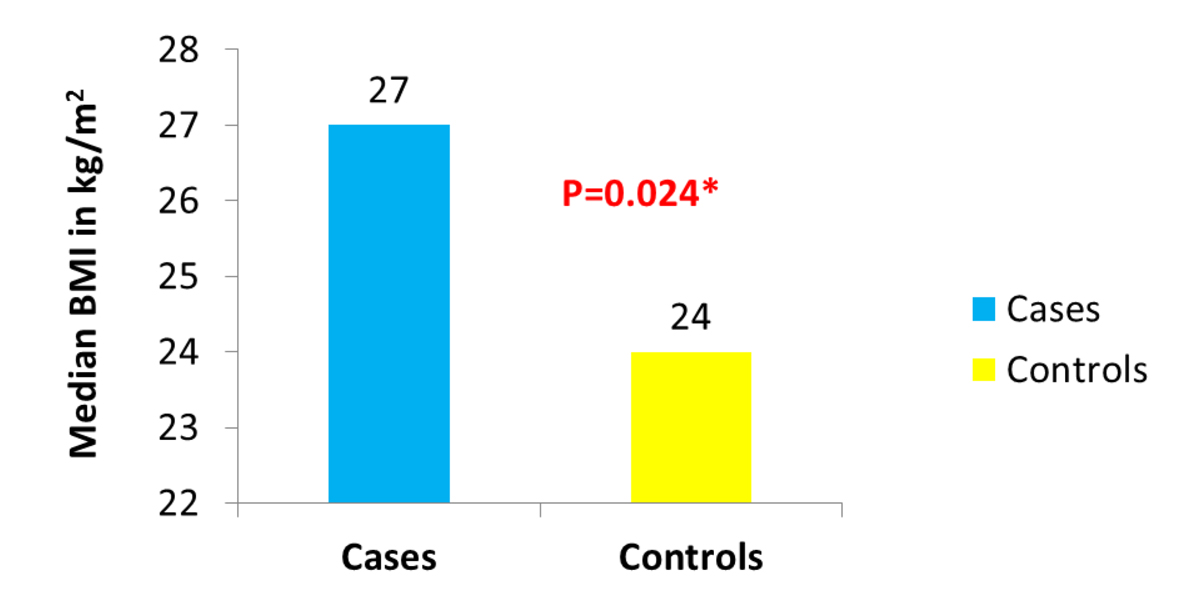
Figure 1. Distribution of BMI in cases vs. controls.
| Gastroenterology Research, ISSN 1918-2805 print, 1918-2813 online, Open Access |
| Article copyright, the authors; Journal compilation copyright, Gastroenterol Res and Elmer Press Inc |
| Journal website http://www.gastrores.org |
Original Article
Volume 7, Number 5-6, December 2014, pages 111-117
Body Mass Index Is Associated With Mucosal Disease in Crohn’s: Results of a Case-Control Study
Figures
Tables
| Characteristic | Cases (N = 36) | Controls (N = 68) |
|---|---|---|
| BMI, median (range) | 27 (19 - 44) | 24 (19 - 46) |
| Obese | 12 (33%) | 12 (18%) |
| Age, median (range) | 37 (20 - 79) | 35 (19 - 72) |
| Duration of disease, median (range) | 5 (1 - 37) | 7 (1 - 36) |
| Duration of observation, median (range) | 1 (1 - 4) | 2 (1 - 4) |
| Caucasian/African American | 18/18 (50%/50%) | 26/42 (38%/62%) |
| Men/women | 15/21 (42%/58%) | 25/43 (37%/63%) |
| Age at diagnosis, median (range) | 27 (10 - 75) | 25 (11 - 68) |
| Perianal disease | 12 (33%) | 24 (35%) |
| Tobacco consumption | 9 (25%) | 13 (19%) |
| Steroid use | 16 (44%) | 20 (29%) |
| FH AID | 6 (17%) | 12 (18%) |
| FH cancer | 10 (29%) | 13 (20%) |
| FH CRC | 3 (5%) (N = 35) | 4 (11%) (N = 66) |
| FH IBD | 5 (14%) | 7 (10%) |
| AZA/6-MP use | 19 (53%) | 35 (51%) |
| Biologic use | 25 (69%) | 50 (73%) |
| Methotrexate use | 6 (17%) | 8 (12%) |
| Diabetes mellitus | 4 (11%) | 5 (7%) |
| EIM | 18 (50%) | 23 (34%) |
| Covariate | Cases (N = 36) | Controls (N = 68) | P value |
|---|---|---|---|
| BMI, median (range) | 27 (19 - 44) | 24 (19 - 46) | 0.024 |
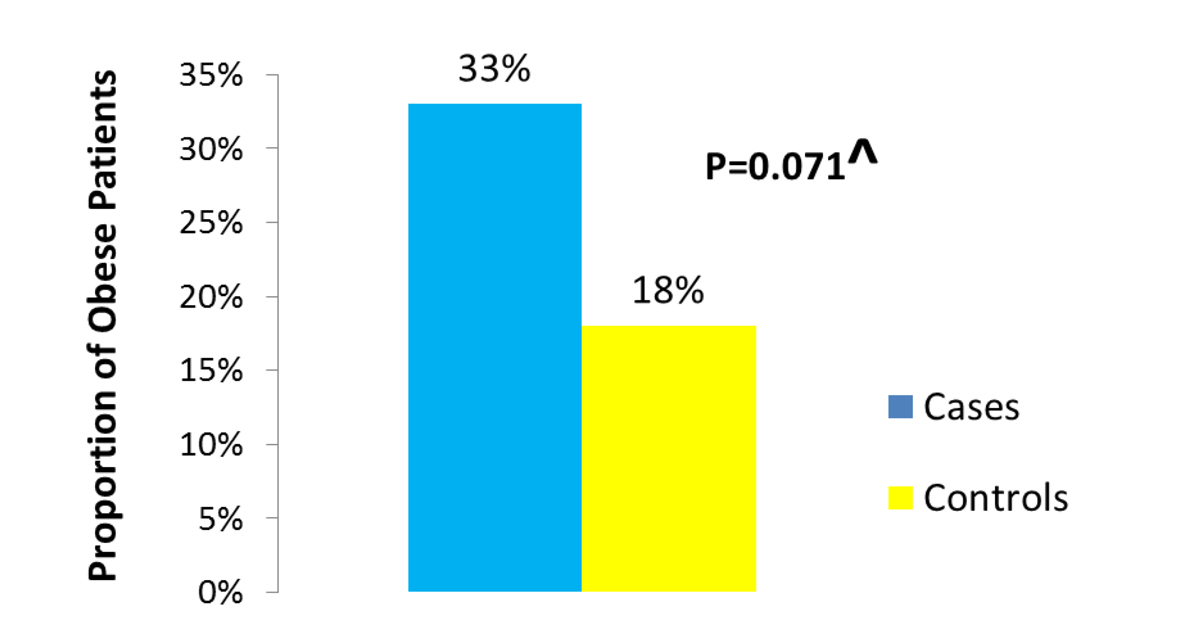
| Obese | 12 (33%) | 12 (18%) | 0.0709 |
| Age, median (range) | 37 (20 - 79) | 35 (19 - 72) | 0.413 |
| Duration of disease, median (range) | 5 (1 - 37) | 7 (1 - 36) | 0.1742 |
| Duration of observation, median (range) | 1 (1 - 4) | 2 (1 - 4) | 0.69 |
| Caucasian/African American | 18/18 (50%/50%) | 26/42 (38%/62%) | 0.249 |
| Men/women | 15/21 (42%/58%) | 25/43 (37%/63%) | 0.625 |
| Effect | Point estimate | 95% CI | P value |
|---|---|---|---|
| *Adjusted for age, sex, race, duration of disease and observation. | |||
| Obese vs. non-obese | 2.716 | 1.004 - 7.349 | 0.0492 |
| Age now | 0.994 | 0.962 - 1.027 | 0.7065 |
| Sex | 1.567 | 0.627 - 3.913 | 0.3361 |
| Race | 1.748 | 0.725 - 4.215 | 0.2135 |
| Duration of observation | 0.824 | 0.505 - 1.325 | 0.4395 |
| Duration of disease | 0.995 | 0.941 - 1.052 | 0.8604 |
| Effect | Point estimate | 95% CI | P value |
|---|---|---|---|
| *Adjusted for age, sex, race, duration of disease and observation. | |||
| BMI | 1.09 | 1.019 - 1.166 | 0.0122 |
| Age | 0.992 | 0.959 - 1.025 | 0.6206 |
| Sex | 1.371 | 0.556 - 3.381 | 0.4933 |
| Race | 1.567 | 0.646 - 3.798 | 0.3206 |
| Duration of observation | 0.787 | 0.477 - 1.298 | 0.3486 |
| Duration of disease | 1.001 | 0.945 - 1.059 | 0.9828 |