Figures
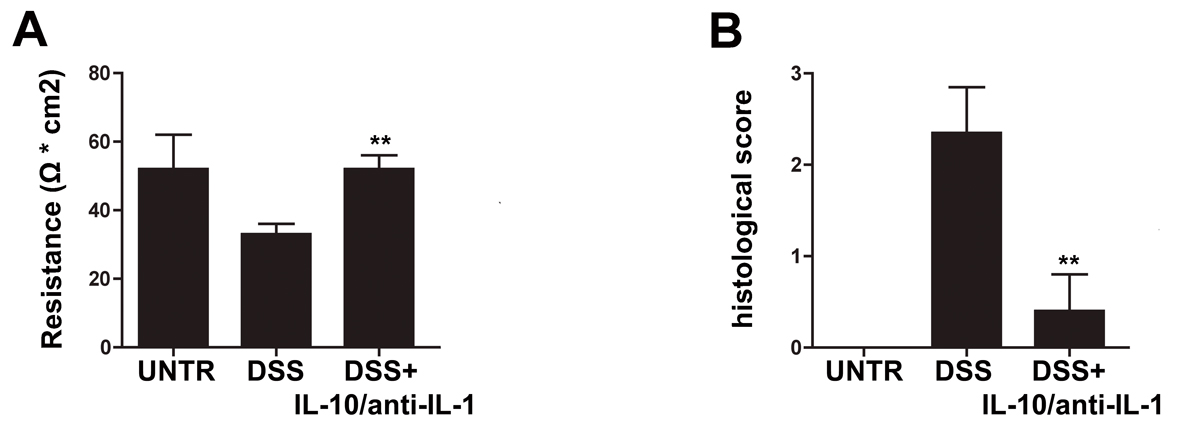
Figure 1. Protective effects of interleukin-10/anti-IL-1 mix in chemical-induced chronic colitis. (A) Evaluation of colon resistance (expressed as Ω * cm2) by Ussing chamber analysis in different treatment groups. UNTR (untreated, hydroalcoholic solution only); DSS (DSS 2% plus hydroalcoholic solution); DSS + IL-10/anti-IL-1 (DSS 2% + interleukin-10 IL-10 plus anti-IL-1 antibody). The graph represents mean values ± S.D. (n = 10) Statistical analysis: DSS + IL-10/anti-IL-1 vs. DSS ** P = 0.0028. (B) Evaluation of the histologic score in different treatment groups. UNTR (untreated, hydroalcoholic solution only); DSS (DSS 2% plus hydroalcoholic solution); DSS + IL-10/anti-IL-1 (DSS 2% + interleukin-10 plus anti-IL-1 antibody). The graph represents mean values ± S.D. (n = 10) Statistical analysis: DSS + IL-10/anti-IL-1 vs. DSS ** P = 0.0062.
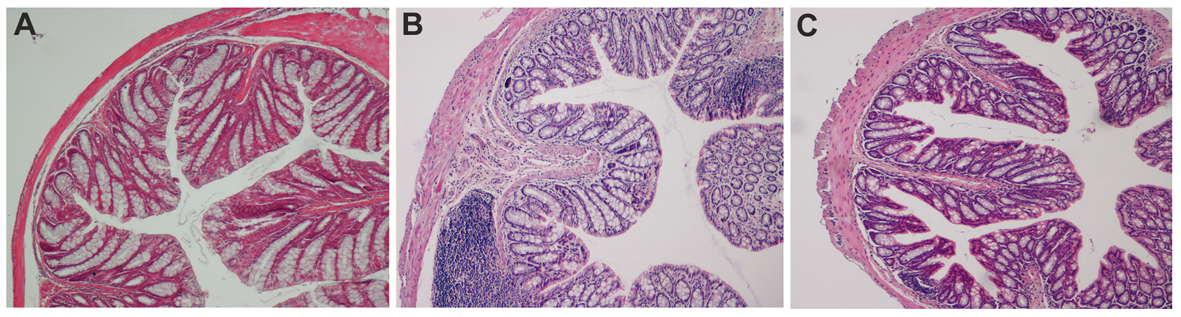
Figure 2. Ematoxilin-Eosin staining of colon sections in chemical-induced chronic colitis. A: histological analysis of paraffin embedded colon sections. UNTR (untreated, hydroalcoholic solution only); B: DSS (DSS 2% plus hydroalcoholic solution); C: DSS + IL-10/anti-IL-1 (DSS 2% + interleukin-10 plus anti-IL-1 antibody).
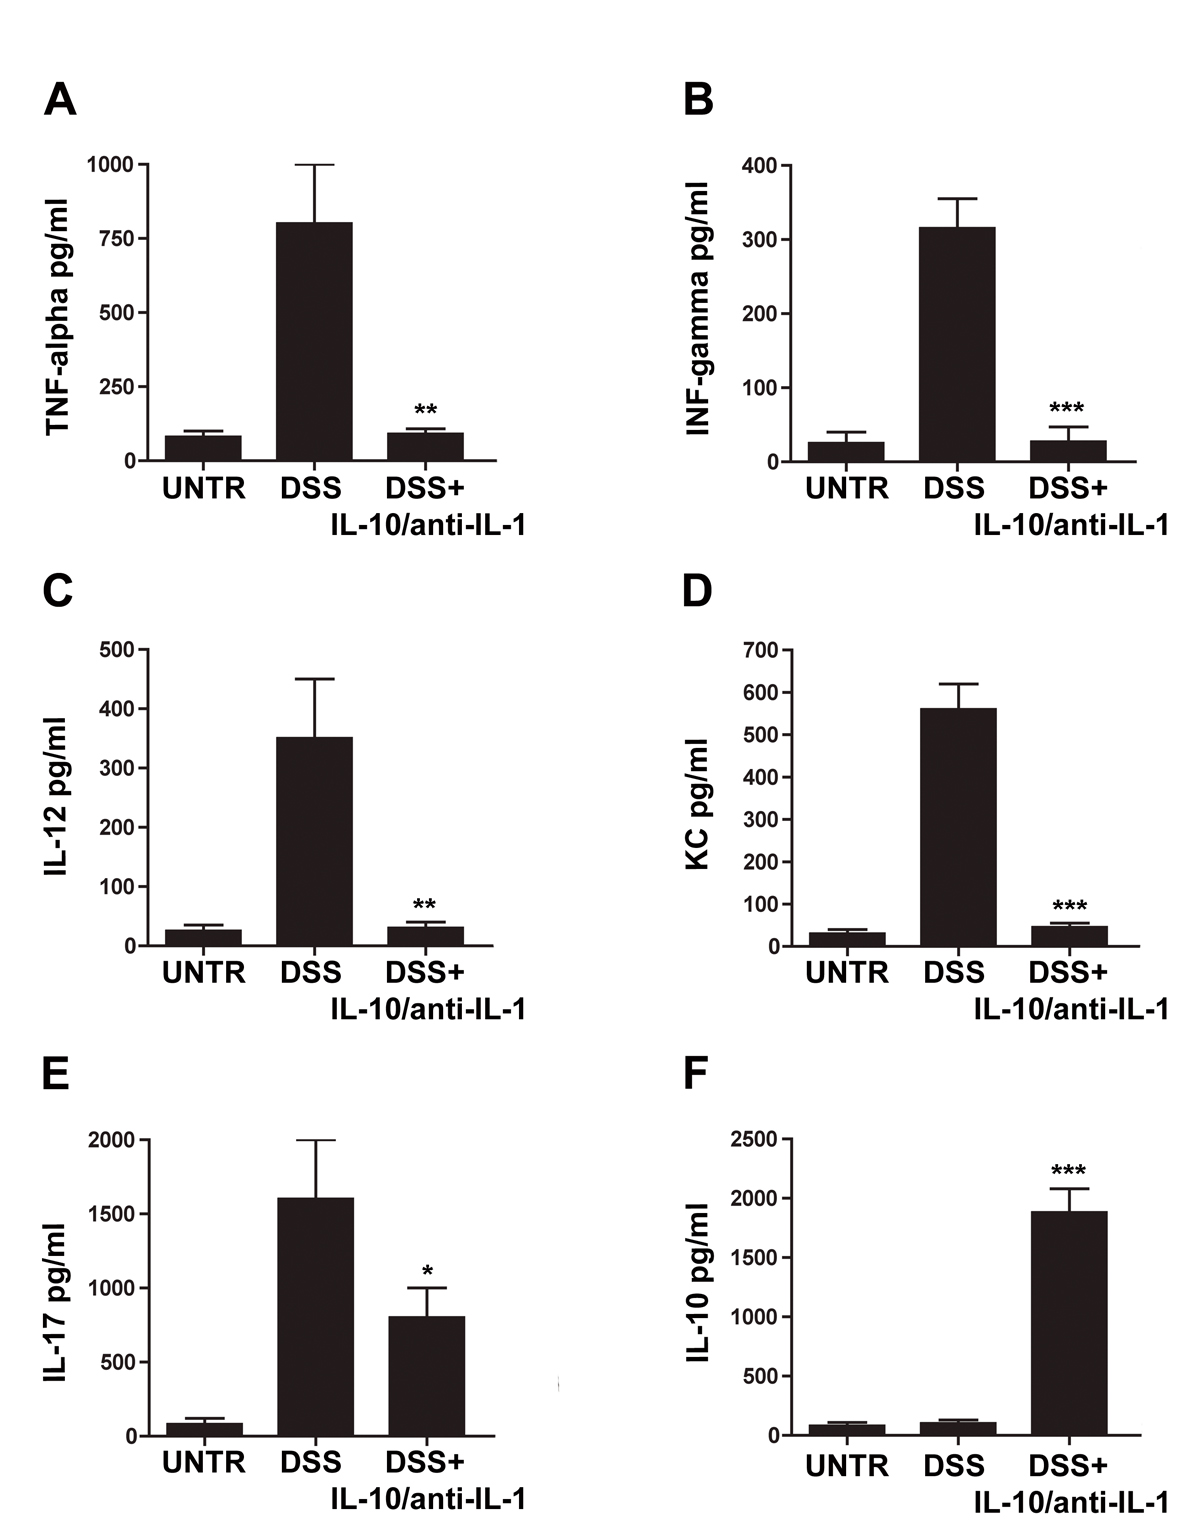
Figure 3. Evaluation of cytokine secretion in chemical-induced chronic colitis. ELISA assays for concentrations of TNF-alpha (A), IFN-gamma (B), IL-12 (C), KC (D), IL-17 (E) and IL-10 (F) in different treatment groups. UNTR (untreated, hydroalcoholic solution only); DSS (DSS 2% plus hydroalcoholic solution); DSS + IL-10/anti-IL-1 (DSS 2% + interleukin-10 plus anti-IL-1 antibody); data are represented as mean values ± S.D. (n = 10). Statistical analysis: A) DSS+ IL-10/anti-IL-1 vs. DSS ** P = 0.0036; B) DSS + IL-10/anti-IL-1 vs. DSS *** P = 0.004; C) DSS+ IL-10/anti-IL-1 vs. DSS ** P = 0.0053; D) DSS + IL-10/anti-IL-1 vs. DSS *** P = 0.0001; E) DSS + IL-10/anti-IL-1 vs. DSS * P = 0.036; F) DSS + IL-10/anti-IL-1 vs. DSS *** P = 0.0001.
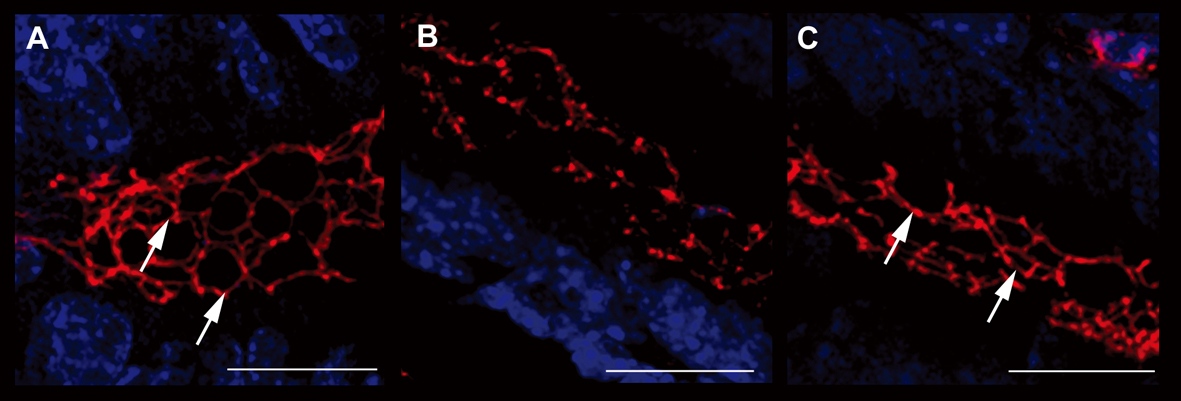
Figure 4. Evaluation of ZO-1 expression. Immunofluorescence anti-ZO-1 (red staining) experiments in the colon samples of different treatment groups showed the different epithelial barrier TJ structural integrity (arrows). A relevant example for each treatment group is shown: A (UNTR; untreated, hydroalcoholic solution only); B (DSS; DSS 2% plus hydroalcoholic solution); C (DSS + IL-10/anti-IL-1; DSS 2% + interleukin-10 plus anti-IL-1 antibody) Bars: 20 µm.
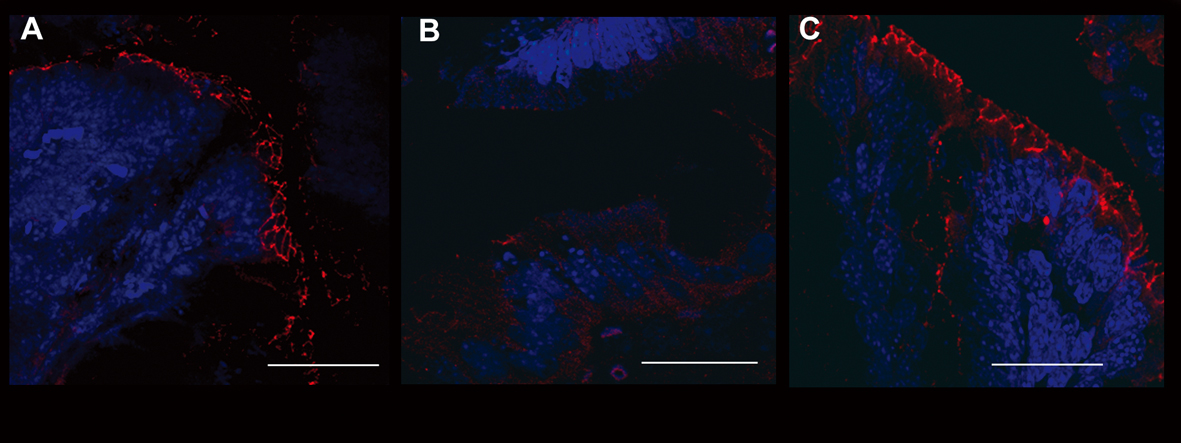
Figure 5. Evaluation of occludin expression. Immunofluorescence anti-occludin (red staining) experiments in the colon samples of different treatment groups showed the different epithelial barrier TJ structural integrity. A relevant example for each treatment group is shown: A (UNTR; untreated, hydroalcoholic solution only); B (DSS; DSS 2% plus hydroalcoholic solution); C (DSS + IL-10/anti-IL-1; DSS 2% + interleukin-10 plus anti-IL-1 antibody). Bars: 20 µm.
Tables
Table 1. Treatment Scheme for Induction of the Chronic Colitis Model, in the Different Treatment Groups
| Groups Cycles | Group 1: UNTR (10 mice) | Group 2: DSS (10 mice) | Group 3: DSS + IL-10/anti-IL-1 (10 mice) |
|---|
| Cycle 1 dd 1 - 7 | Control group: only normal drinking water | DSS 2% in water | DSS 2% in water |
| Interval dd 8 - 21 | | Normal drinking water | Normal drinking water |
| Cycle 2 dd 22 - 28 | | DSS 2% in water | DSS 2% in water |
| Interval dd 29 - 42 | | Normal drinking water | Normal drinking water |
| Cycle 3 dd 43 - 49 | | DSS 2% in water | DSS 2% in water |
| Interval dd 50 - 58 | | Normal drinking water | Normal drinking water |
| Treatment dd 59 - 68 (Twice a day) | Hydro-alcoholic solution vehicle | Hydro-alcoholic solution vehicle | 50 fg/kg GUNA interleukin-10 plus 50 fg/kg GUNA anti-IL-1 per os |
Table 2. Scoring System for the Comparative Analysis of Intestinal Bleeding
| Intestinal bleeding score | Stool consistency | Blood presence |
|---|
| 0 | Normal | Negative |
| 1 | Soft but still formed | Positive hemoccult |
| 2 | Very soft | Blood traces in stool visible |
| 3 | Diarrhoea | Rectal bleeding |
Table 3. Scoring System for Inflammation-Associated Histological Changes in the Colon
| Histological score | Histologic changes |
|---|
| 0 | No evidence of inflammation |
| 1 | Low level of inflammation with scattered infiltrating mononuclear cells (1-2 foci) |
| 2 | Moderate inflammation with multiple foci |
| 3 | High level of inflammation with increased vascular density and marked wall thickening |
| 4 | Maximal severity of inflammation with transmural leukocyte infiltration and loss of goblet cells |