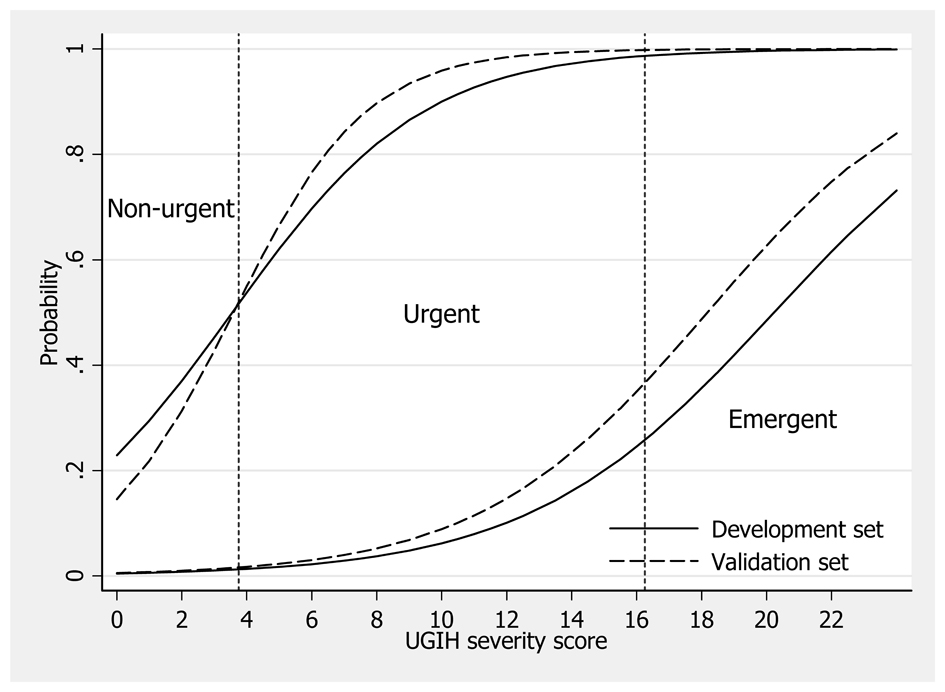
| Gastroenterology Research, ISSN 1918-2805 print, 1918-2813 online, Open Access |
| Article copyright, the authors; Journal compilation copyright, Gastroenterol Res and Elmer Press Inc |
| Journal website http://www.gastrores.org |
Original Article
Volume 6, Number 2, April 2013, pages 56-62
Upper Gastrointestinal Hemorrhage: Validation of the Severity Score
Figure

Tables
| Clinical characteristics | Criteria | Assigned score |
|---|---|---|
| Modified from the original scoring chart (with permission). | ||
| Age (year) | < 60 | 0 |
| ≥ 60 | 1 | |
| Pulse (/min) | < 100 | 0 |
| ≥ 100 | 1 | |
| Systolic pressure (mmHg) | < 100 | 10.5 |
| ≥ 100 | 0 | |
| Hemoglobin (g/dL) | < 10 | 6 |
| ≥ 10 | 0 | |
| BUN (mg/dL) | ≤ 35 | 0 |
| > 35 | 2 | |
| Cirrhosis | no | 0 |
| yes | 2 | |
| Hepatic failure | no | 0 |
| yes | 4.5 | |
| Characteristics | Development (n = 984) | Validation (n = 423) | P-value | ||
|---|---|---|---|---|---|
| mean | ± SD | mean | ± SD | ||
| SD: standard deviation. | |||||
| Demographics | |||||
| Male (n, %) | 651 | 66.2 | 298 | 70.4 | 0.121 |
| Age (year) | 58.6 | ± 15.6 | 59.4 | ± 16.5 | 0.407 |
| Mode of presentation (n, %) | |||||
| Hematemesis | 455 | 46.2 | 183 | 43.3 | 0.321 |
| Coffee ground vomiting | 196 | 19.9 | 76 | 18.0 | 0.419 |
| Hematochezia | 65 | 6.6 | 33 | 7.8 | 0.425 |
| Melena | 574 | 58.3 | 227 | 53.7 | 0.113 |
| Syncope | 192 | 19.5 | 73 | 17.3 | 0.335 |
| Hemodynamics | |||||
| Pulse (/min) | 91.4 | ± 16.0 | 91.5 | ± 16.0 | 0.879 |
| SBP (mmHg) | 119.0 | ± 23.0 | 121.3 | ± 23.3 | 0.078 |
| Biochemicals | |||||
| Hemoglobin (g/dL) | 8.1 | ± 2.9 | 8.0 | ± 2.9 | 0.511 |
| BUN (mg/dL) | 33.6 | ± 21.3 | 35.1 | ± 23.0 | 0.223 |
| Co-morbidities (n, %) | |||||
| Cirrhosis | 141 | 14.3 | 55 | 13.0 | 0.557 |
| Hepatic failure | 8 | 0.8 | 8 | 1.9 | 0.099 |
| Cardiac failure | 9 | 0.9 | 3 | 0.7 | 0.999 |
| Renal failure | 69 | 7.0 | 49 | 11.6 | 0.006 |
| Criterion-classified severity (n, %) | |||||
| Mild | 241 | 24.5 | 99 | 23.4 | 0.408 |
| Moderate | 631 | 64.1 | 268 | 63.4 | |
| Severe | 112 | 11.4 | 56 | 13.2 | |
| Clinical outcomes (n, %) | |||||
| Re-bleeding | 64 | 6.5 | 14 | 3.3 | 0.016 |
| Dead | 20 | 2.0 | 20 | 4.7 | 0.008 |
| Score-classified urgency levels | Development (n = 984) | Validation (n = 423) | P-value | ||
|---|---|---|---|---|---|
| SD: standard deviation. | |||||
| Mean score (± SD) | 9.1 | ± 5.9 | 8.5 | ± 5.7 | 0.064 |
| Urgency level (n, %) | |||||
| Non-urgent | 188 | 19.1 | 84 | 19.9 | 0.082 |
| Urgent | 578 | 58.7 | 269 | 63.6 | |
| Emergent | 218 | 22.2 | 70 | 16.5 | |
| Score-classified urgency levels | Score range | Criterion-classified severity levels | Risk estimation validity | |||||
|---|---|---|---|---|---|---|---|---|
| Mild (n = 99) | Moderate (n = 268) | Severe (n = 56) | Over | Correct | Under | |||
| *Inter-quartile range; SD: standard deviation. | ||||||||
| Mean ± SD | 2.9 ± 4.0 | 9.0 ± 4.1 | 16.1 ± 4.9 | |||||
| IQR* | 0 - 4 | 7 - 9 | 12.0 - 19.5 | |||||
| Non-urgen | (n = 84) | < 4 | 73 | 10 | 1 | - | 17.3 | 2.6 |
| Urgent | (n = 269) | 4 - 16 | 26 | 227 | 16 | 6.1 | 53.7 | 3.8 |
| Emergent | (n = 70) | > 16 | 0 | 31 | 39 | 7.3 | 9.2 | - |
| Total | 13.4 | 80.2 | 6.4 | |||||
| Prediction/discrimination | Development (n = 984) | Validation (n = 423) | P-value | ||
|---|---|---|---|---|---|
| AuROC (%) | 95%CI | AuROC (%) | 95%CI | ||
| AuROC: area under receiver operating characteristic curve; CI: confidence interval. | |||||
| Mild vs rest | 84.11 | 81.71 - 86.37 | 86.92 | 83.41 - 90.05 | 0.360 |
| Severe vs rest | 86.56 | 84.30 - 88.65 | 88.11 | 84.72 - 91.10 | 0.589 |