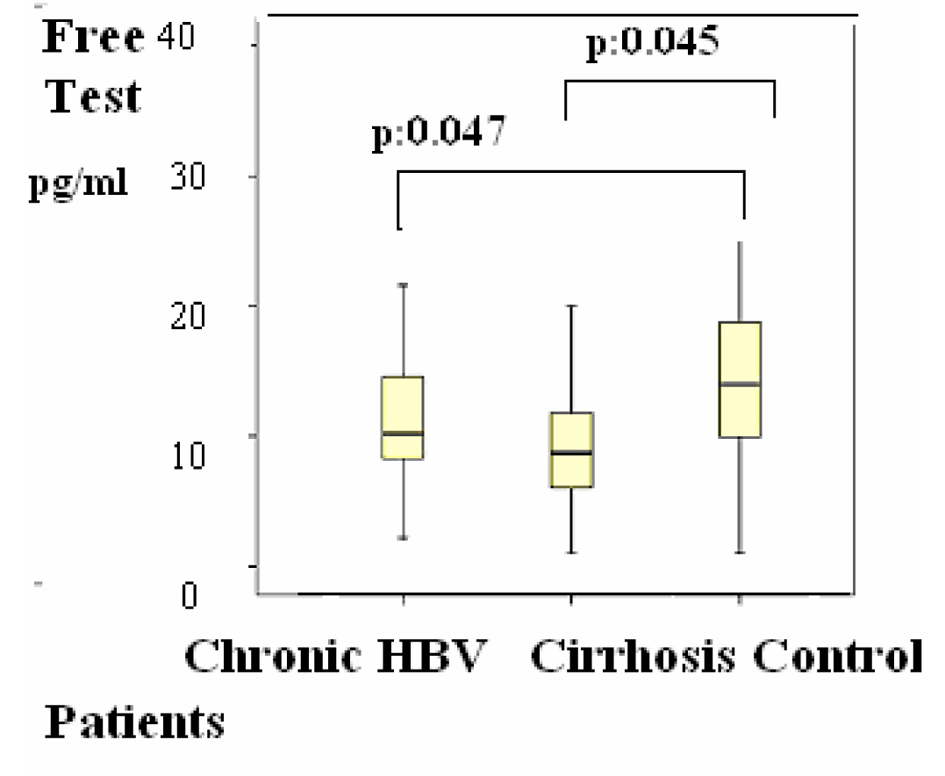
Figure 1. Figure 1. Distributions of Free testosterone (F. test) levels in patients. Differences were assessed using Kruskal-Wallis tests and Mann-Whitney U test.
| Gastroenterology Research, ISSN 1918-2805 print, 1918-2813 online, Open Access |
| Article copyright, the authors; Journal compilation copyright, Gastroenterol Res and Elmer Press Inc |
| Journal website http://www.gastrores.org |
Original Article
Volume 6, Number 4, August 2013, pages 134-138
Changes of Some Hormones Levels in Patients With Hepatitis B Virus-Related Chronic Liver Disease
Figures
Table
| Hormones | Group 1 Median (range) | Group 2 Median (range) | Group 3 Median (range) |
|---|---|---|---|
| FSH: Follicle-stimulating hormone; LH: Luteinizing hormone; T. TES: Total testosterone; F. TES: Free testosterone; E2:estradiol; ANDR: Androstenedione; DHEA: Dihydroepiandrosterone; PROGES: Progesterone; PRL: Prolactin; SHBG: Sex hormone binding protein. * : P < 0.05 Kruskal-Wallis tests and Mann-Whitney U test. | |||
| FSH (mIU/mL) | 4 (1 - 19) | 5 (1 - 39) | 6 (1 - 31) |
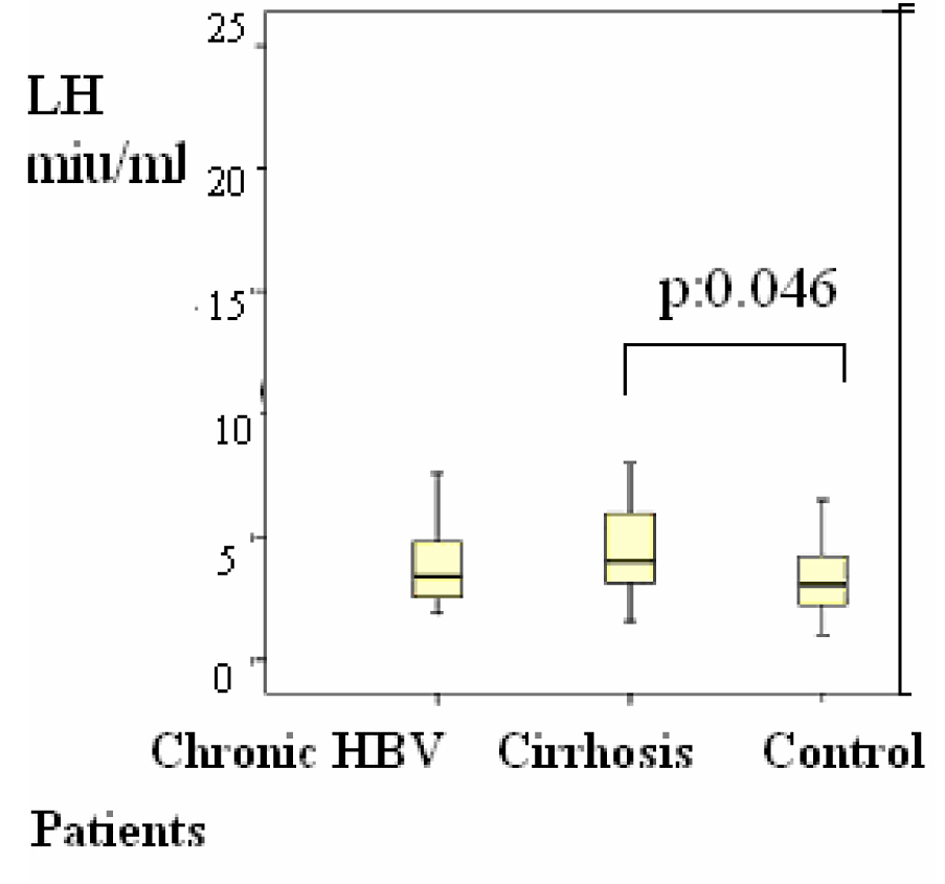
| LH (mIU/mL) | 3 (1 - 7) | 4 (1 - 20) * | 3 (1 - 8) |
| T. TES (ng/dL) | 496 (255 - 1032) | 417 (28 - 1,062) | 442 (189 - 846) |
| F. TES (pg/mL) | 8 (1 - 20) | 10 (2 - 21)* | 14 (1 - 34) * |
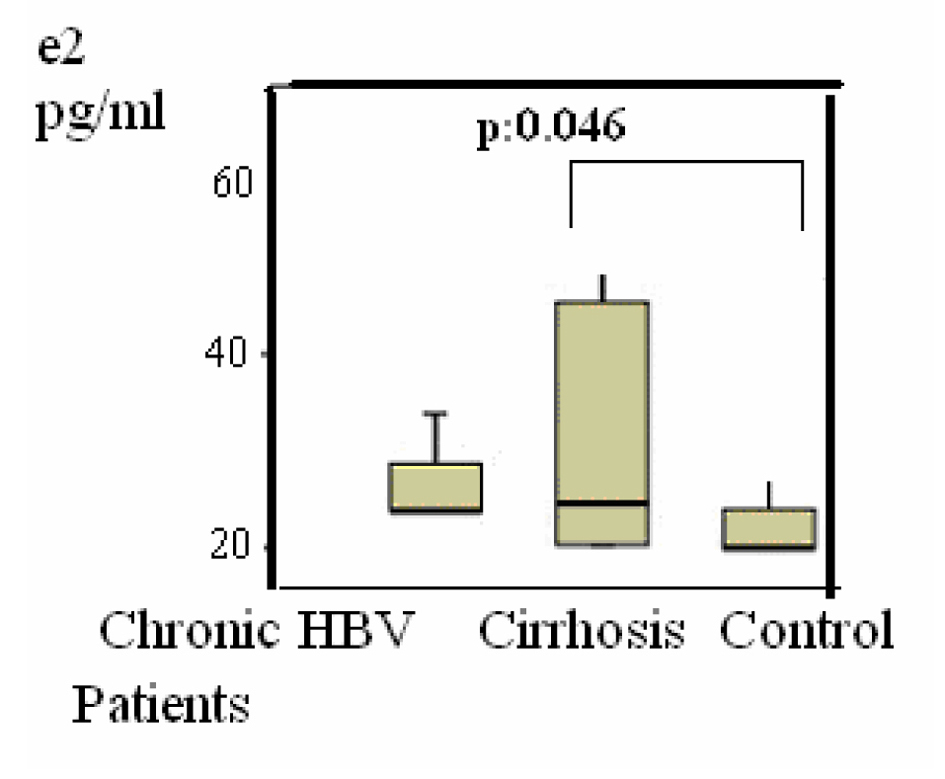
| E2 (pg/mL) | 20 (20 - 77) | 22 (20 - 47) * | 20 (20 - 39) |
| ANDR (ng/mL) | 2 (1 - 7) | 2 (1 - 5) | 2 (1 - 8) |
| DHEA (µg/dL) | 145 (20 - 492) | 52 (15 - 231) * | 163 (39 - 528) |
| PROGES (ng/mL) | 0.4 (0.2 - 7) | 0.3 (0.2 - 1.3) | 0.3 (0.2 - 1.3) |
| PRL (ng/mL) | 6 (1 - 50) | 8 (2 - 32) | 7 (1 - 39) |
| SHBG (nmol/mL) | 42 (21 - 79) | 48 (2 - 114) | 41 (15 - 100) |