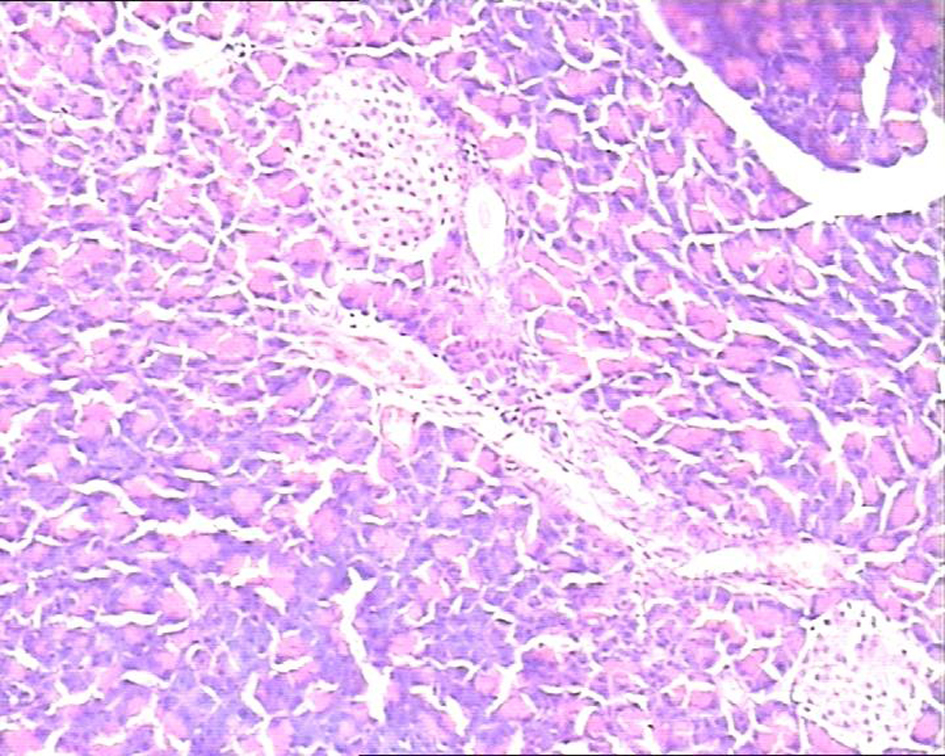
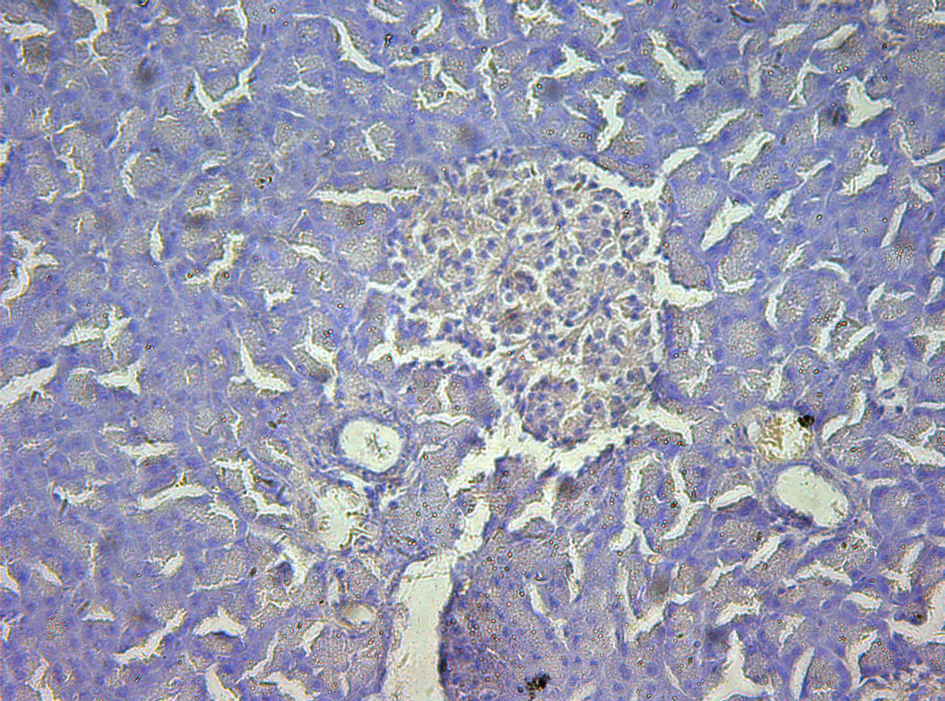
Figure 1. In study group pancreatic acinar structures were normal, and islets were clearly observed located in the center of lobule with normal size. H&E staining, 10 × 10.
| Gastroenterology Research, ISSN 1918-2805 print, 1918-2813 online, Open Access |
| Article copyright, the authors; Journal compilation copyright, Gastroenterol Res and Elmer Press Inc |
| Journal website http://www.gastrores.org |
Original Article
Volume 5, Number 6, December 2012, pages 227-231
A Modified Perfusion Method to Improve the Quality of Procured Donor Pancreas in Rats
Figures
Tables
| Time | Group | Venous congestion | Interstitial edema | Inflammation cell infiltration | |||
|---|---|---|---|---|---|---|---|
| Negative (n) | Positive (n) | Negative (n) | Positive (n) | Negative (n) | Positive (n) | ||
| * Compared with control group, Fisher exact probability test, P < 0.05; ** Compared with control group, Chi-square test, P < 0.05. | |||||||
| 6h* post-perfusion | Study | 24 | 0 | 24 | 0 | 24 | 0 |
| Control | 19 | 5 | 17 | 7 | 20 | 4 | |
| 10h** post-perfusion | Study | 22 | 2 | 21 | 3 | 23 | 1 |
| Control | 11 | 13 | 10 | 14 | 10 | 14 | |
| 14h** post-perfusion | Study | 21 | 3 | 20 | 4 | 20 | 4 |
| Control | 7 | 17 | 6 | 18 | 3 | 21 | |
| Time | Group | Negative (n) | Mild Positive (n) | Positive (n) |
|---|---|---|---|---|
| * Compared with control group, Fisher exact probability test, P > 0.05; ** Compared with control group, Chi-square test, P < 0.05. | ||||
| 6h* post-perfusion | Study | 24 | 0 | 0 |
| Control | 20 | 3 | 1 | |
| 10h** post-perfusion | Study | 24 | 0 | 0 |
| Control | 17 | 5 | 2 | |
| 14h** post-perfusion | Study | 22 | 2 | 0 |
| Control | 12 | 8 | 4 | |
| Time | Group | Negative (n) | Mild Positive (n) | Positive (n) |
|---|---|---|---|---|
| * Compared with control group, Fisher exact probability test, P < 0.05; ** Compared with control group, Chi-square test, P < 0.05. | ||||
| 6h* post-perfusion | Study | 24 | 0 | 0 |
| Control | 14 | 5 | 5 | |
| 10h** post-perfusion | Study | 23 | 1 | 0 |
| Control | 11 | 6 | 7 | |
| 14h** post-perfusion | Study | 20 | 3 | 1 |
| Control | 7 | 7 | 10 | |