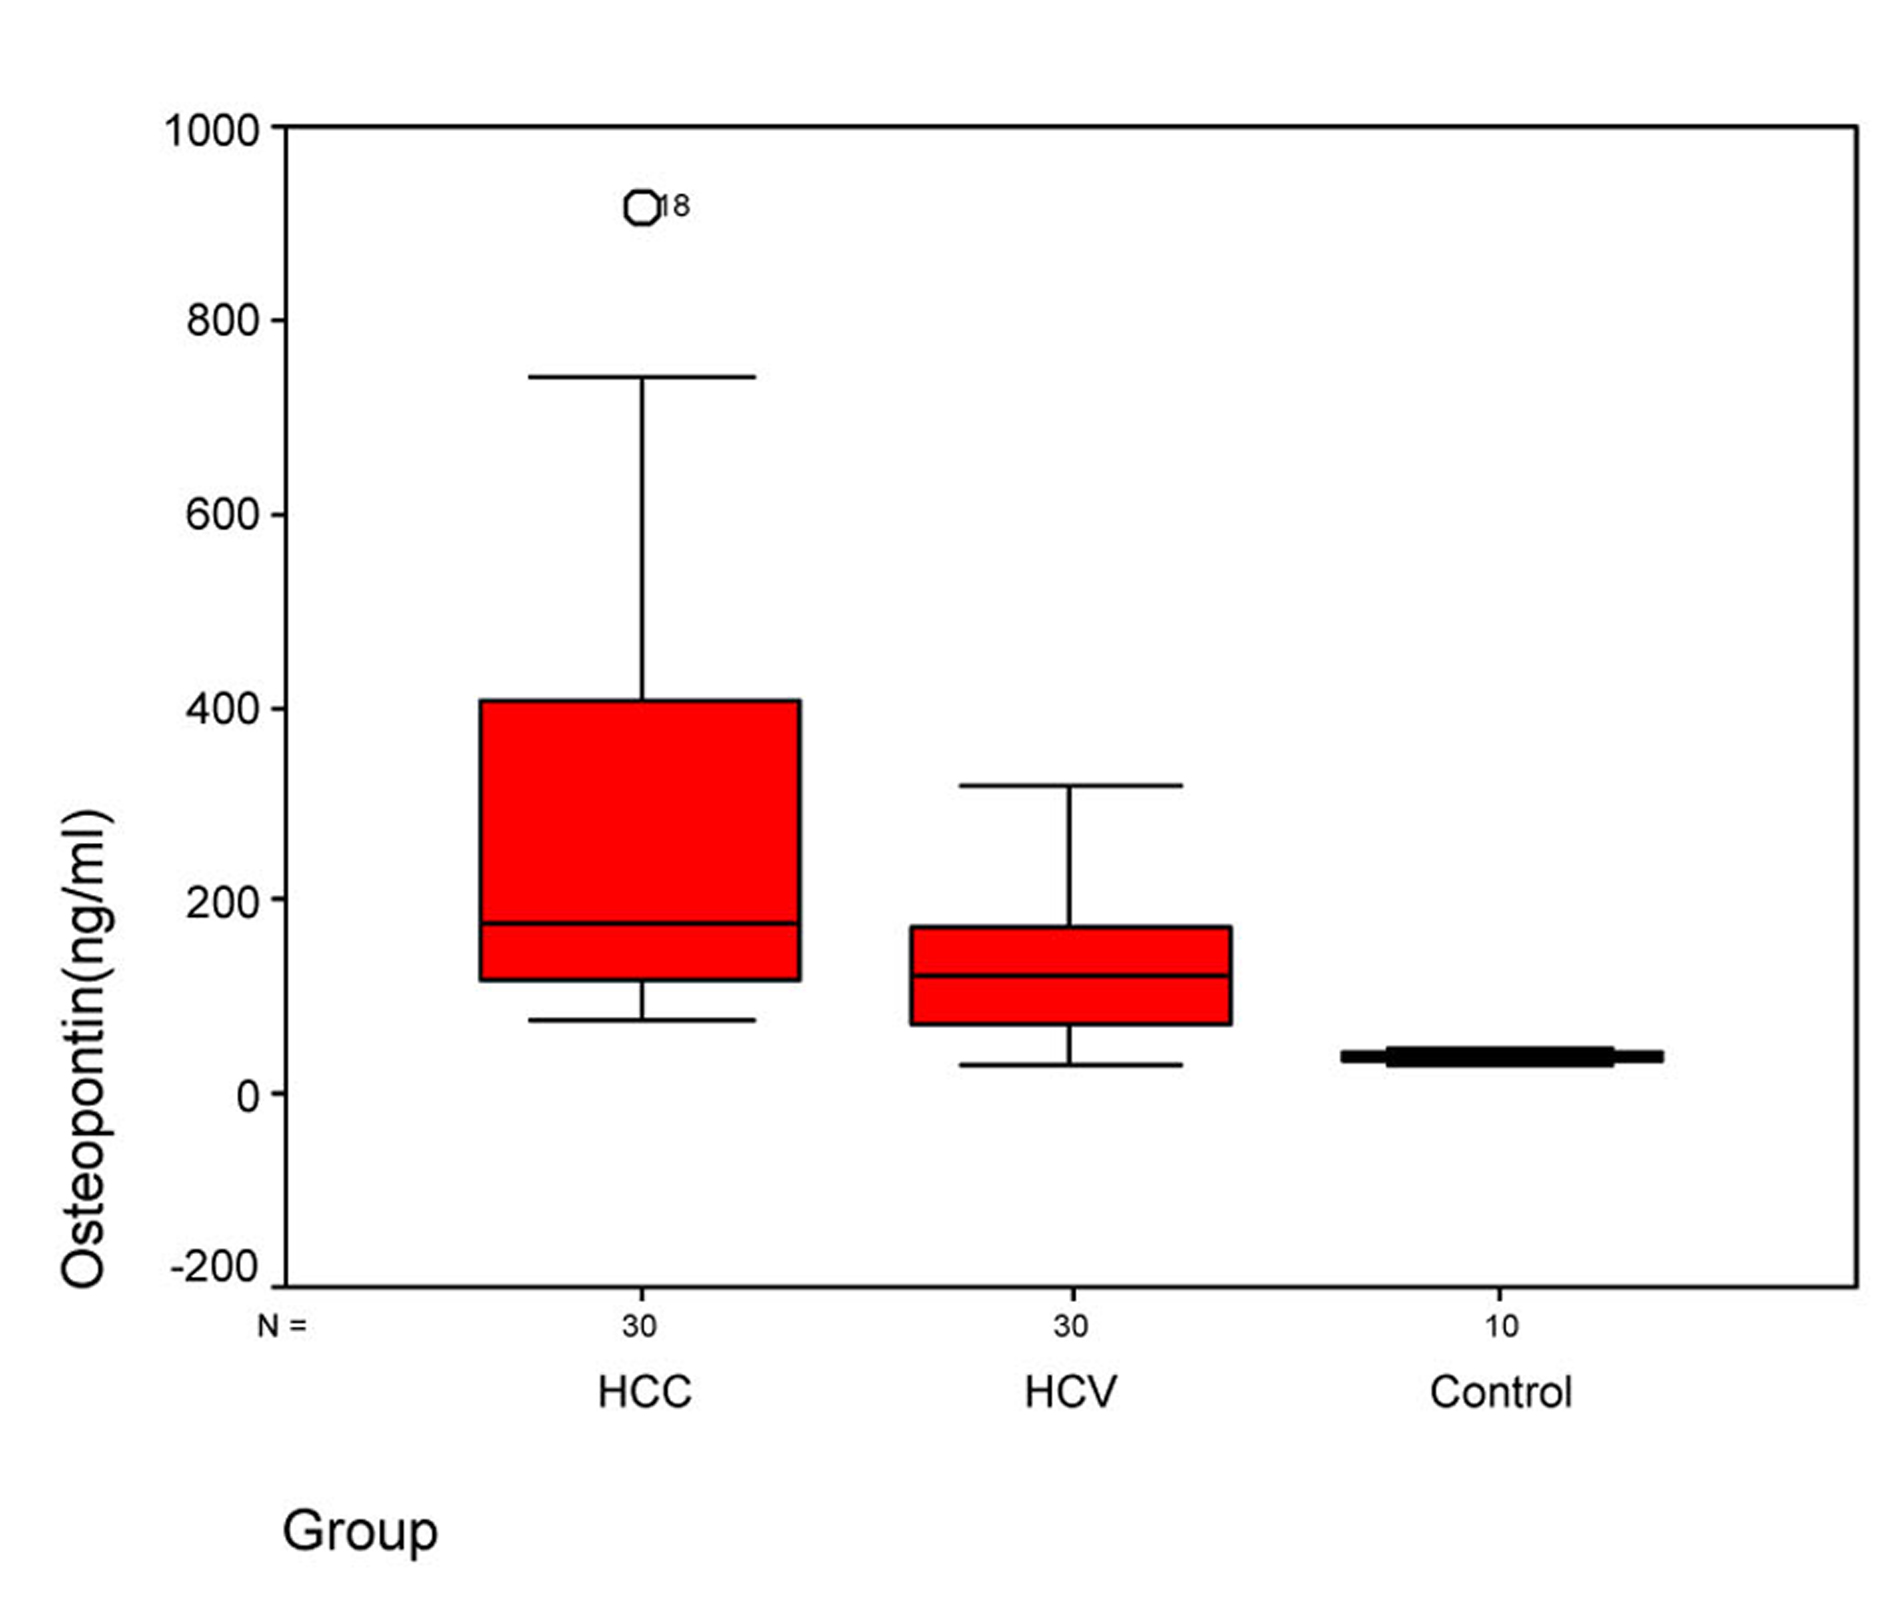
Figure 1. Figure 1. Plasma osteopontin levels in three groups. Box plots represent median, quartiles and extremes, the asterisks represent outliers.
| Gastroenterology Research, ISSN 1918-2805 print, 1918-2813 online, Open Access |
| Article copyright, the authors; Journal compilation copyright, Gastroenterol Res and Elmer Press Inc |
| Journal website http://www.gastrores.org |
Original Article
Volume 6, Number 5, October 2013, pages 191-199
Clinical Significance of Plasma Osteopontin Level as a Biomarker of Hepatocellular Carcinoma
Figures
Tables
| Clinico-pathological features | No | Osteopontin ng/dL | P-value |
|---|---|---|---|
| Sex | |||
| male | 52 | 136 (79 - 189) | 0.55 |
| female | 18 | 104 (54 - 221) | |
| Hematem | 5 | 178 (65 - 560) | 0.54 |
| Cirrhosis | 57 | 148 (90 - 207) | 0.00 |
| Ascites | 40 | 171 (115 - 303) | 0.00 |
| Liver | 1 | ||
| Enlarged | 36 | 140 (83 - 193) | 0.001 |
| Normal | 1 | 39 (33 - 44) | |
| Tumor Size | |||
| < 3 cm | 12 | 140 (100 - 336) | 0.28 |
| ≥ 3 cm | 8 | 229 (131 - 438) | |
| Multiplicity | |||
| Single | 19 | 138 (97 - 178) | 0.00 |
| Multiple | 11 | 495 (388 - 717) |
| OPN | AFP | |||
|---|---|---|---|---|
| r | P | r | P | |
| Age (y) | 0.448 | 0.000 | 0.476 | 0.000 |
| AST (IU/L) | 0.455 | 0.000 | 0.435 | 0.000 |
| ALT (IU/L) | 0.328 | 0.006 | 0.171 | 0.158 |
| Alb (g/dL) | -0.614 | 0.000 | -0.274 | 0.017 |
| T.Bil. (mg/dL) | -.452 | 0.000 | 0.282 | 0.018 |
| PC% | -0.33 | 0.005 | -0.31 | 0.009 |
| Hb (gm/dL) | -0.13 | 0.268 | -0.07 | 0.95 |
| Plat. (× 103/mm3) | -0.33 | 0.004 | -0.43 | 0.000 |
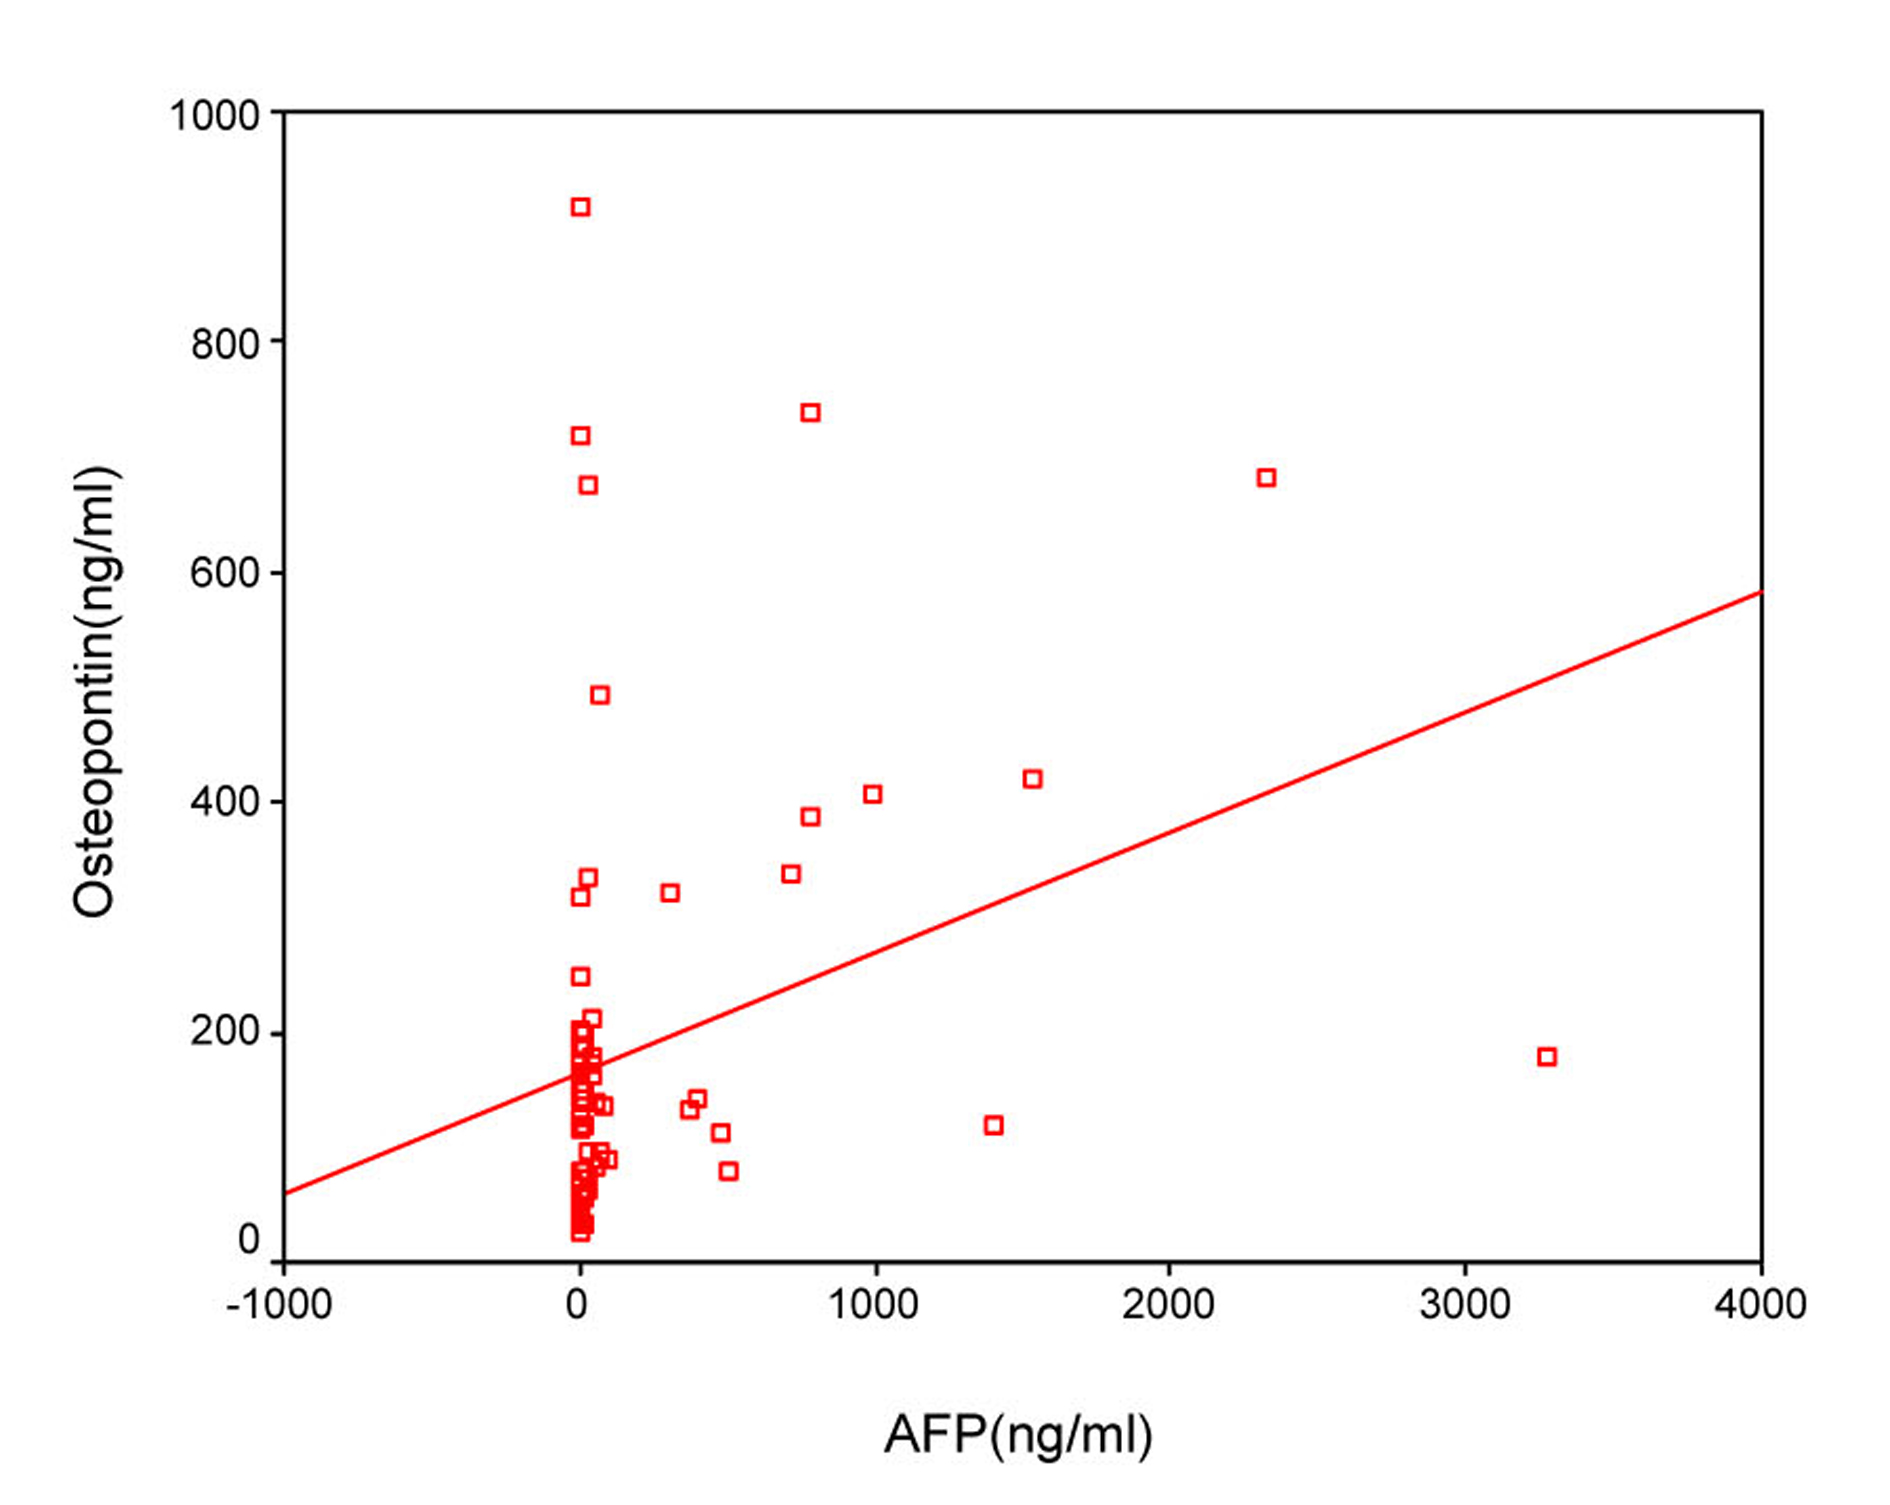
| AFP (ng/mL) | 0.408 | 0.000 | ||
| Group I (n = 30) | Group II (n = 30) | Control (n = 10) | P value | |
|---|---|---|---|---|
| * P-value calculated by Kruskal-Wallis Test. P-value is significant if < 0.05. Groups having the same letters are not statistically significance. | ||||
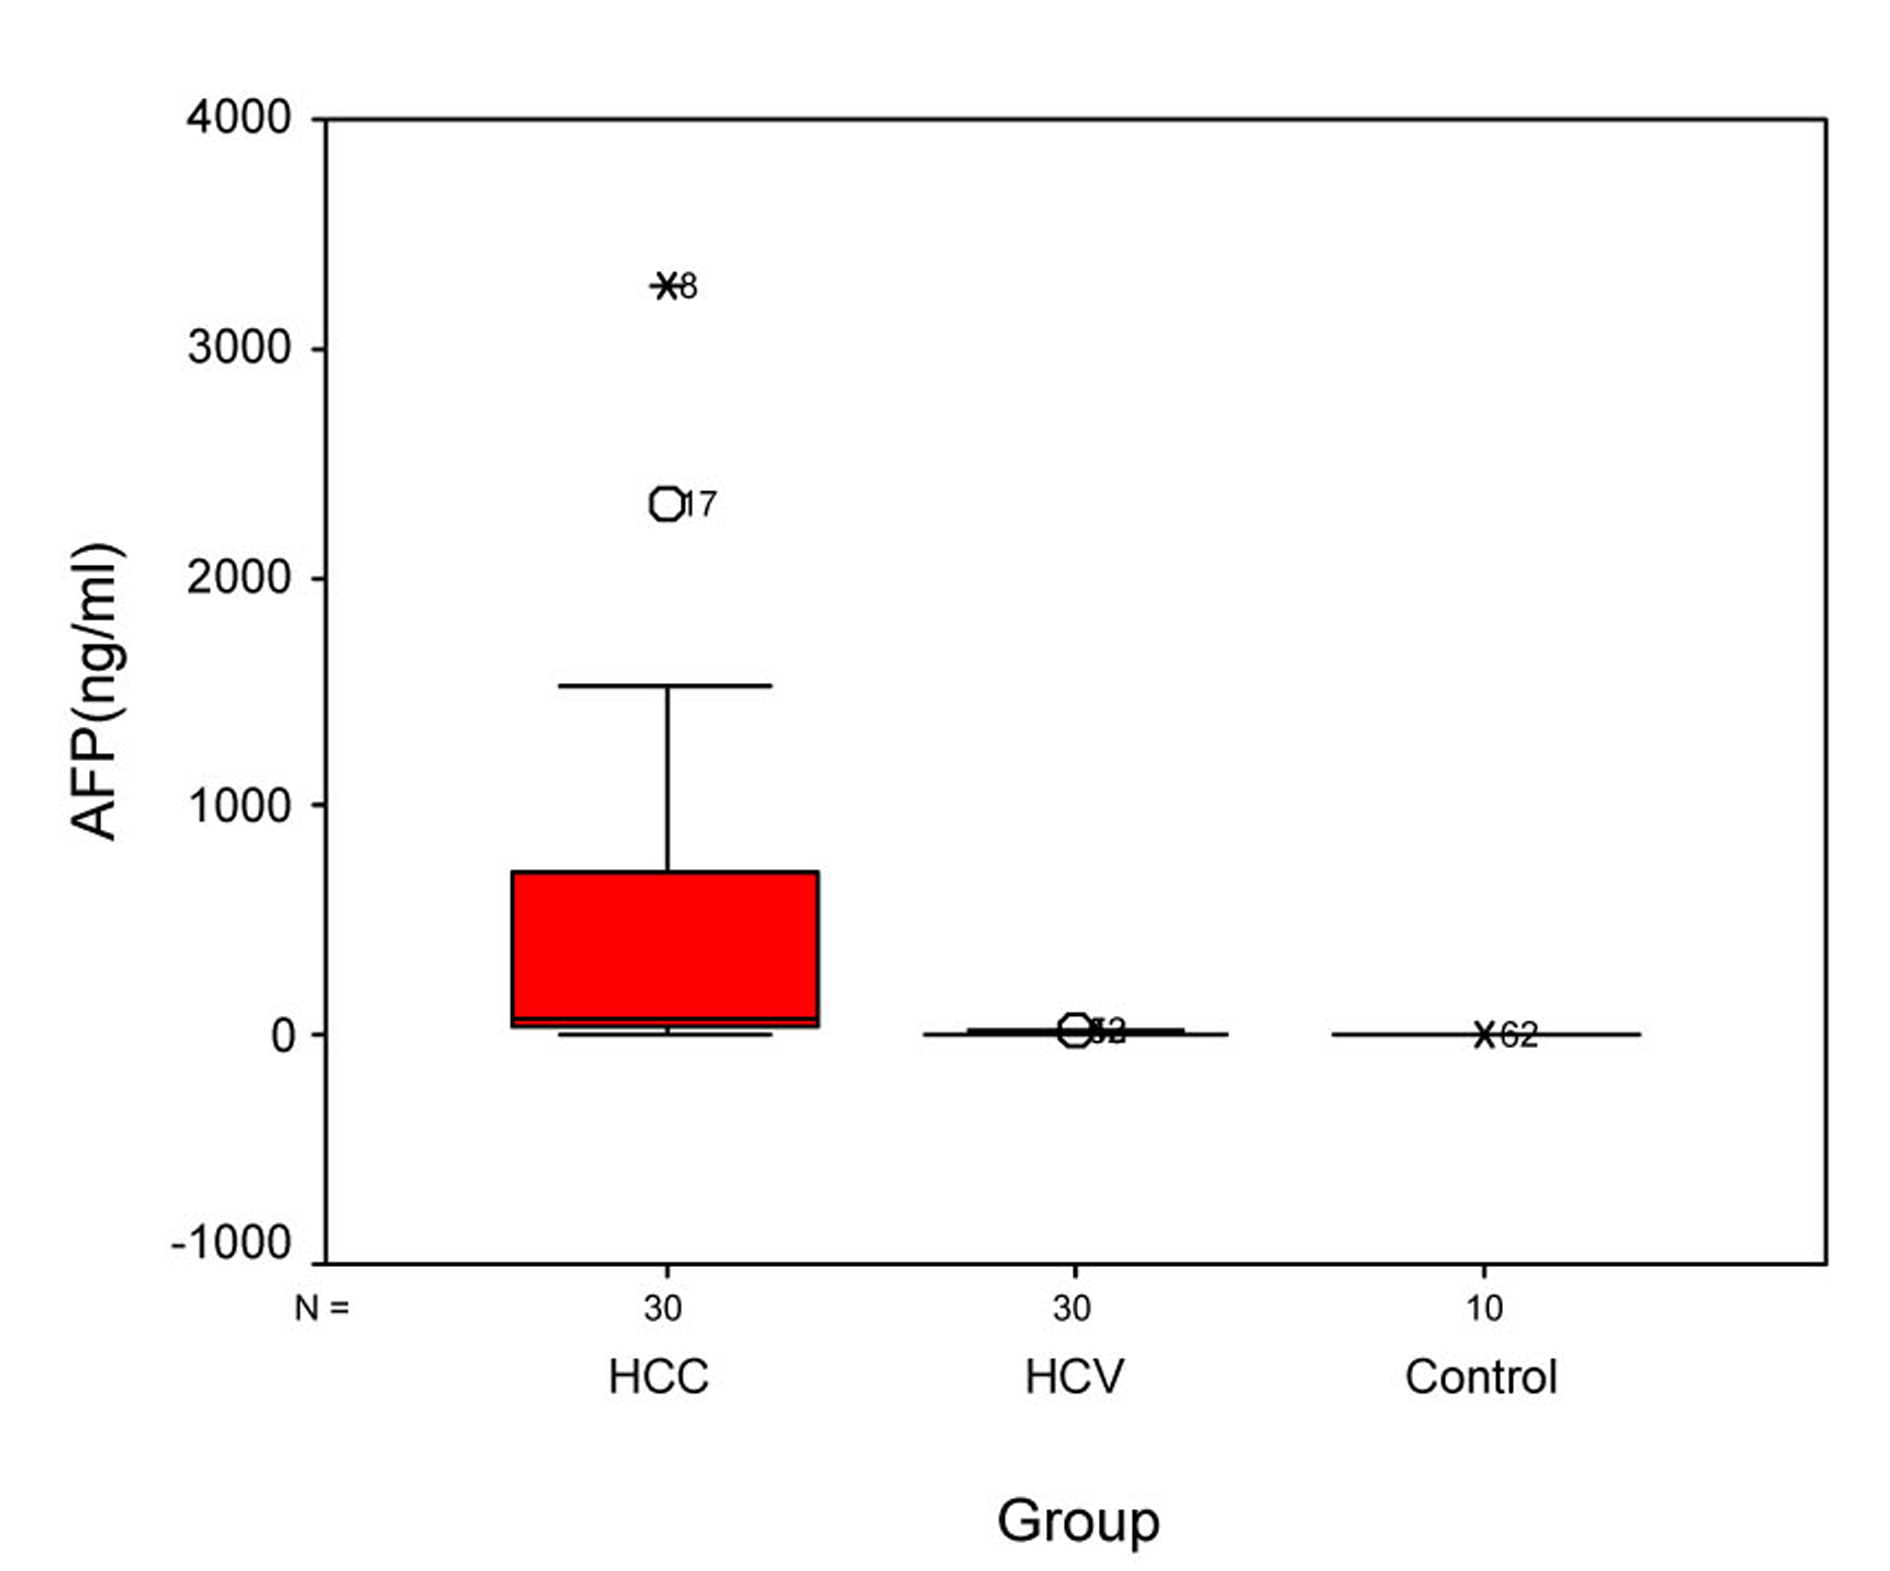
| AFP (ng/mL) | 79 (38 - 726) a | 5.5 (4 - 10) b | 3.5 (3 - 4.4) c | 0.00* |
| OPN (ng/mL) | 178 (116 - 410) a | 122.5 (73 - 173) b | 37.5 (33 - 44) c | 0.00* |
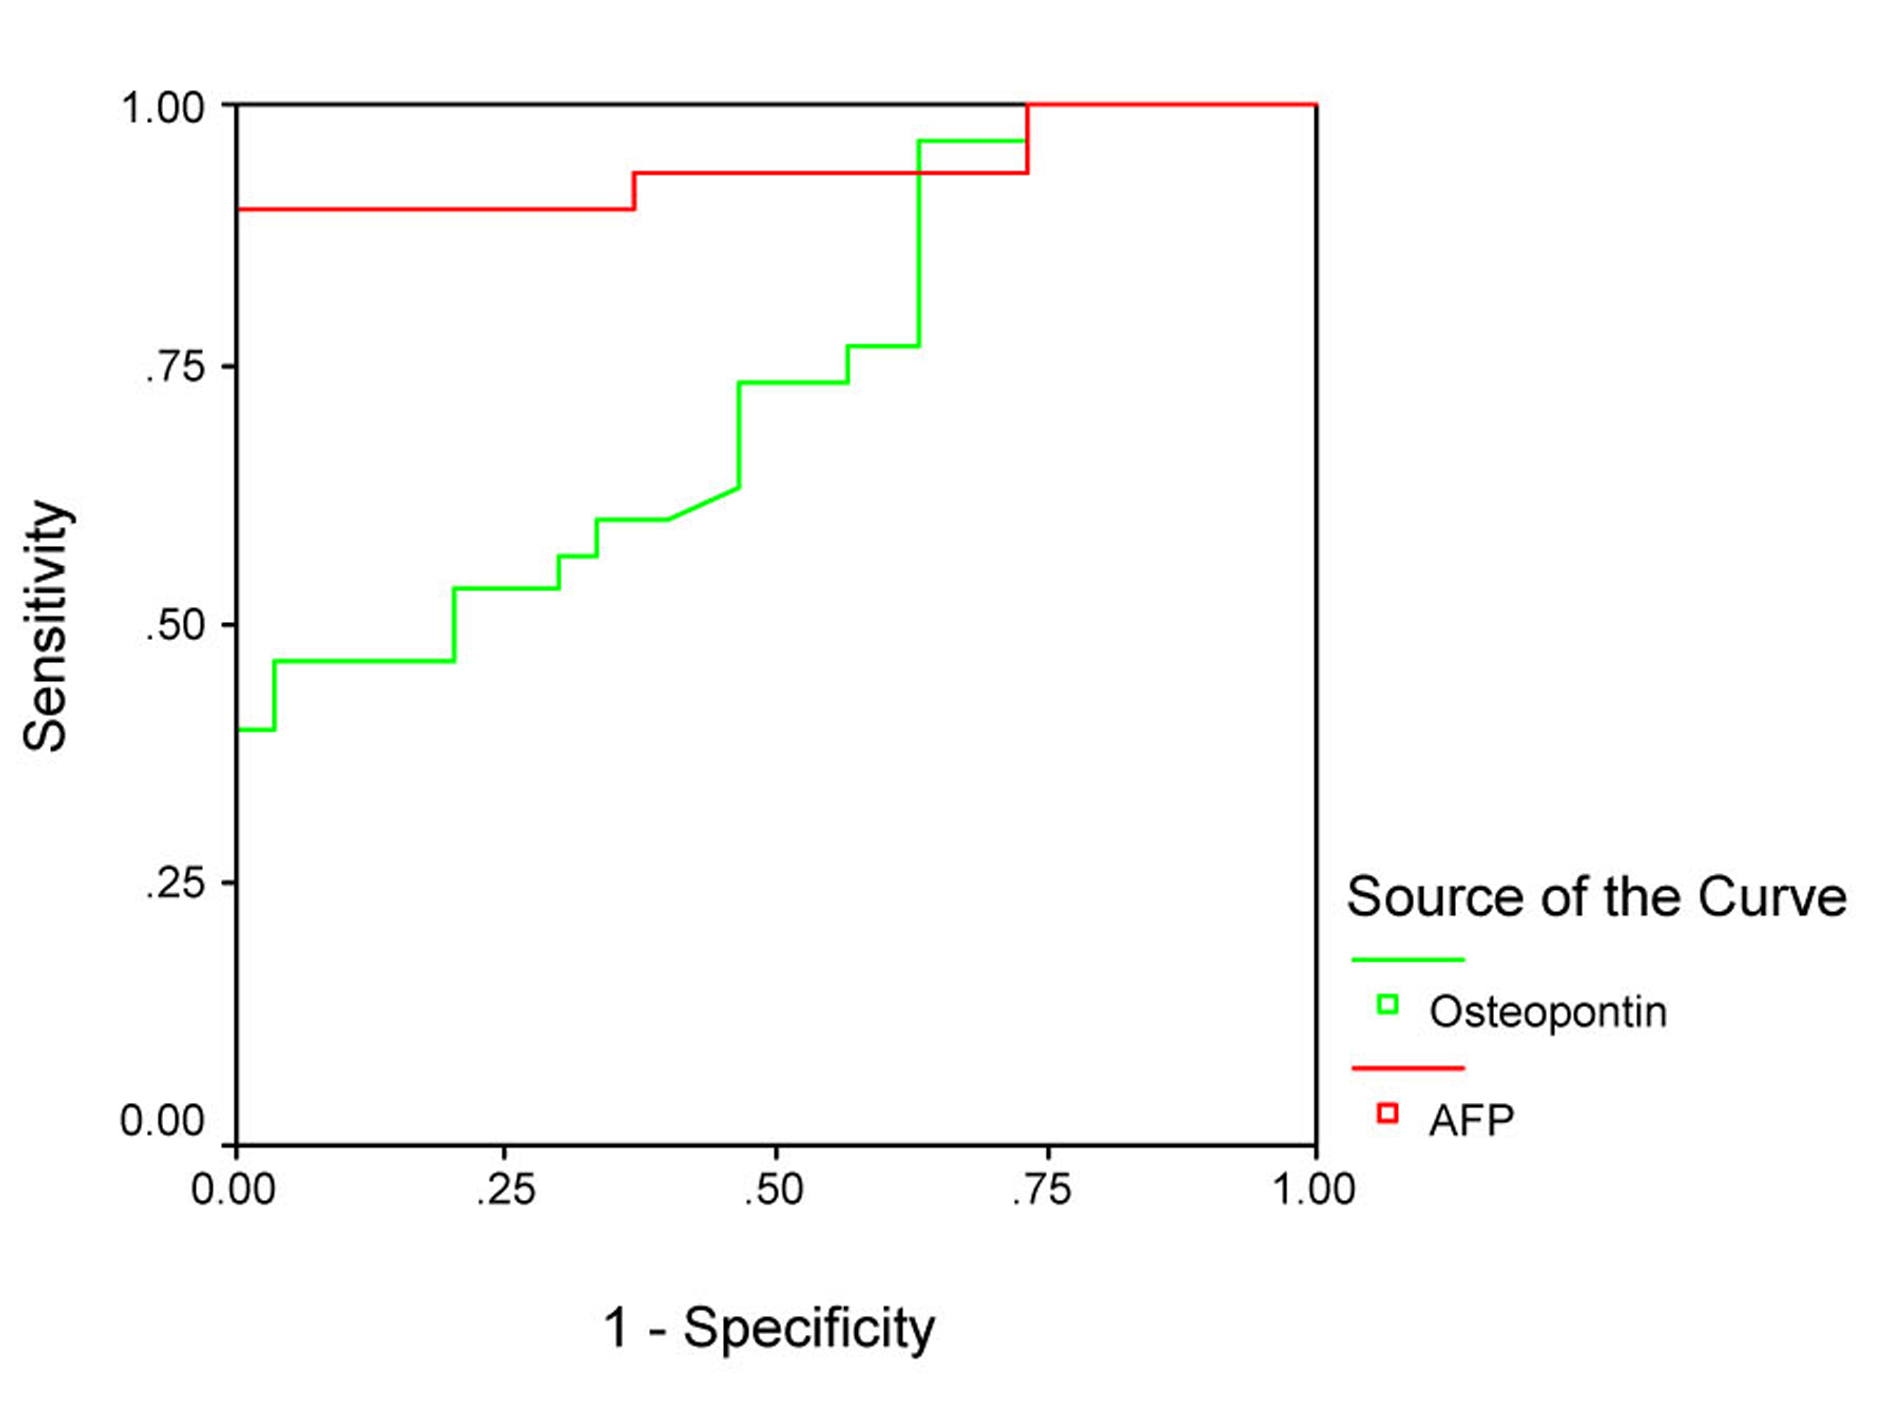
| Sensitivity (%) | Specificity (%) | Cut-off (ng/mL) | |
|---|---|---|---|
| OPN | 73% | 54% | 128.5 |
| AFP | 90% | 77% | 10.4 |