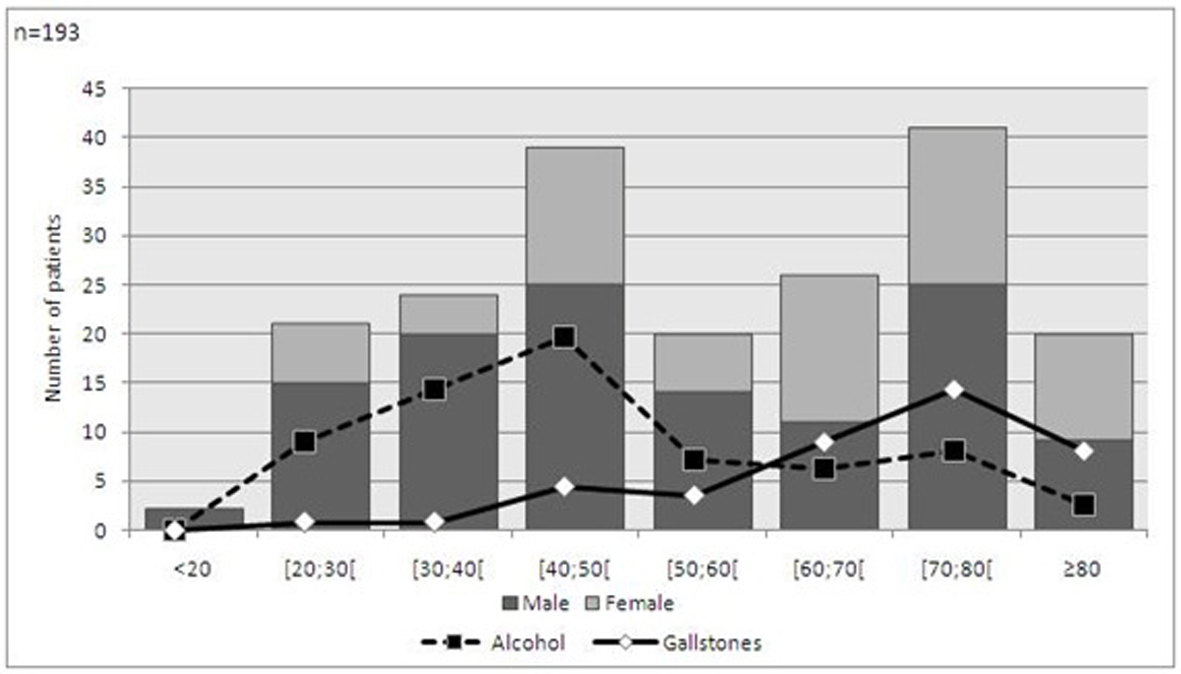
Figure 1. Demographic features and etiology of acute pancreatitis.
| Gastroenterology Research, ISSN 1918-2805 print, 1918-2813 online, Open Access |
| Article copyright, the authors; Journal compilation copyright, Gastroenterol Res and Elmer Press Inc |
| Journal website http://www.gastrores.org |
Original Article
Volume 4, Number 5, October 2011, pages 216-222
Predicting Acute Pancreatitis Severity: Comparison of Prognostic Scores
Figures
Tables
| Diagnose of severe AP | Criteria |
|---|---|
| Early Prognostic Scores | Ranson ≥ 3 |
| APACHE II ≥ 8 | |
| Organ Failure | Systolic pressure < 90 mmHg |
| PaO2 ≤ 60 mmHg | |
| Creatinine > 2.0 mg/L after rehydratation | |
| Gastrointestinal bleeding > 500 cc/24 h | |
| Local Complications (on CT scan) | Necrosis |
| Abcess | |
| Pseudocyst |
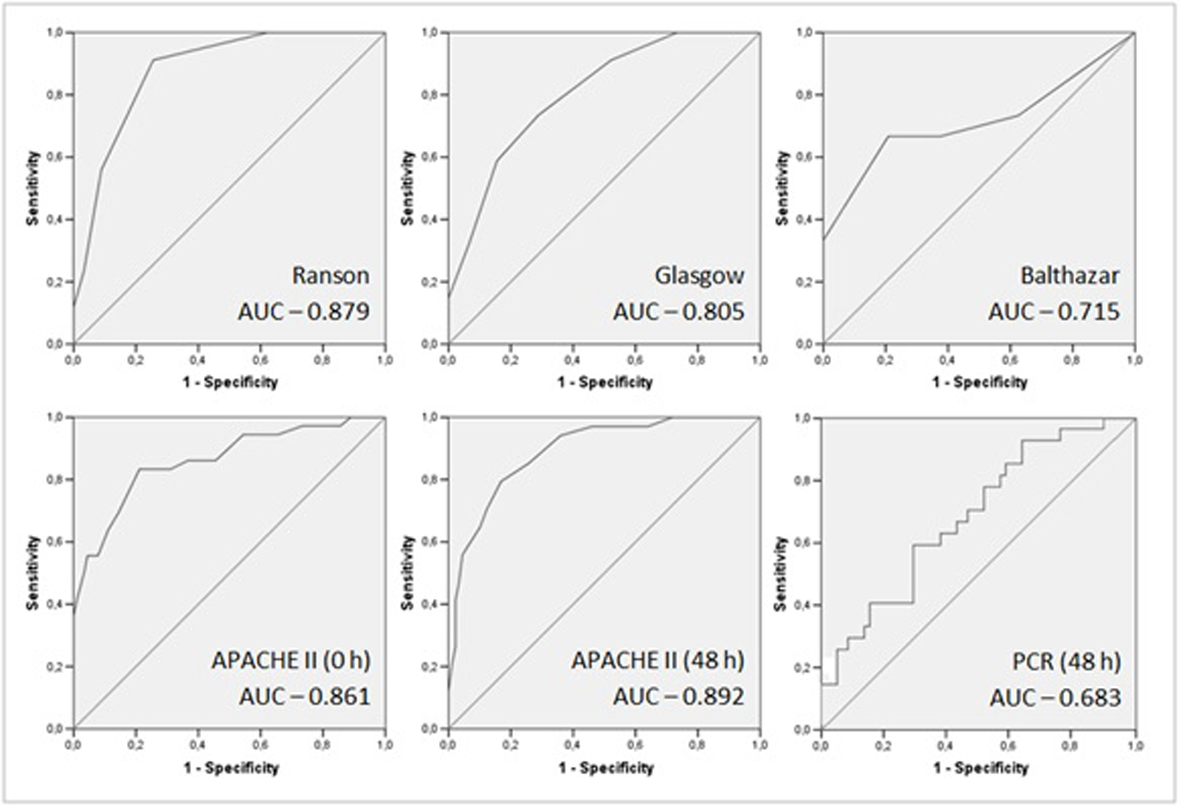
| Sensitivity (%) | Specificity (%) | PPV (%) | NPV (%) | AUC | |
|---|---|---|---|---|---|
| PPV: Positive predictive value; NPV: negative predictive value; AUC: Area under the curve. | |||||
| Ranson | 91.2 | 74.4 | 57.4 | 95.7 | 0.879 (0.818-0.940) |
| Glasgow | 73.5 | 71.1 | 49.0 | 87.7 | 0.805 (0.724-0.886) |
| Balthazar | 26.7 | 100.0 | 100.0 | 68.6 | 0.715 (0.528-0.902) |
| APACHE II (0 h) | 83.3 | 68.9 | 51.7 | 91.2 | 0.861 (0.785-0.938) |
| APACHE II (48 h) | 79.4 | 83.1 | 64.3 | 91.4 | 0.892 (0.832-0.953) |
| CRP (48 h) | 44.4 | 70.7 | 41.4 | 73.2 | 0.683 (0.564-0.802) |
| Severity | Mortality | Complications | Length of Stay | |
|---|---|---|---|---|
| ***Odds ratio not calculated; a: Odds Ratio; b: Chi-square test; c: Fisher exact test; d: Mann-Whitney test. | ||||
| Ranson | 30.101 (8.401-107.857)a P < 0.001b | *** P = 0.001c | 2.045 (0.723-5.786)a P = 0.171b | 8 versus 12 days P = 0.016d |
| Glasgow | 6.838 (2.814-16.615)a P < 0.001b | *** P = 0.001c | 1.323 (0.473-3.698)a P = 0.593b | 8 versus 12 days P = 0.003d |
| Balthazar | *** P = 0.017c | 14.333 (0.707-290.431)a P = 0.161c | *** P = 0.012c | 17 versus 37 days P < 0.001d |
| APACHE II (0 h) | 11.071 (4.140-29.605)a P < 0.001b | *** P < 0.001c | 1.049 (0.377-2.921)a P = 0.927b | 8 versus 11 days P = 0.029d |
| APACHE II (48 h) | 19.029 (7.003-51.701)a P < 0.001b | *** P < 0.001c | 1.882 (0.668-5.304)a P = 0.227b | 9 versus 13 days P = 0.010d |
| CRP (48 h) | 1.929 (0.749-4.972)a P = 0.171b | 2.375 (0.559-10.086)a P = 0.252c | 6.600 (2.090-20.843)a P = 0.001c | 7 versus 13,5 days P < 0.001d |