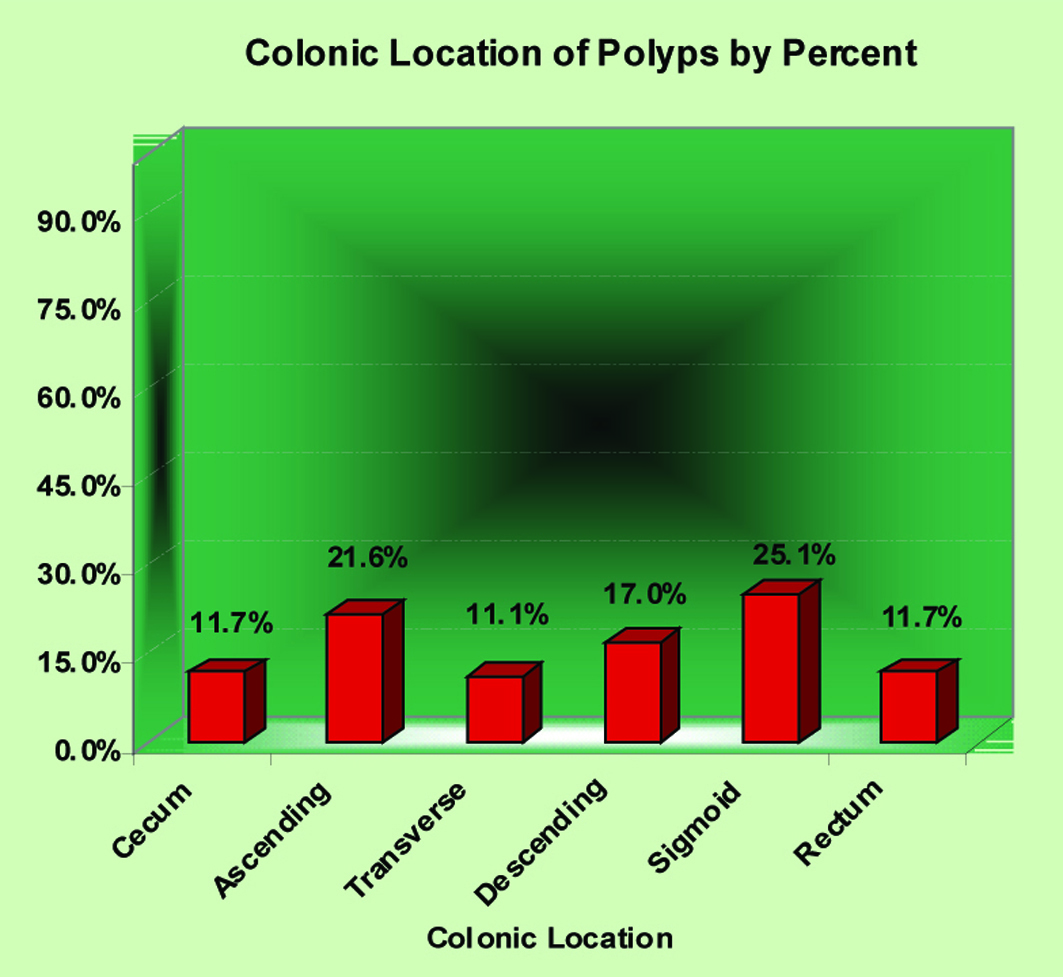
Figure 1. Colonic location of polyps by percent.
| Gastroenterology Research, ISSN 1918-2805 print, 1918-2813 online, Open Access |
| Article copyright, the authors; Journal compilation copyright, Gastroenterol Res and Elmer Press Inc |
| Journal website http://www.gastrores.org |
Original Article
Volume 4, Number 2, April 2011, pages 43-50
Implications of Serum 25-Hydroxyvitamin D on the Prevalence of Neoplastic Polyps: A Cross-Sectional Study
Figure
Tables
| All | Cecum | Ascending | Transverse | Descending | Sigmoid | Rectum | |
|---|---|---|---|---|---|---|---|
| N (%) | N (%) | N (%) | N (%) | N (%) | N (%) | N (%) | |
| Hyperplastic | 50 (29.8) | 2 (10) | 13 (35.2) | 5 (26.3) | 7 (24.1) | 18 (41.9) | 5 (25) |
| Tubular Adenoma | 97 (57.7) | 13 (65) | 18 (48.6) | 14 (73.7) | 18 (62.1) | 23 (53.5) | 11 (55) |
| Villous Adenoma | 1 (0.6) | 1 (5) | 0 (0) | 0 (0) | 0 (0) | 0 (0) | 0 (0) |
| Tubulovillous Adenoma | 8 (4.7) | 0 (0) | 4 (10.8) | 0 (0) | 0 (0) | 2 (4.6) | 2 (10) |
| Malignant | 6 (3.6) | 3 (15) | 0 (0) | 0 (0) | 1 (3.4) | 0 (0) | 2 (10) |
| Other | 6 (3.6) | 1 (5) | 2 (5.4) | 0 (0) | 3 (10.4) | 0 (0) | 0 (0) |
| Totals | 168 (100) | 20 (11.9) | 37 (22) | 19 (11.3) | 29 (17.3) | 43 (25.6) | 20 (11.9) |
| Polyps | P Value | Adenoma | P Value | 25(OH) vit-D | P Value | |||||
|---|---|---|---|---|---|---|---|---|---|---|
| N | Y | N | Y | < 10 | 10.1 - 30 | > 30 | ||||
| Number (%) | Number (%) | Number (%) | Number (%) | ng/ml | ng/ml | ng/ml | ||||
| Race | 0.541 | 0.816 | 0.000 (95%) CI | |||||||
| Caucasian | 311 (72.5) | 118 (27.5) | 348 (81.1) | 81 (18.9) | 33 (7.7) | 253 (59.0) | 143 (33.3) | |||
| Black | 99 (77.3) | 29 (22.7) | 105 (82.0) | 23 (18.0) | 29 (22.7) | 84 (65.6) | 15 (11.7) | |||
| Other | 70 (74.5) | 24 (25.5) | 74 (78.7) | 20 (21.3) | 10 (10.6) | 70 (74.5) | 14 (14.9) | |||
| Gender | 0.001 (95%) CI | 0.009 (95%) CI | 0.225 (95%) CI | |||||||
| Male | 220 (67.9) | 104 (32.1) | 249 (76.9) | 75 (23.1) | 34 (10.5) | 213 (65.7) | 77 (23.8) | |||
| Female | 260 (79.5) | 67 (20.5) | 278 (85) | 49 (15) | 38 (11.6) | 194 (59.3) | 95 (29.1) | |||
| Age | 0.000 (95%) CI | 0.001 (95%) CI | 0.800 (95%) CI | |||||||
| < 30 yo | 21 (95.5) | 1 (4.5) | 21 (95.5) | 1 (4.5) | 1 (4.5) | 16 (72.7) | 5 (22.7) | |||
| 31 - 60 yo | 319 (77.8) | 91 (22.2) | 345 (84.1) | 65 (15.9) | 48 (11.7) | 255 (62.2) | 107 (26.1) | |||
| > 60 yo | 140 (63.9) | 79 (36.1) | 161 (73.5) | 58 (26.5) | 23 (10.5) | 136 (62.1) | 60 (27.4) | |||
| 25(OH) vit D | Polyp N | Polyp Y | Total | P Value |
|---|---|---|---|---|
| Number (%) | Number (%) | Number | (Chi-Square) | |
| < 10 ng/ml | 54 (75.0) | 18 (25.0) | 72 | |
| 10.1 - 30 ng/ml | 303 (74.4) | 104 (25.6) | 407 | |
| > 30 ng/ml | 123 (71.5) | 49 (28.5) | 172 | |
| Totals | 480 (73.7) | 171 (26.3) | 651 | 0.739 |
| 25(OH) vit D | Adenoma N | Adenoma Y | Total | P Value |
|---|---|---|---|---|
| Number (%) | Number (%) | Number | (Chi-Square) | |
| < 10 ng/ml | 62 (86.1) | 10 (13.9) | 72 | |
| 10.1 - 30 ng/ml | 326 (80.1) | 81 (19.9) | 407 | |
| > 30 ng/ml | 139 (80.8) | 33 (19.2) | 172 | |
| Totals | 527 (81.0) | 124 (19.0) | 651 | 487 |