Gastroenterology Research, ISSN 1918-2805 print, 1918-2813 online, Open Access
Article copyright, the authors; Journal compilation copyright, Gastroenterol Res and Elmer Press Inc
Journal website http://www.gastrores.org

Original Article

Volume 3, Number 6, December 2010, pages 262-271


Clinical Benefits of Biochemical Markers of Fibrosis in Egyptian Children With Chronic Liver Diseases

Figures

Figure 1.
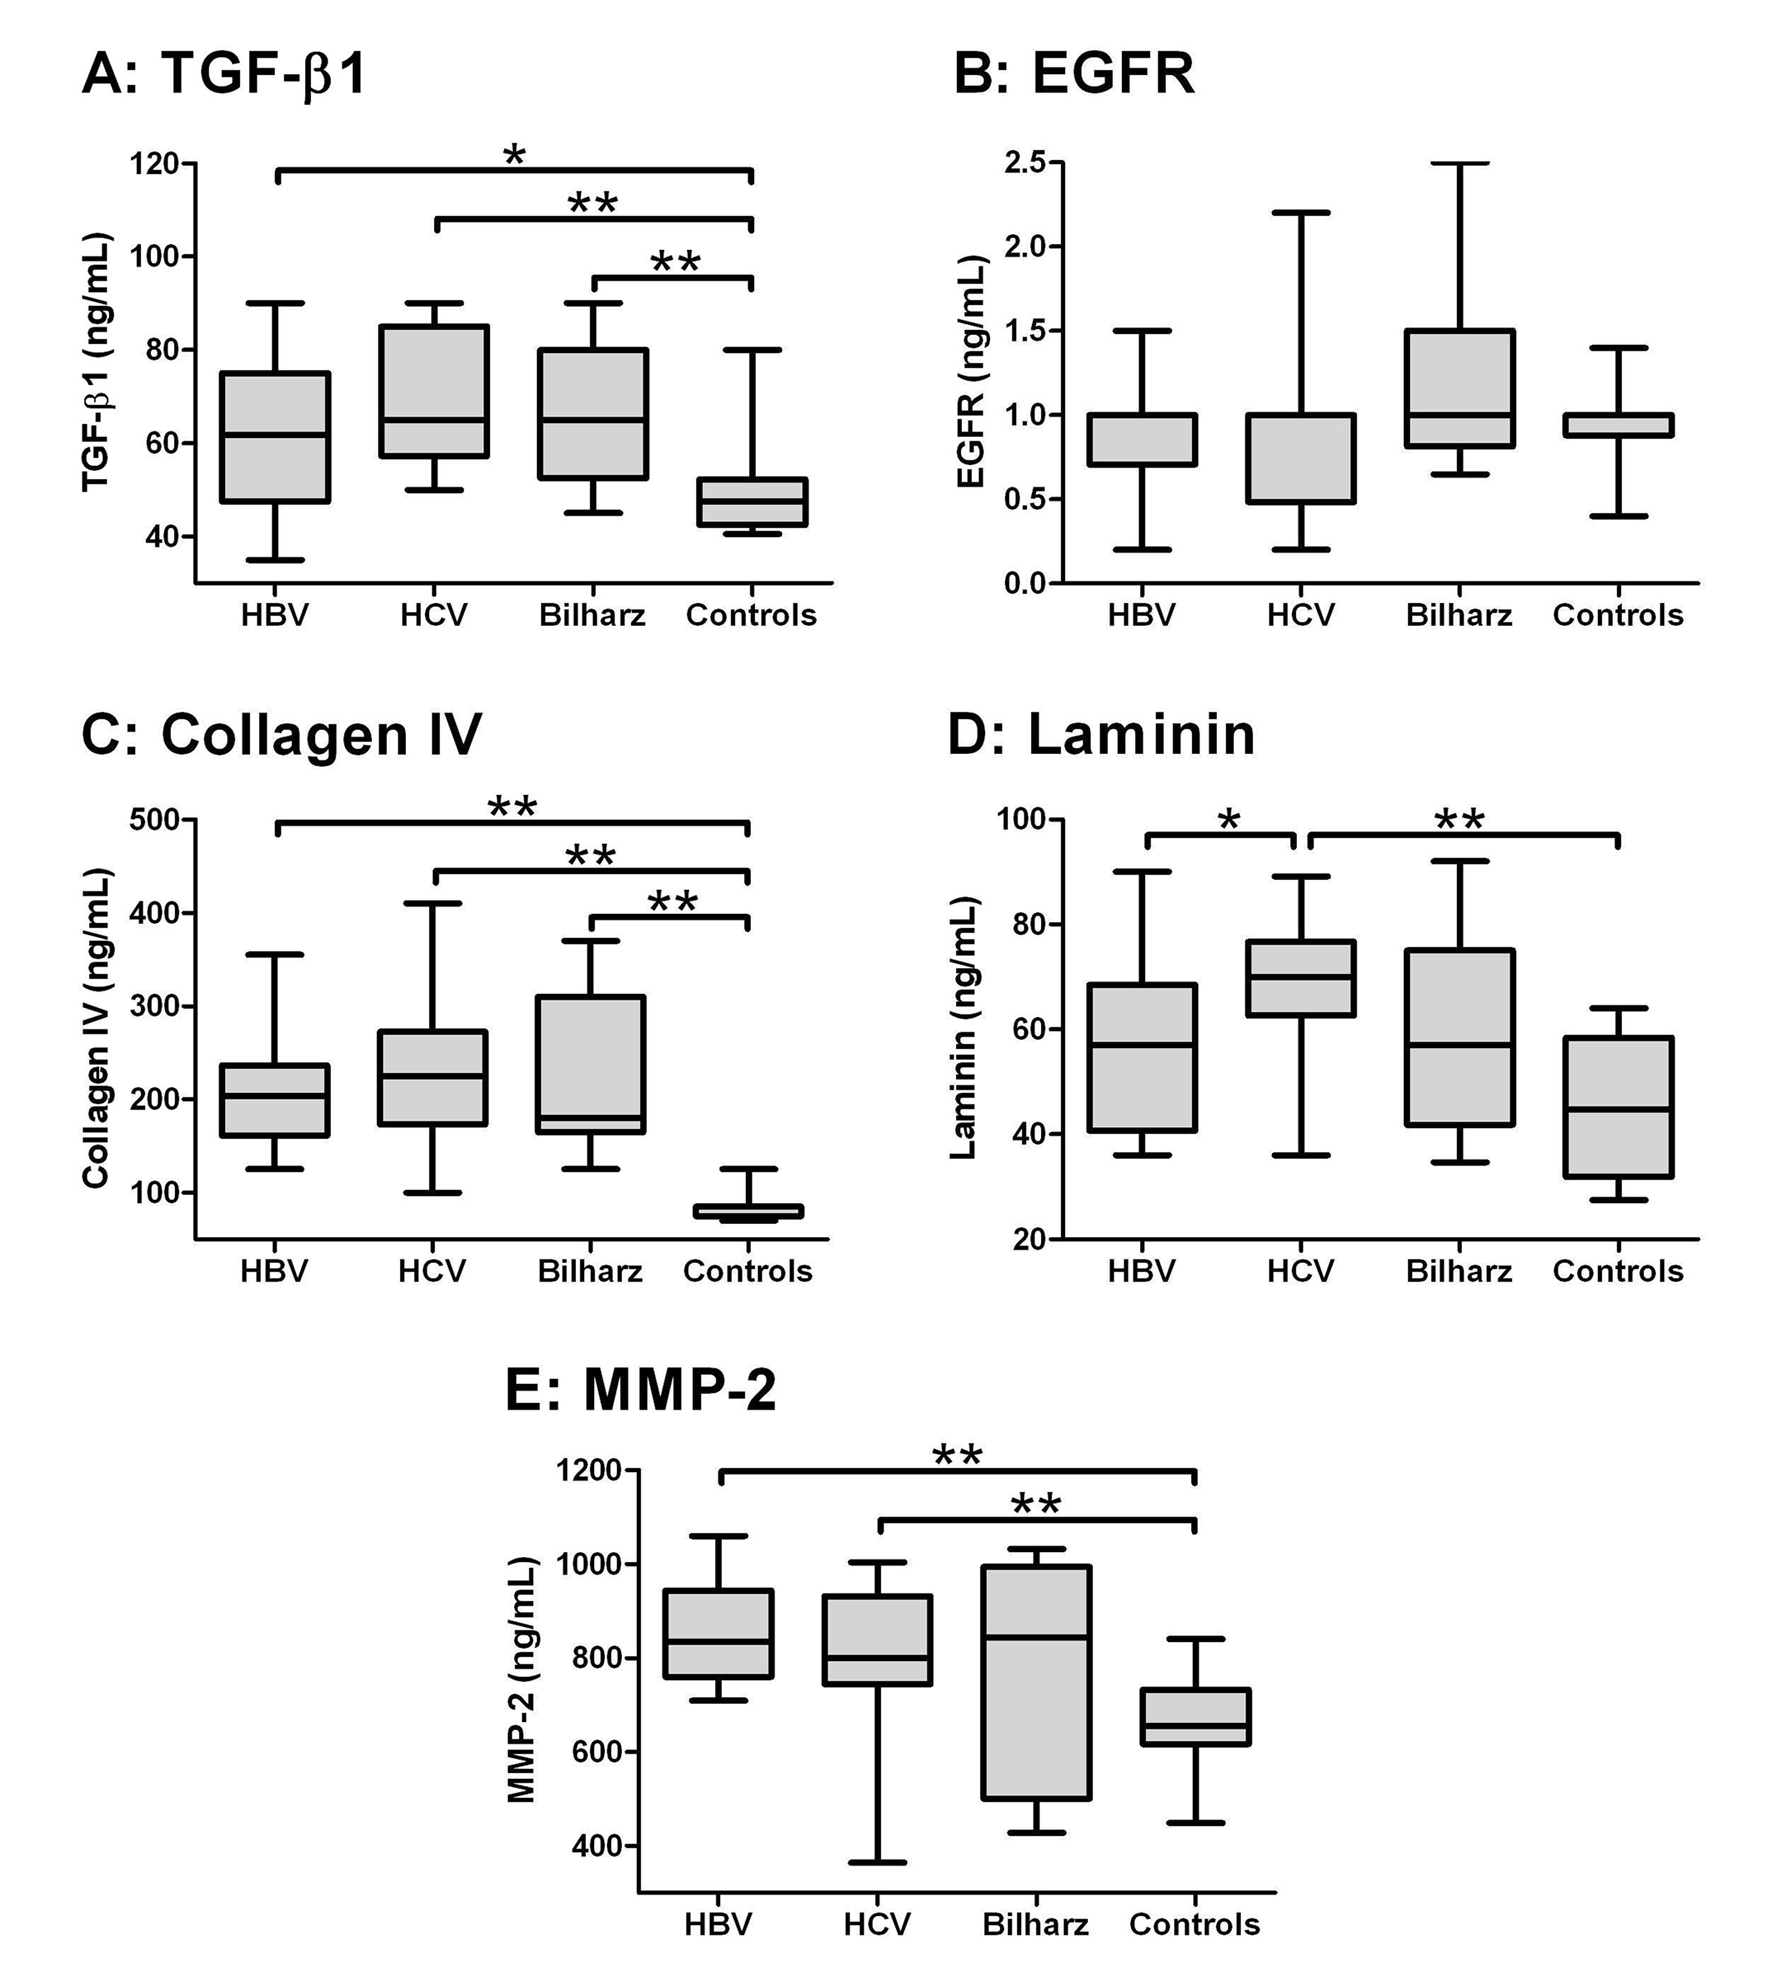
Figure 1. Box-and-whiskers plot for serum biochemical markers. The top and bottom of each box are the 25th and 75th centiles. The line through the box is the median and the error bars are the maximum and minimum. The horizontal bar represents the significance between the designated groups. * P ≤ 0.05 and ** P ≤ 0.01.
Figure 2.
Figure 2. Receiver-operator characteristic (ROC) curves of serum biochemical markers for prediction of significant fibrosis (Ishak score > 2). Data were analyzed considering patients with liver biopsy in the chronic hepatitis group. Among them collagen IV was the most sensitive and specific.

Tables

Table 1. Demographic, Clinical and Laboratory Characteristics of the Studied Patients
 
CharacteristicsHBV (n = 12)HCV (n = 29)Bilharziasis (n = 9)P-value
Quantitative data are expressed as mean ± SEM and qualitative data as number and %. Significance was tested using non-parametric Kruskal-Wallis test or Chi-square test. *P ≤ 0.05, **P ≤ 0.01
Age (years)Patients10.75 ± 1.0411.54 ± 0.6311.89 ± 1.10.206
Controls 10.5 ± 0.46
Male n (%)Patients10 (83.3%)22 (75.9%)9 (100%)0.355
Controls 22 (73.3%)
Hematemesis n (%)1 (8.3%)4 (13.8%)3 (33.3%)0.267
Epistaxis n (%)1 (8.3%)4 (13.8%)2 (22.2%)0.662
Hepatomegaly n (%)2 (16.6%)8 (27.6%)2 (22.2%)0.751
Splenomegaly n (%)7 (58.3%)19 (56.5%)8 (88.8%)0.301
Ascites n (%)2 (16.6%)4 (13.8%)3 (33.3%)0.506
Hb (g/dl)10.5 ± 0.4210.89 ± 0.3411.18 ± 0.390.659
WBCs (x 103/mm3)6.38 ± 0.957.2 ± 0.497.04 ± 0.670.624
Platelets (x 103/mm3)135.4 ± 17.3161.9 ± 14.1196.7 ± 17.030.64
TB (mg/dl)1.83 ± 0.221.32 ± 0.140.95 ± 0.160.026*
ALT (U/L)72.58 ± 12.41107.37 ± 28.130.67 ± 3.210.03*
AST (U/L)71.17 ± 10.76120.07 ± 21.7838.56 ± 6.090.002**
Albumin (g/dl)3.49 ± 0.193.57 ± 0.113.8 ± 0.10.35
Alkaline phosphatase (U/L)214.33 ± 41.18165.19 ± 28.8680.33 ± 12.420.02*
GGT (U/L)54.33 ± 15.9859.87 ± 11.0638.78 ± 9.640.61
PC (%)69.42 ± 6.0365.61 ± 2.4675.67 ± 4.10.163


Table 2. Serum Levels of Biochemical Markers in the Studied Groups
 
MarkerHBV
n = 12
HCV
n = 29
Bilharziasis
n = 9
All Patients
n = 50
Controls
n = 30
P-valueaP-valueb
aSignificance was tested between all patients (n = 50) versus controls (n = 30) using Mann-Whitney test.
bSignificance was tested among individual etiological (HBV, HCV and Bilharziasis) groups and controls using Kruskal-Wallis test.
** P < 0.01. Values are expressed as mean ± standard error of mean (SEM).
TGF-β1 (ng/ml)61.7 ± 4.968.7 ± 2.665.5 ± 5.2966.504 ± 2.1450.9 ± 2.20.000**0.000**
EGF-R (ng/ml)0.904 ± 0.10.929 ± 0.11.2 ± 0. 190.97 ± 0.070.88 ± 0.050.3150.699
Collagen IV (ng/ml)211.1 ± 19.4224.9 ± 14.3226.1 ± 29.5221.8 ± 10.785.6 ± 3.60.000**0.000**
Laminin (ng/ml)57.0 ± 4.868.9 ± 2.557.5 ± 6.664.05 ± 2.345.5 ± 2.40.000**0.000**
MMP-2 (ng/ml)849.3 ± 31.3787.6 ± 33.6762.2 ± 79.8797.87 ± 25.18653.4 ± 18.30.000**0.000**


Table 3. Correlation Analysis of Biochemical Markers With Age and Laboratory Parameters in All the Patients (n = 50) and With HAI and Stage of Fibrosis in Chronic Hepatitis B and C Patients Only (n = 19)
 
VariableTGF-β1EGFRCollage IVLamininMMP-2
r = correlation coefficient, *P ≤ 0.05, **P ≤ 0.01
EGFRr-0.25
P0.079
Collage IVr0.126-0.156
P0.3820.28
Lamininr0.0240.0340.205
P0.8670.8170.153
MMP-2r0.116-0.030-0.0180.048
P0.4230.8380.8990.739
Ager0.02-0.1220.2020.0440.103
P0.8920.3970.1590.7610.475
PLTr0.290.1470.0810.1960.159
P0.041*0.3080.5740.1720.27
TBILr-0.0630.109-0.0530.0930.068
P0.6630.4510.7160.520.637
ALTr-0.027-0.1940.0560.1870.021
P0.8540.1780.7010.1930.886
ASTr-0.083-0.1720.0140.186-0.125
P0.5680.2320.9240.1960.386
Albuminr0.1550.0170.099-0.0580.073
P0.2830.9060.4950.6870.616
ALPr0.047-0.213-0.0660.0330.236
P0.7460.1370.6480.8170.099
GGTr-0.060.0110.1230.1040.075
P0.680.9410.3950.4740.607
P.Cr0.0450.1030.042-0.0160.11
P0.7570.4760.7740.9120.448
HAIr-0.2260.1170.1380.6360.072
P0.3510.6350.5730.003**0.769
Fibrosis stager-0.1960.005-0.026-0.083-0.307
P0.4210.9850.9150.7340.201


Table 4. Diagnostic Performance of Serum Biochemical Markers in Predicting Significant Fibrosis and Cirrhosis in Chronic Hepatitis B and C Patients
 
MarkerAUROCP-valueCut-offSensitivitySpecificityPPVNPV
*P ≤ 0.05, **P ≤ 0.01
Significant Fibrosis (Ishak score > 2)
TGF-β10.740.01**54.878.671.473.376.9
Collagen IV0.940.000**132.592.991.491.592.8
Laminin0.820.001**60.971.477.175.772.9
MMP-20.770.004**74285.771.474.983.3
Cirrhosis (Ishak score 6)
TGF-β10.70.08957.585.766.67282.3
Collagen IV0.850.003**147.585.778.68085.1
Laminin0.760.031*63.771.48178.973.9
MMP-20.680.12674785.764.37081.8