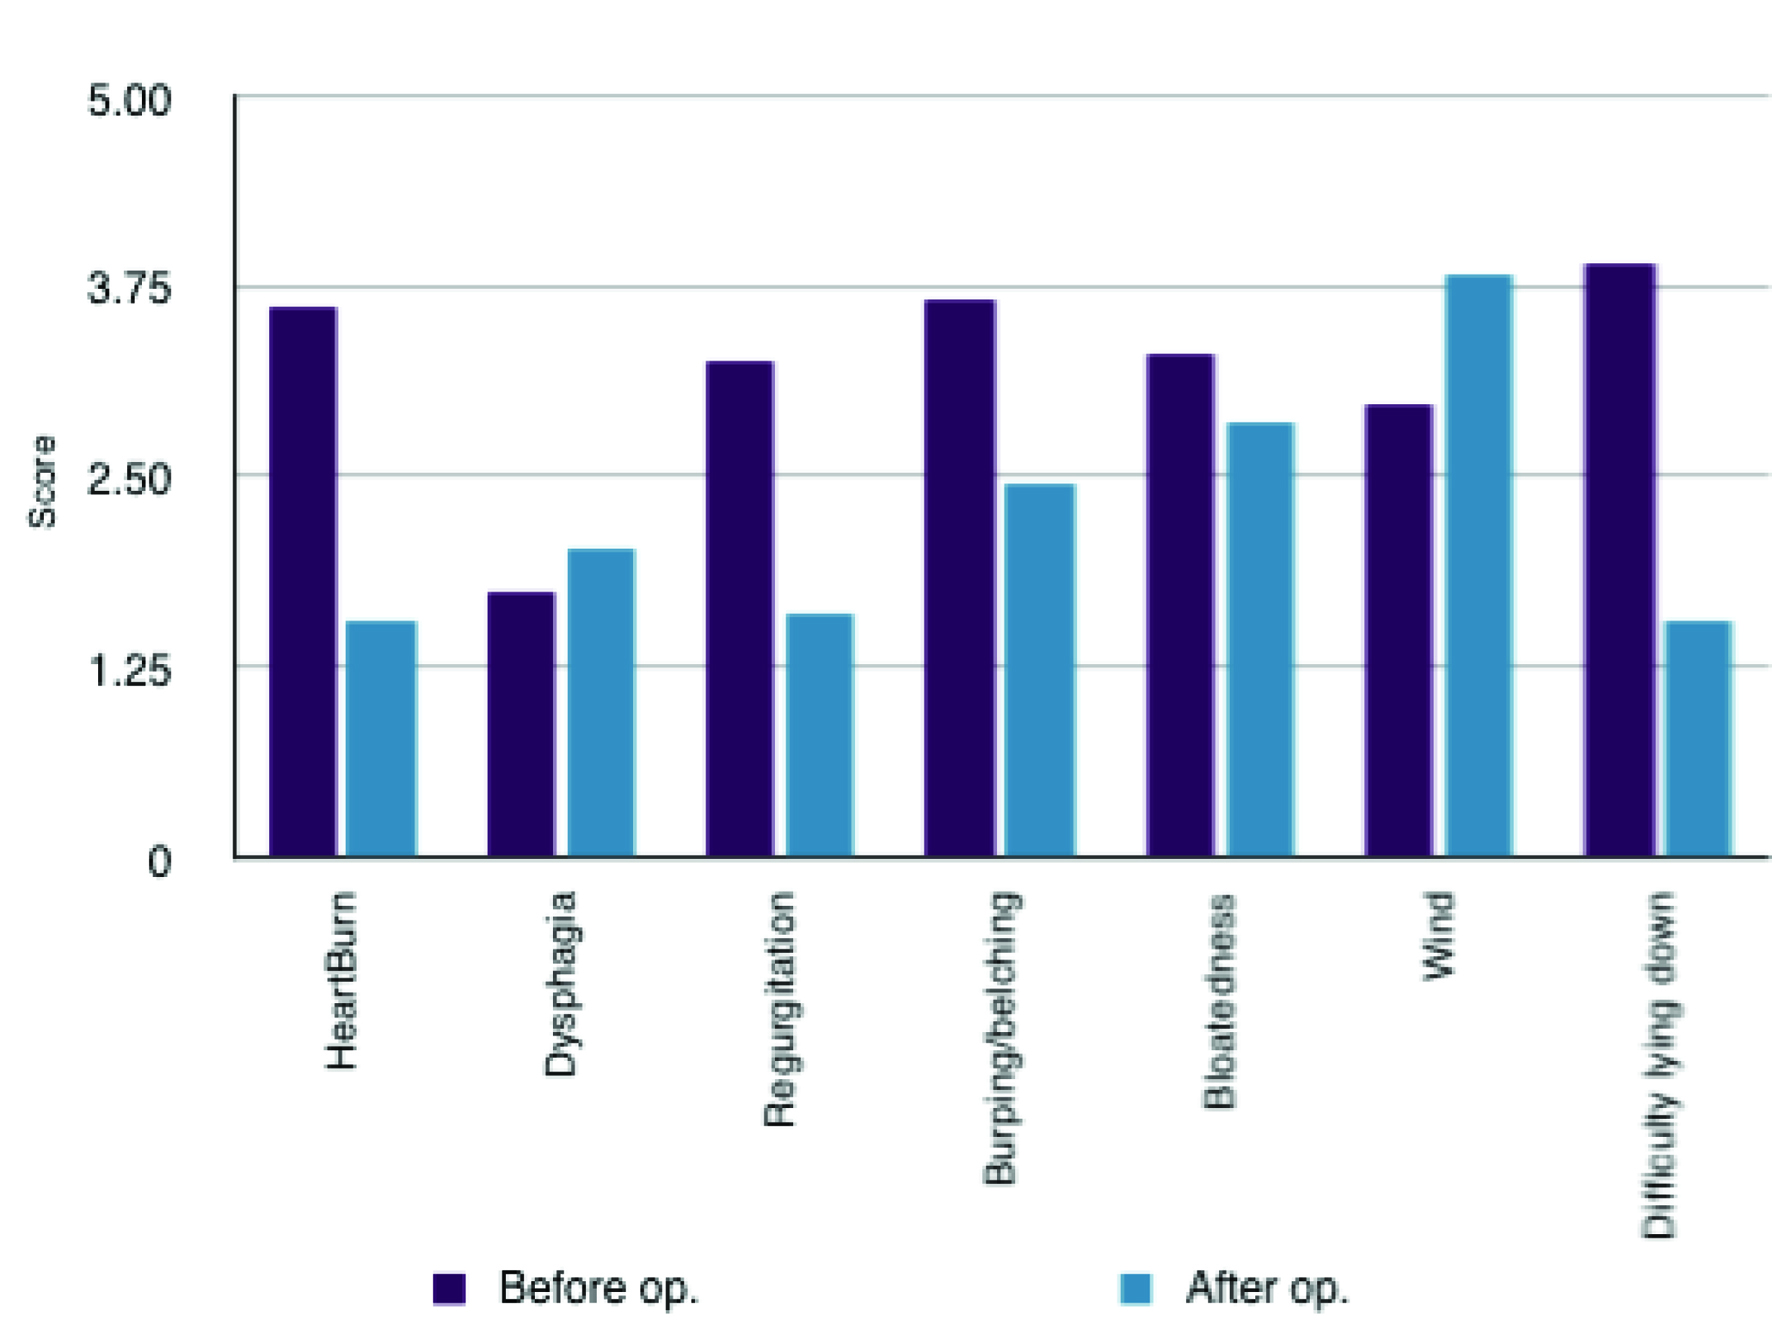
Figure 1. Comparison of symptomatology pre- and post-operatively.
| Gastroenterology Research, ISSN 1918-2805 print, 1918-2813 online, Open Access |
| Article copyright, the authors; Journal compilation copyright, Gastroenterol Res and Elmer Press Inc |
| Journal website http://www.gastrores.org |
Original Article
Volume 3, Number 4, August 2010, pages 163-166
Quality of Life and Symptomatology Before and After Nissen Fundoplication
Figures
Table
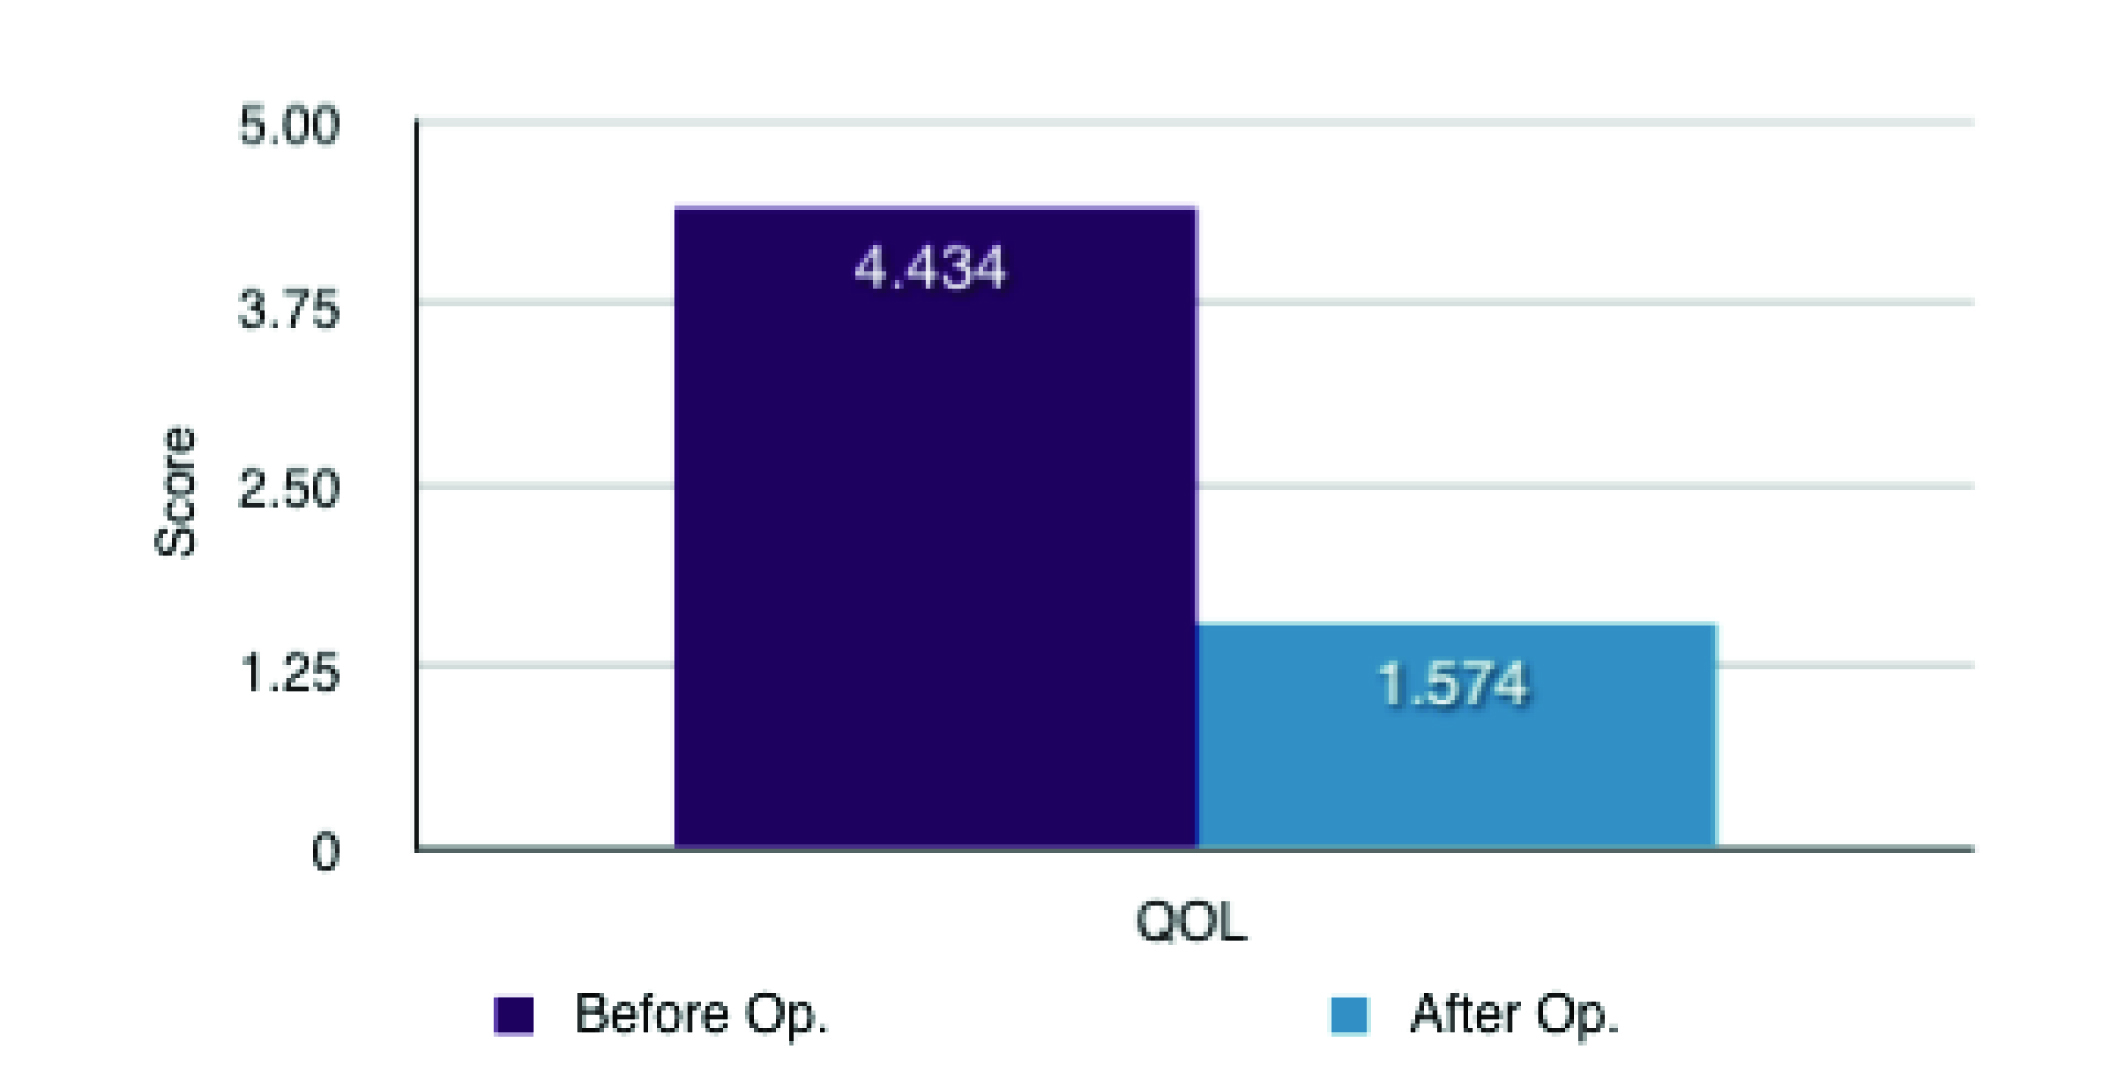
| Symptom | Average score before | Average score after | Mean of difference | C.I. (95%) | P value |
|---|---|---|---|---|---|
| Heartburn | 3.63 | 1.566 | 2.057 | (1.696, 2.417) | < 0.0001 |
| Dysphagia | 1.759 | 2.038 | 0.264 | (-0.639, 0.111) | 0.163 |
| Regurgitate | 3.259 | 1.623 | 1.679 | (1.164, 2.194) | < 0.0001 |
| Burping/Belching | 3.667 | 2.453 | 1.208 | (0.68, 1.735) | < 0.0001 |
| Bloatedness | 3.315 | 2.868 | 0.434 | (-0.121, 0.989) | 0.1229 |
| Flatulence | 2.981 | 3.83 | 0.868 | (0.419, 1.317) | 0.0003 |
| Diff. lying down | 3.907 | 1.566 | 2.358 | (1.922, 2.795) | < 0.0001 |
| QOL | 4.434 | 1.574 | 2.849 | (2.450, 3.247) | < 0.0001 |