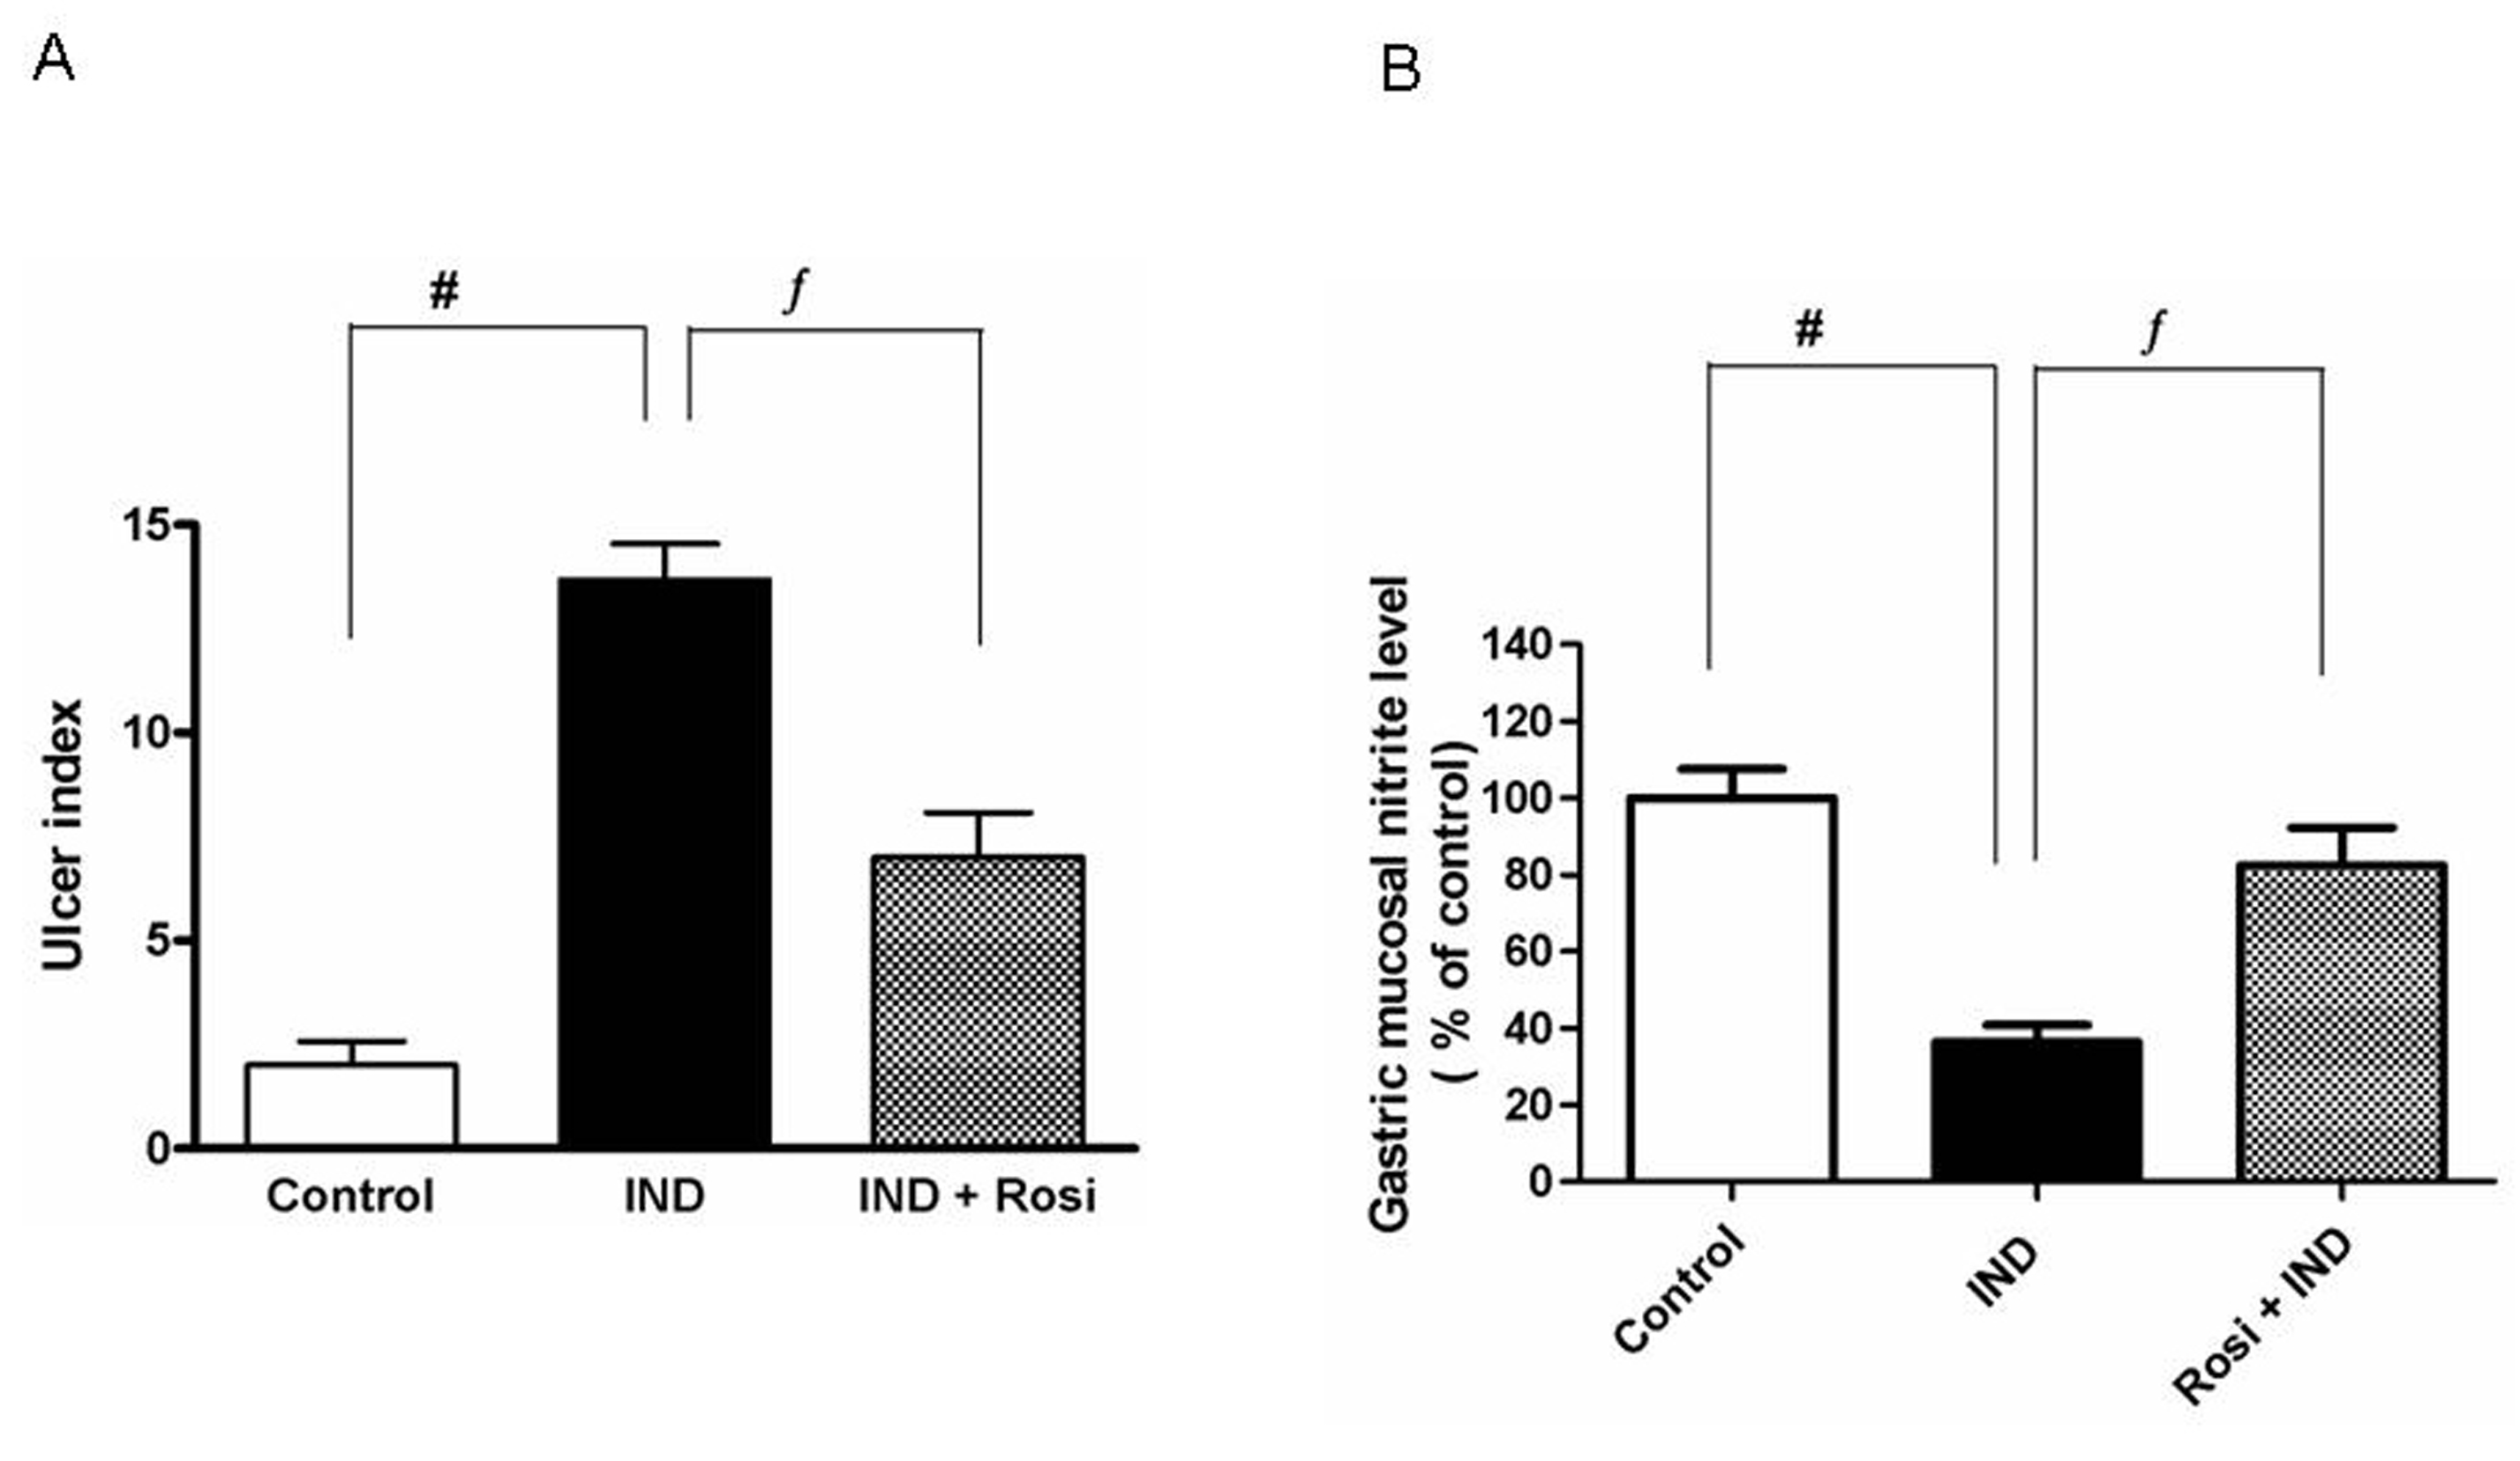
Figure 1. Effect of IND on the development of gastric mucosal lesions and gastric mucosal nitrite level. A, Effect of IND on the development of gastric mucosal lesions. Results are expressed as mean ± SEM of 8 rats. # is significantly different from control group; f significantly different from IND at P < 0.01 and P < 0.05, respectively. B, Effect of IND on gastric mucosal nitrite level. Results are expressed as mean ± SEM of observations from 8 rats (data are in pg/mg wet tissue normalized and expressed as % of control). # is significantly different from control group; ¦ is significantly different from IND at P < 0.01 and P < 0.05, respectively. Symbols as in Table 1.
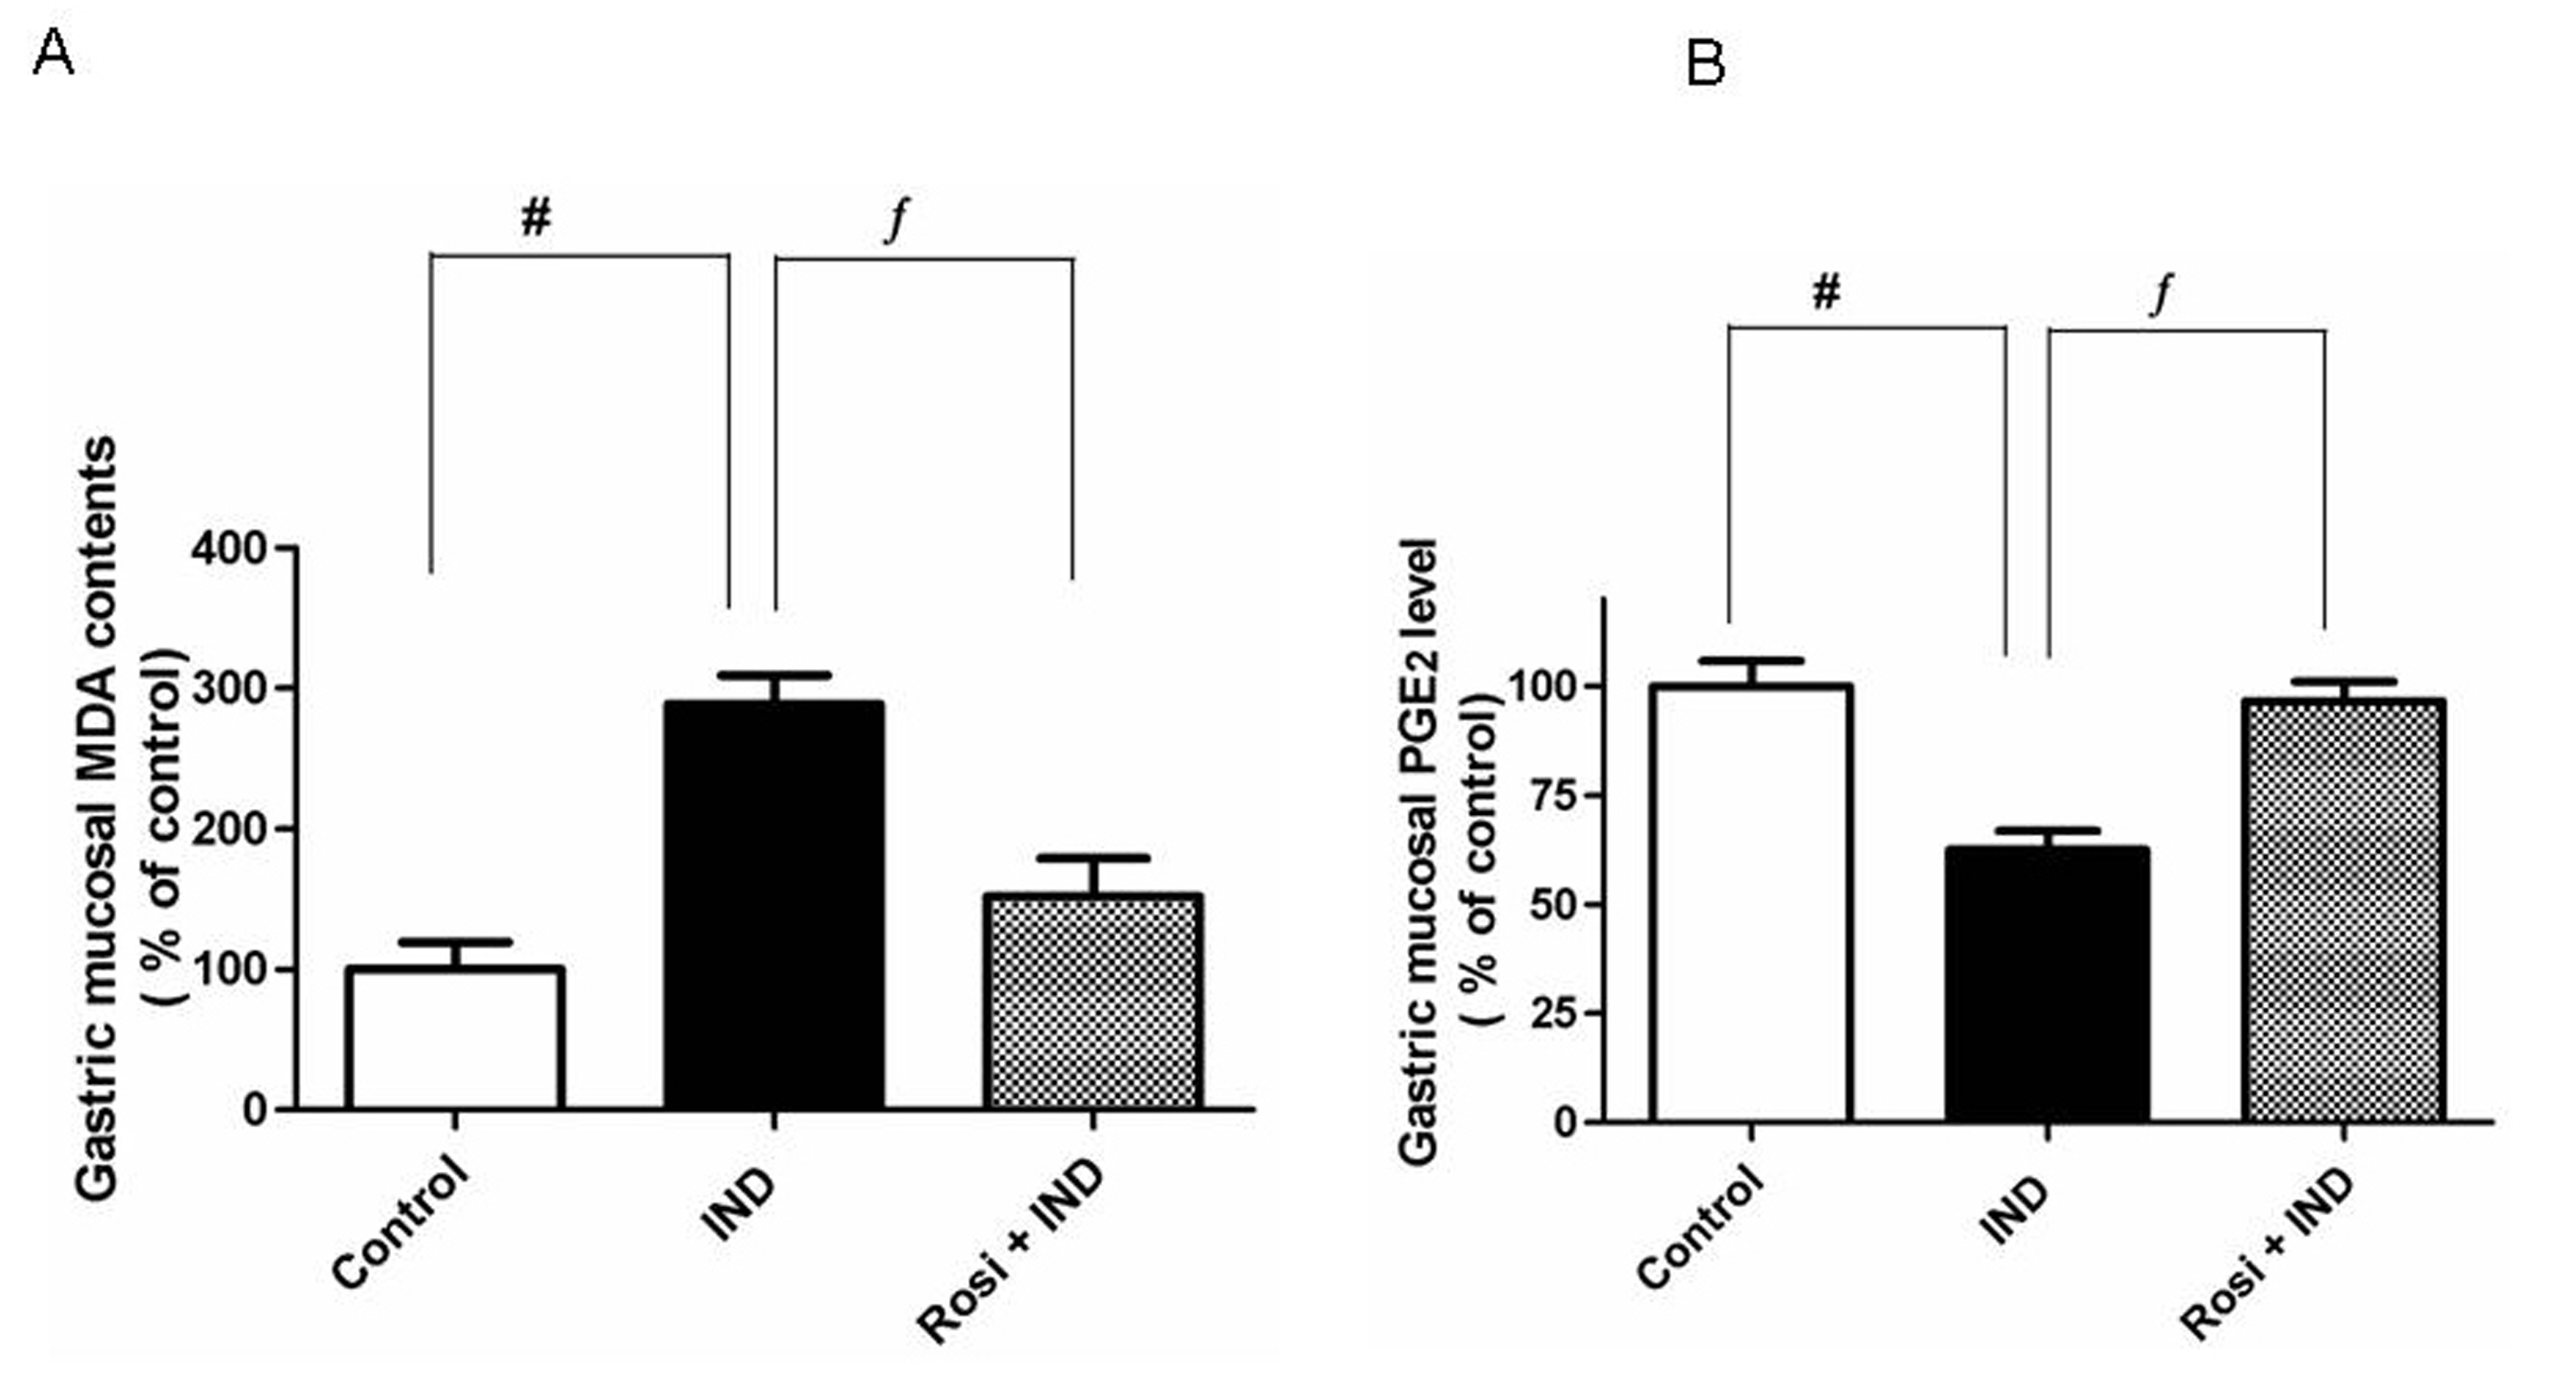
Figure 2. Effect of IND on gastric mucosal malondialdehyde (MDA) and gastric mucosal PGE2 levels. A, Effect of IND on gastric mucosal MDA level. Results are expressed as mean ± SEM of observations from 8 rats (data are in pg/mg wet tissue normalized and expressed as % of control). # is significantly different from control group; f is significantly different from IND at P < 0.001 and P < 0.05, respectively. B, Effect of IND on gastric mucosal PGE2 level. Results are expressed as mean ± SEM of observations from 8 rats (data are in pg/mg wet tissue normalized and expressed as % of control). # is significantly different from control group; f is significantly different from IND at P < 0.01 and P < 0.05, respectively. Symbols as in Table 1.
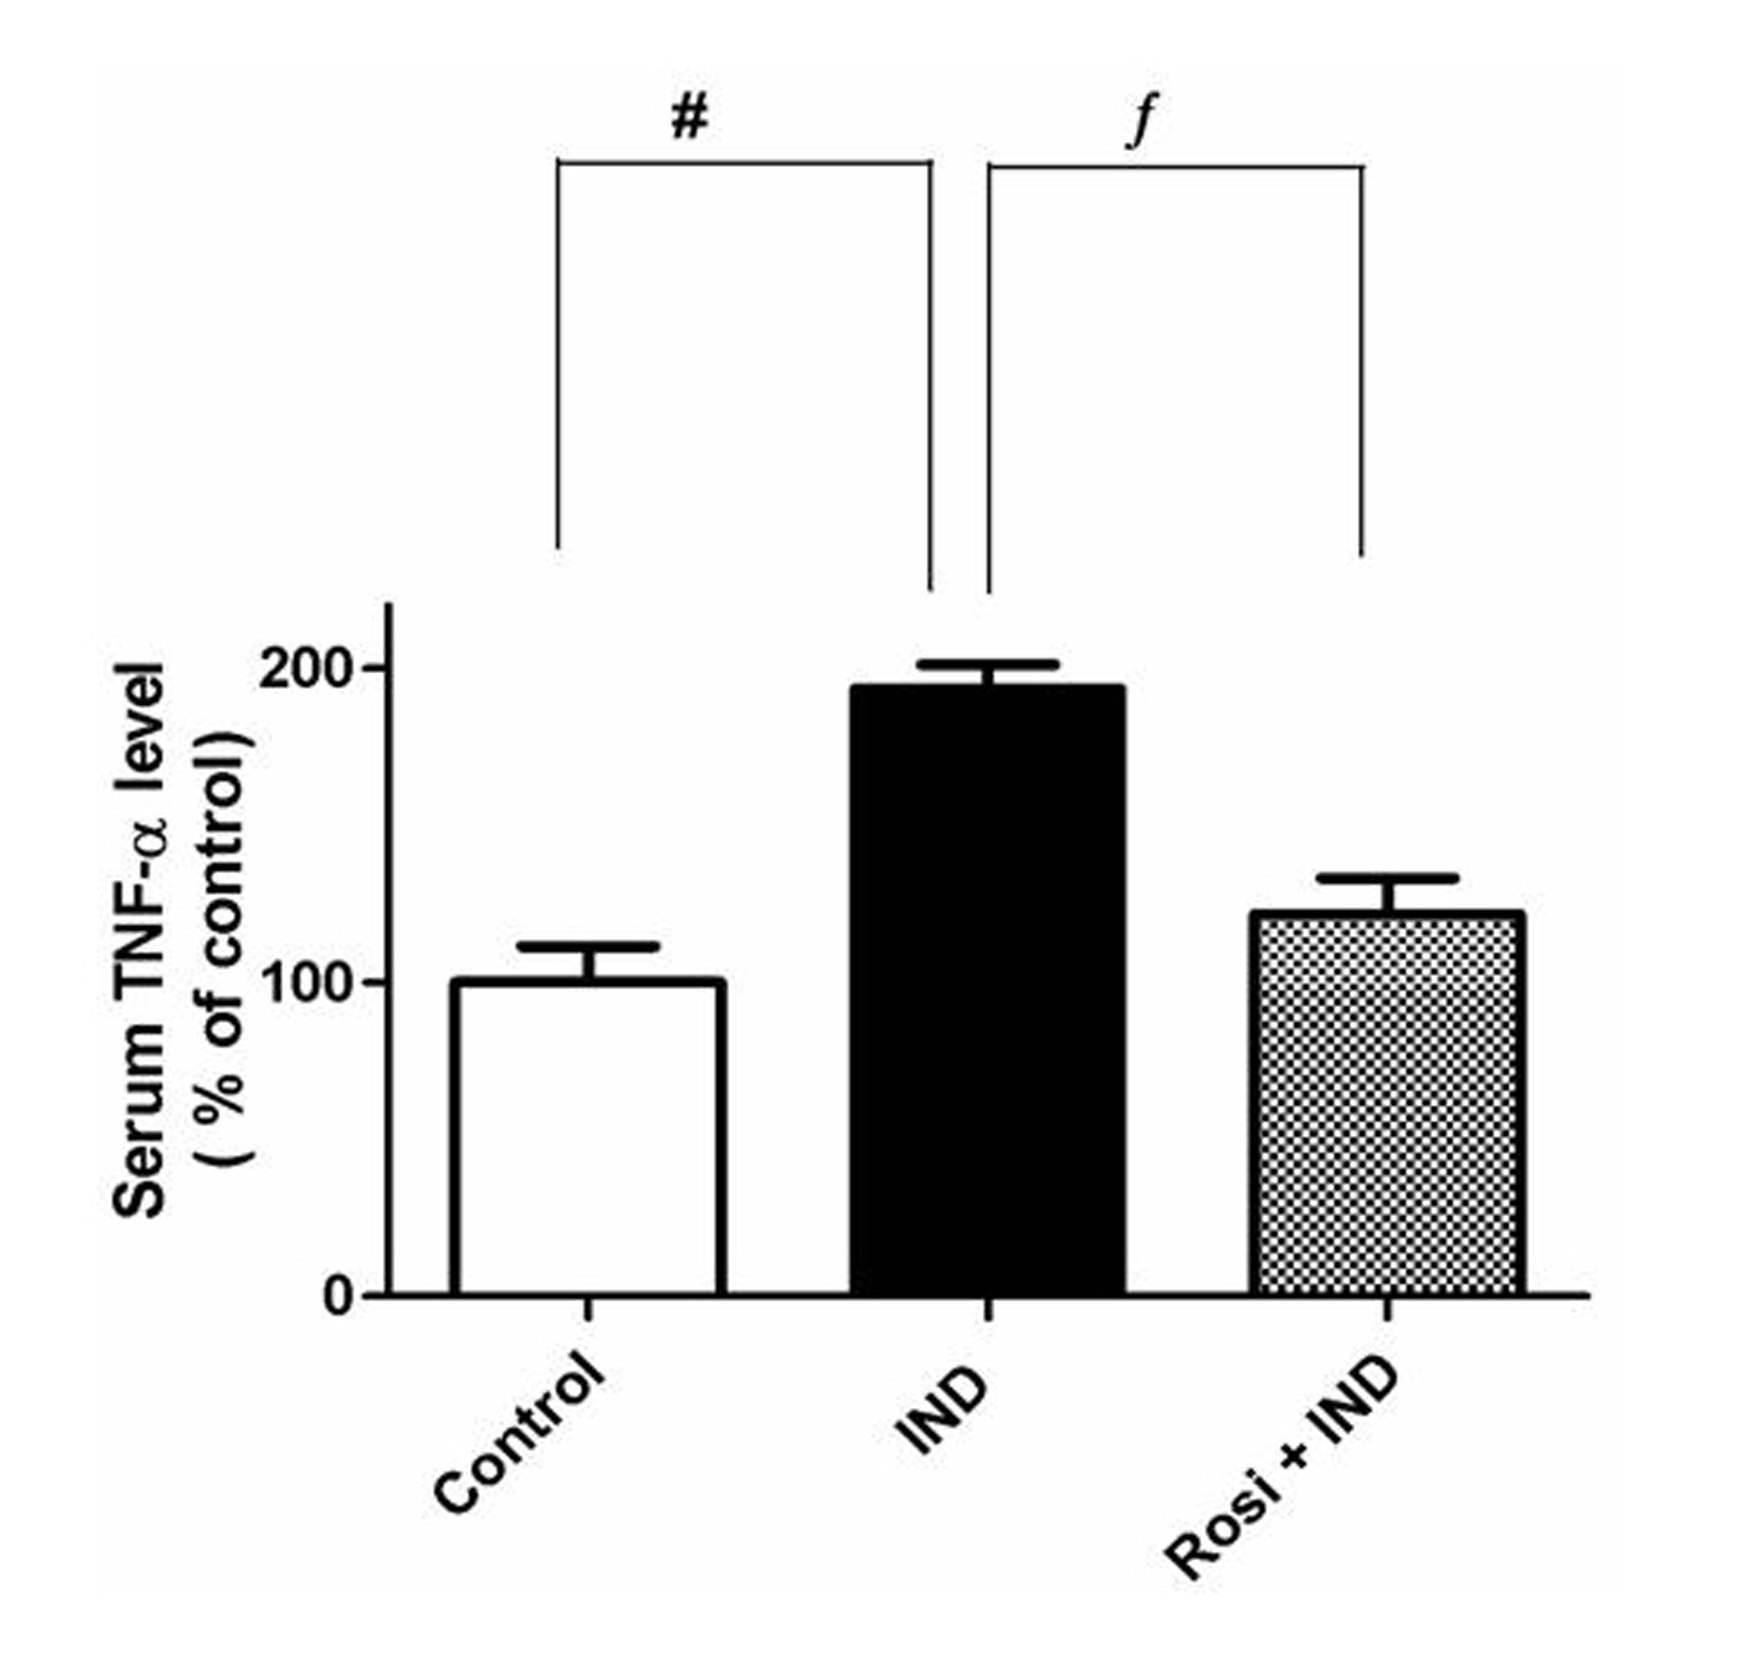
Figure 3. Effect of IND on the serum TNF-α level. Results are expressed as mean ± SEM of observations from 8 rats (data are in pg/mL normalized and expressed as % of control). # is significantly different from control group; f is significantly different from IND at P < 0.01 and P < 0.05, respectively. Symbols as in Table 1.