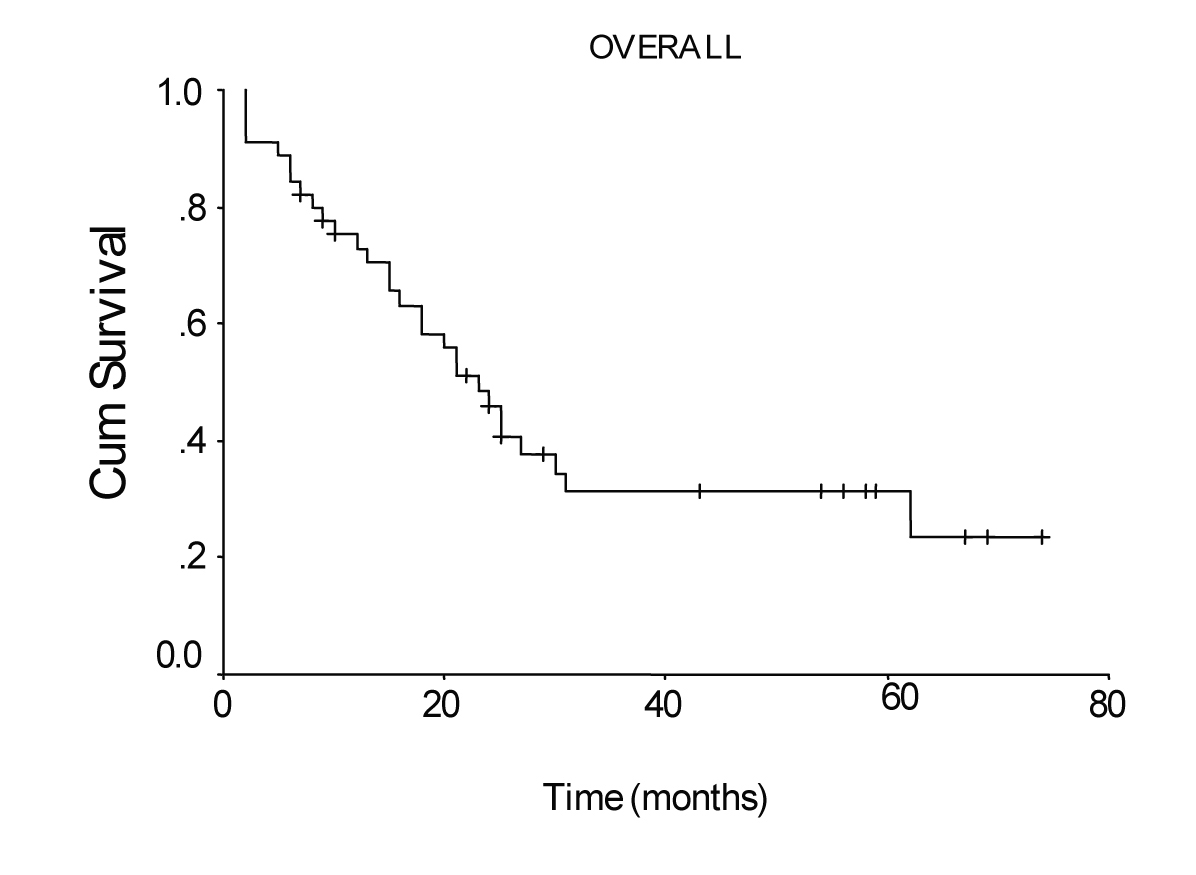
Figure 1. Overall survival curve of the patients with transmural gastric carcinoma calculated by the method of Kaplan-Meier.
| Gastroenterology Research, ISSN 1918-2805 print, 1918-2813 online, Open Access |
| Article copyright, the authors; Journal compilation copyright, Gastroenterol Res and Elmer Press Inc |
| Journal website http://www.gastrores.org |
Original Article
Volume 2, Number 6, December 2009, pages 317-323
Prognostic Factors of Patients With Transmural Advanced Gastric Carcinoma
Figures
Tables
| Parameters | No. of patients | 95% Confidence | Survival rate (%) | P† | ||||
|---|---|---|---|---|---|---|---|---|
| Median survival (month) ± SE | Interval | P* | 1-year | 3-years | 5-years | |||
| SE: Standard error, P *: Log-rank test, P†: Chi-square test, NS: Not significant | ||||||||
| Age (years) | NS | NS | ||||||
| ≤65 | 30 | 25.0 ± 7.25 | 27.88 – 48.77 | 52 | 40 | 20 | ||
| >65 | 15 | 16.0 ± 9.02 | 0 – 33.67 | 39 | 13 | 13 | ||
| Gender | NS | NS | ||||||
| Male | 27 | 21.0 ± 3.44 | 14.25 – 27.75 | 44 | 25 | 25 | ||
| Female | 18 | 27.0 ± 7.80 | 11.70 – 42.30 | 53 | 41 | 0 | ||
| Tumor location | NS | NS | ||||||
| Cardia | 9 | 30.0 ± 7.28 | 15.73 – 44.27 | 49 | 32 | 0 | ||
| Corpus | 11 | 18.0 ± 3.48 | 11.17 – 24.83 | 35 | 35 | 35 | ||
| Antrum | 22 | 24.0 ± 3.03 | 18.07 – 29.93 | 55 | 35 | 35 | ||
| Diffuse | 3 | 0 | 0 | - | - | - | ||
| Tumor size (cm) | NS | NS | ||||||
| >10 in diameter | 24 | 24.0 ± 5.30 | 13.61 – 34.39 | 54 | 36 | 18 | ||
| ≤10 in diameter | 21 | 21.0 ± 2.28 | 16.53 – 25.47 | 43 | 28 | 28 | ||
| Depth of tumor invasion | NS | NS | ||||||
| pT2 | 11 | 62.0 ± 19.12 | 24.52 – 99.48 | 53 | 53 | 26 | ||
| pT3 | 34 | 18.0 ± 5.38 | 7.45 – 28.55 | 46 | 26 | 18 | ||
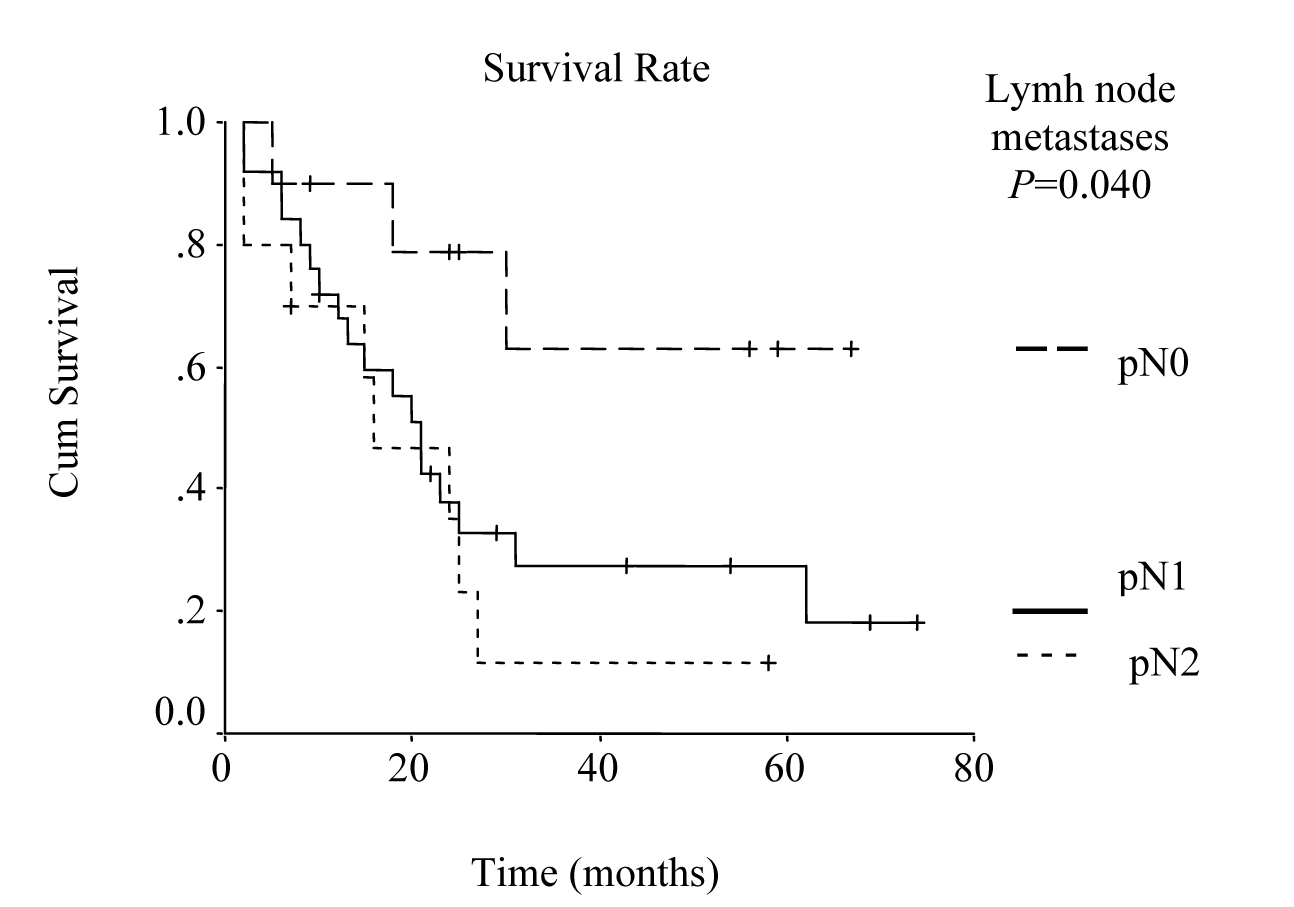
| Lymph node metastases | 0.04 | 0.03 | ||||||
| pN0 | 10 | - | - | 78 | 65 | 65 | ||
| pN1 | 25 | 21.0 ± 2.38 | 16.33 – 25.67 | 37 | 27 | 13 | ||
| pN2 | 10 | 16.0 ± 6.39 | 3.47 – 28.53 | 46 | 11 | 11 | ||
| Stage | NS | NS | ||||||
| I B | 3 | - | - | 100 | 100 | 100 | ||
| II | 16 | 21.0 ± 5.04 | 11.13 – 30.87 | 46 | 37 | 0 | ||
| III A | 17 | 18.0 ± 4.84 | 8.52 – 27.48 | 38 | 25 | 25 | ||
| III B | 9 | 24.0 ± 6.01 | 12.21 – 35.79 | 51 | 13 | - | ||
| Grading | 0.017 | NS | ||||||
| G1 | 6 | - | - | 100 | 100 | 100 | ||
| G2 | 6 | 21.0 ± 9.19 | 3.0 – 39.0 | 50 | 33 | 0 | ||
| G3 | 33 | 18.0 ± 3.39 | 11.36 – 24.64 | 38 | 19 | 19 | ||
| Type of Surgery | NS | NS | ||||||
| Subtotal gastrectomy | 22 | 24.0 ± 3.03 | 18.07 – 29.93 | 55 | 35 | 35 | ||
| Total gastrectomy | 23 | 20.0 ± 3.16 | 13.81 – 26.19 | 41 | 28 | 0 | ||
| Vascular invasion | NS | NS | ||||||
| Absent | 26 | 25.0 ± 5.07 | 15.07 – 34.93 | 54 | 35 | 35 | ||
| Present | 19 | 21.0 ± 2.05 | 16.99 – 25.01 | 39 | 26 | 9 | ||
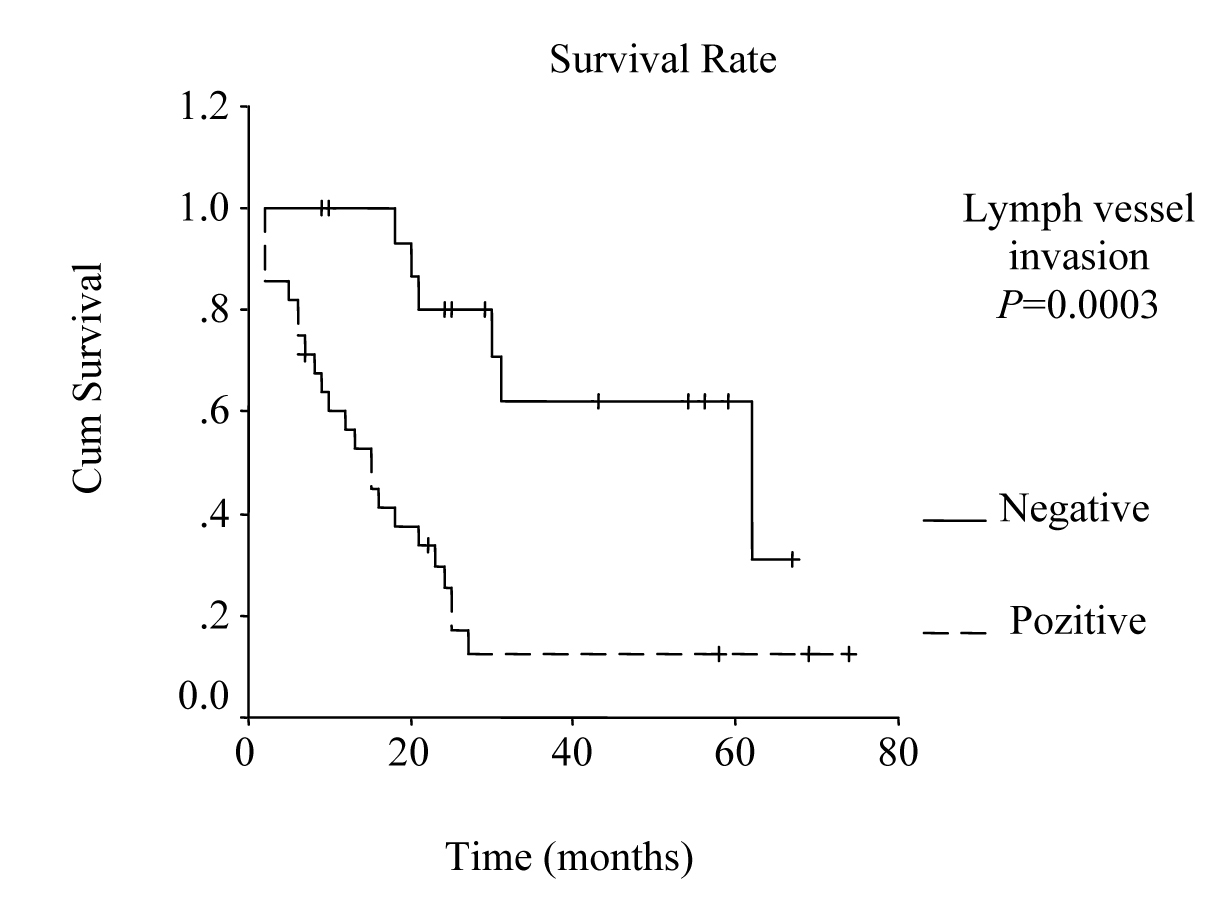
| Lymph vessel invasion | 0.0003 | 0.001 | ||||||
| Absent | 17 | 62.0 ± 22.96 | 17.0 – 107.0 | 80 | 64 | 22 | ||
| Present | 28 | 15.0 ± 2.55 | 10.01 – 19.99 | 29 | 12 | 12 | ||
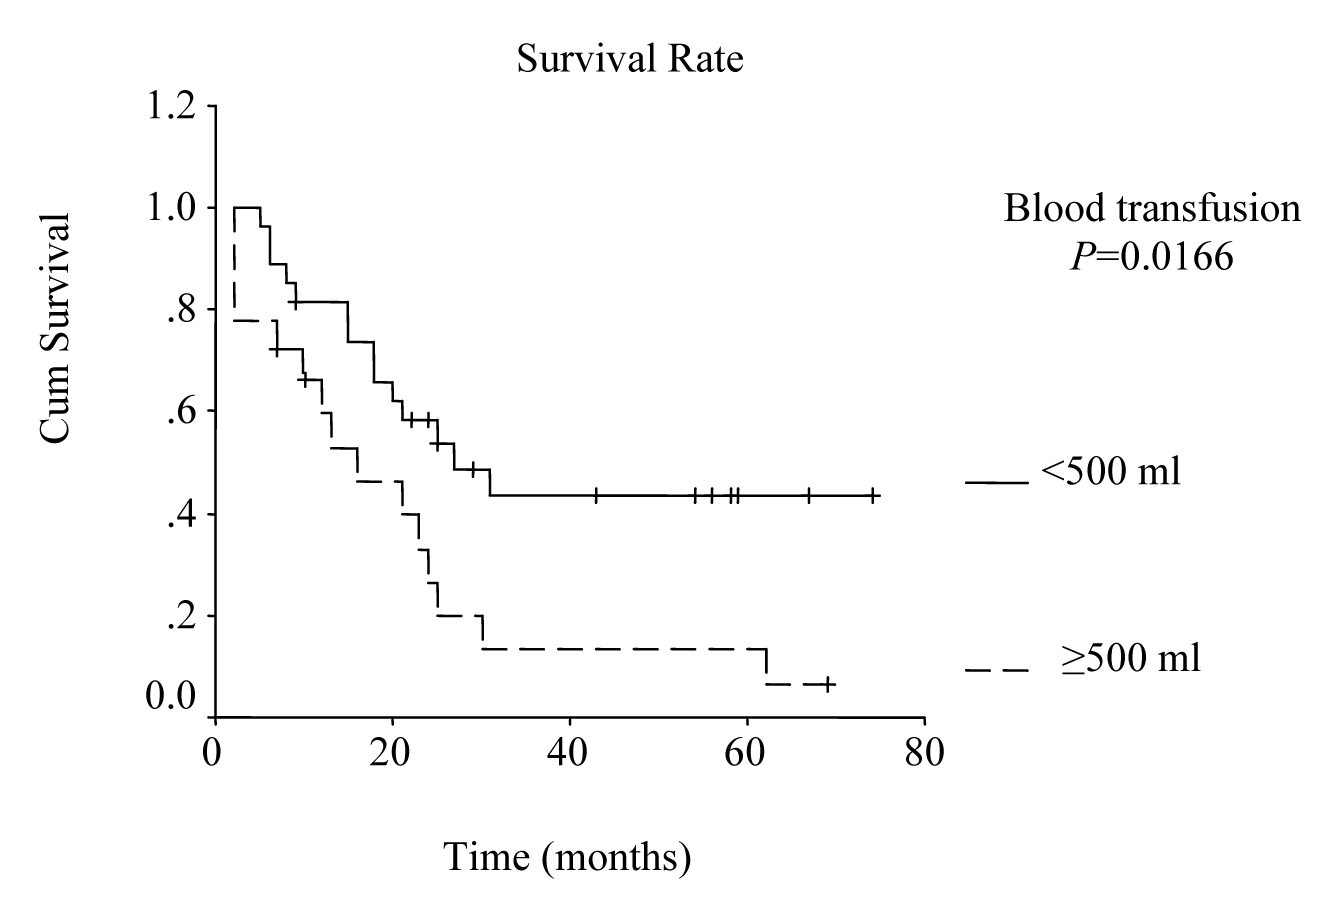
| Blood transfusions | 0.0166 | 0.021 | ||||||
| < 500 ml | 27 | 27.0 ± 6.85 | 13.58 – 40.42 | 57 | 44 | 44 | ||
| ≥ 500 ml | 18 | 16.0 ± 5.63 | 4.97 – 27.03 | 32 | 13 | 4 | ||
| Lauren’s classification | NS | NS | ||||||
| Intestinal | 16 | 25.0 ± 6.0 | 13.24 – 36.76 | 63 | 42 | 42 | ||
| Diffuse | 29 | 18.0 ± 3.62 | 10.90 – 25.10 | 39 | 25 | 8 | ||
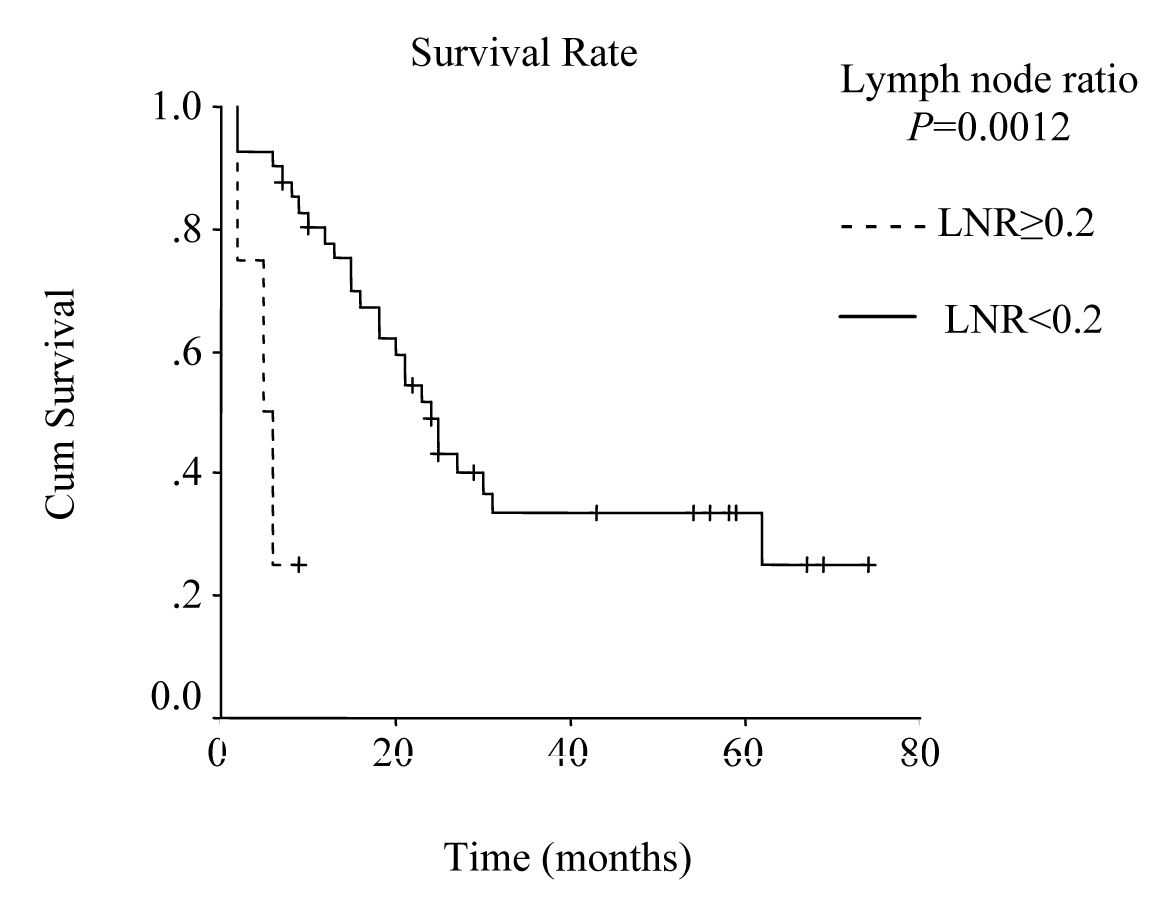
| Lymph node ratio | 0.0012 | 0.006 | ||||||
| LNR < 0.2 | 12 | 24.0 ± 2.45 | 19.19 – 28.81 | 52 | 34 | 20 | ||
| LNR ≥ 0.2 | 33 | 5.0 ± 2.0 | 1.08 – 8.92 | - | - | - | ||
| All patients | 45 | 23.0 ± 2.51 | 18.07 – 27.93 | 48 | 31 | 19 | ||
| Parameters | RR | 95% CI | P |
|---|---|---|---|
| P: Cox’s proportional hazards model. CI: Confidence Interval. RR: Relative Risk. | |||
| Lymph node metastases | |||
| (pN1 vs pN0) | 1.11 | 0.285 – 4.341 | 0.877 |
| (pN2 vs pN0) | 1.46 | 0.282 – 7.544 | 0.652 |
| Lymph vessel invasion (Extensive vs not extensive) | 1.39 | 0.444 – 4.379 | 0.559 |
| Blood transfusions (≥ 500 ml vs < 500 ml) | 1.01 | 0.433 – 2.362 | 0.979 |
| Lymph node ratio (≥ 0.2 vs < 0.2) | 4.47 | 1.168 – 17.117 | 0.029 |