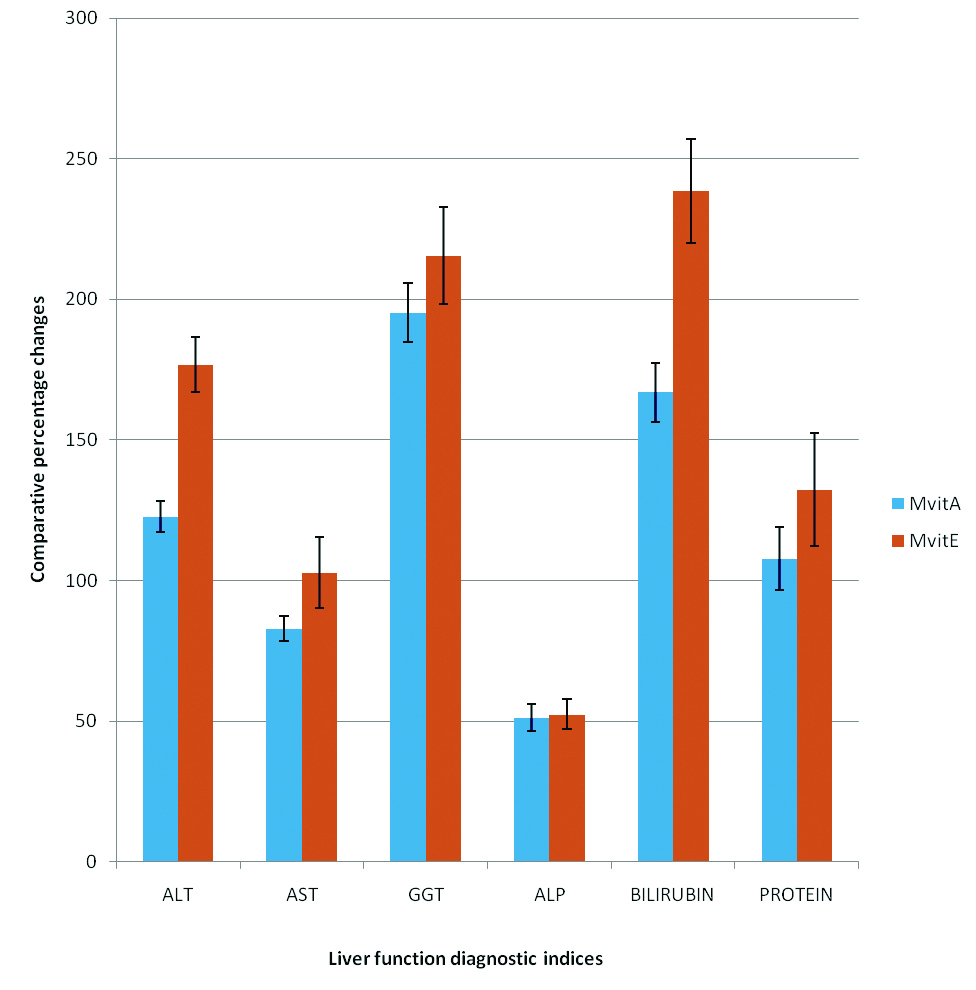
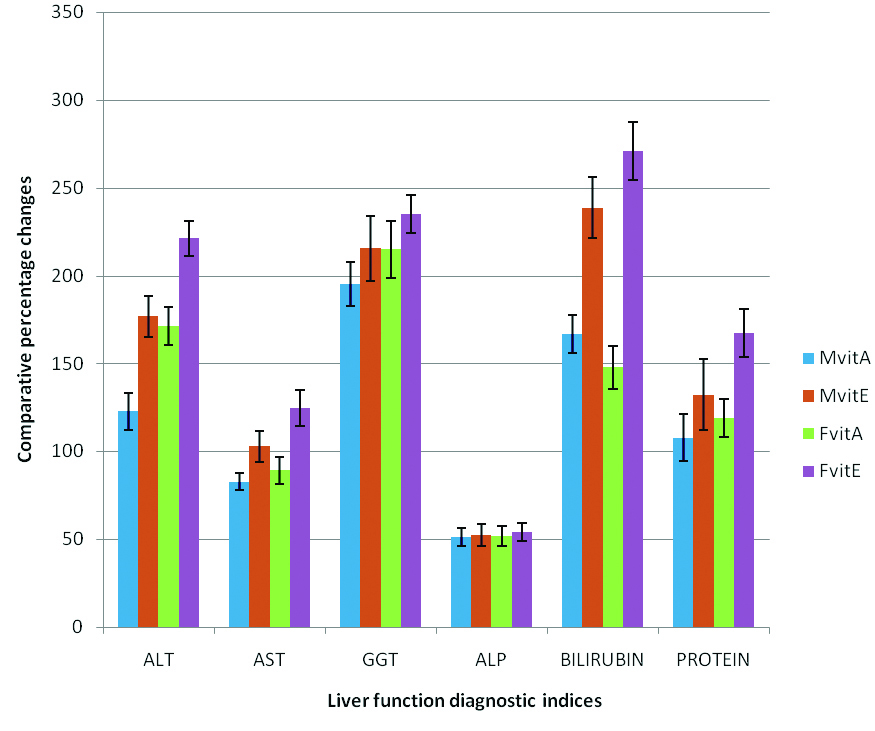
Figure 1. Comparative effect of gasoline vapors on some liver function diagnostic indices in male and female rats.
| Gastroenterology Research, ISSN 1918-2805 print, 1918-2813 online, Open Access |
| Article copyright, the authors; Journal compilation copyright, Gastroenterol Res and Elmer Press Inc |
| Journal website http://www.gastrores.org |
Original Article
Volume 2, Number 5, October 2009, pages 295-302
Comparative Hepatoprotective Effect of Vitamins A and E Against Gasoline Vapor Toxicity in Male and Female Rats
Figures
Tables
| Group | ALT (U/L) | AST (U/L) | GGT (U/L) | ALP (U/L) | Bilirubin (µmol/L) | Total Protein(mg/dl) |
|---|---|---|---|---|---|---|
| Values are presented as mean ± SEM, n = 6, *P < 0.05 compared with group I (control); +P < 0.05 compared with group II; **P < 0.05 compared with group III; #P > 0.05 compared with group I. Mc = male control; Mt = male test, exposed to gasoline vapors only; MvitA = male test treated with vitamin A; MvitE = male test treated with vitamin E. | ||||||
| I (Mc) | 10.01 ± 2.14 | 20.67 ± 2.72 | 28.75 ± 2.30 | 269.65 ± 12.10 | 2.84 ± 0.60 | 6.75 ± 1.50 |
| II (Mt) | 25.05 ± 2.10* | 40.25 ± 1.80* | 88.20 ± 3.20* | 408.36 ± 16.22* | 8.06 ± 1.02* | 2.85 ± 2.74* |
| III (MvitA) | 11.25 ± 2.24+,# | 22.02 ±1.60+,# | 29.87 ± 2.34+,# | 270.10 ± 20.16+,# | 3.02 ± 2.10+,# | 5.92 ± 2.60+,# |
| IV (MvitE) | 9.05 ± 2.53**,# | 19.85 ± 1.30**,# | 27.96 ± 1.96**,# | 267.98 ± 20.23**,# | 2.38 ± 0.3 **,# | 6.62 ± 2.56**,# |
| Group | ALT (U/L) | AST (U/L) | GGT (U/L) | ALP (U/L) | Bilirubin (µmol/L) | Total Protein (mg/dl) |
|---|---|---|---|---|---|---|
| Values are presented as mean ± SEM, n = 6, *P < 0.05 compared with group I (control); +P < 0.05 compared with group II; **P < 0.05 compared with group III; #P > 0.05 compared with group I. Fc = female control; Ft = female test, exposed to gasoline vapours only; FvitA = female test treated with vitamin A; FvitE = female test treated with vitamin E. | ||||||
| V (Fc) | 9.35 ± 2.06 | 20.02 ± 2.46 | 27.73 ± 2.83 | 268.85 ± 13.12 | 2.56 ± 0.85 | 5.96 ± 1.82 |
| VI (Ft) | 27.18 ± 2.31* | 41.01 ± 1.46* | 90.01 ± 4.32* | 411.63 ± 17.42* | 8.38 ± 1.32* | 2.55 ± 2.74* |
| VII (FvitA) | 10.02 ± 2.24+,# | 21.68 ± 2.06+,# | 28.58 ± 2.83+,# | 271.16 ± 18.15+,# | 3.38 ± 2.10+,# | 5.58 ± 2.60+,# |
| VIII (FvitE) | 8.46 ± 2.53**,# | 18.26 ± 1.23**,# | 26.86 ± 2.06**,# | 266.94 ± 20.52**,# | 2.26 ± 0.3 **,# | 6.82 ± 2.56**,# |