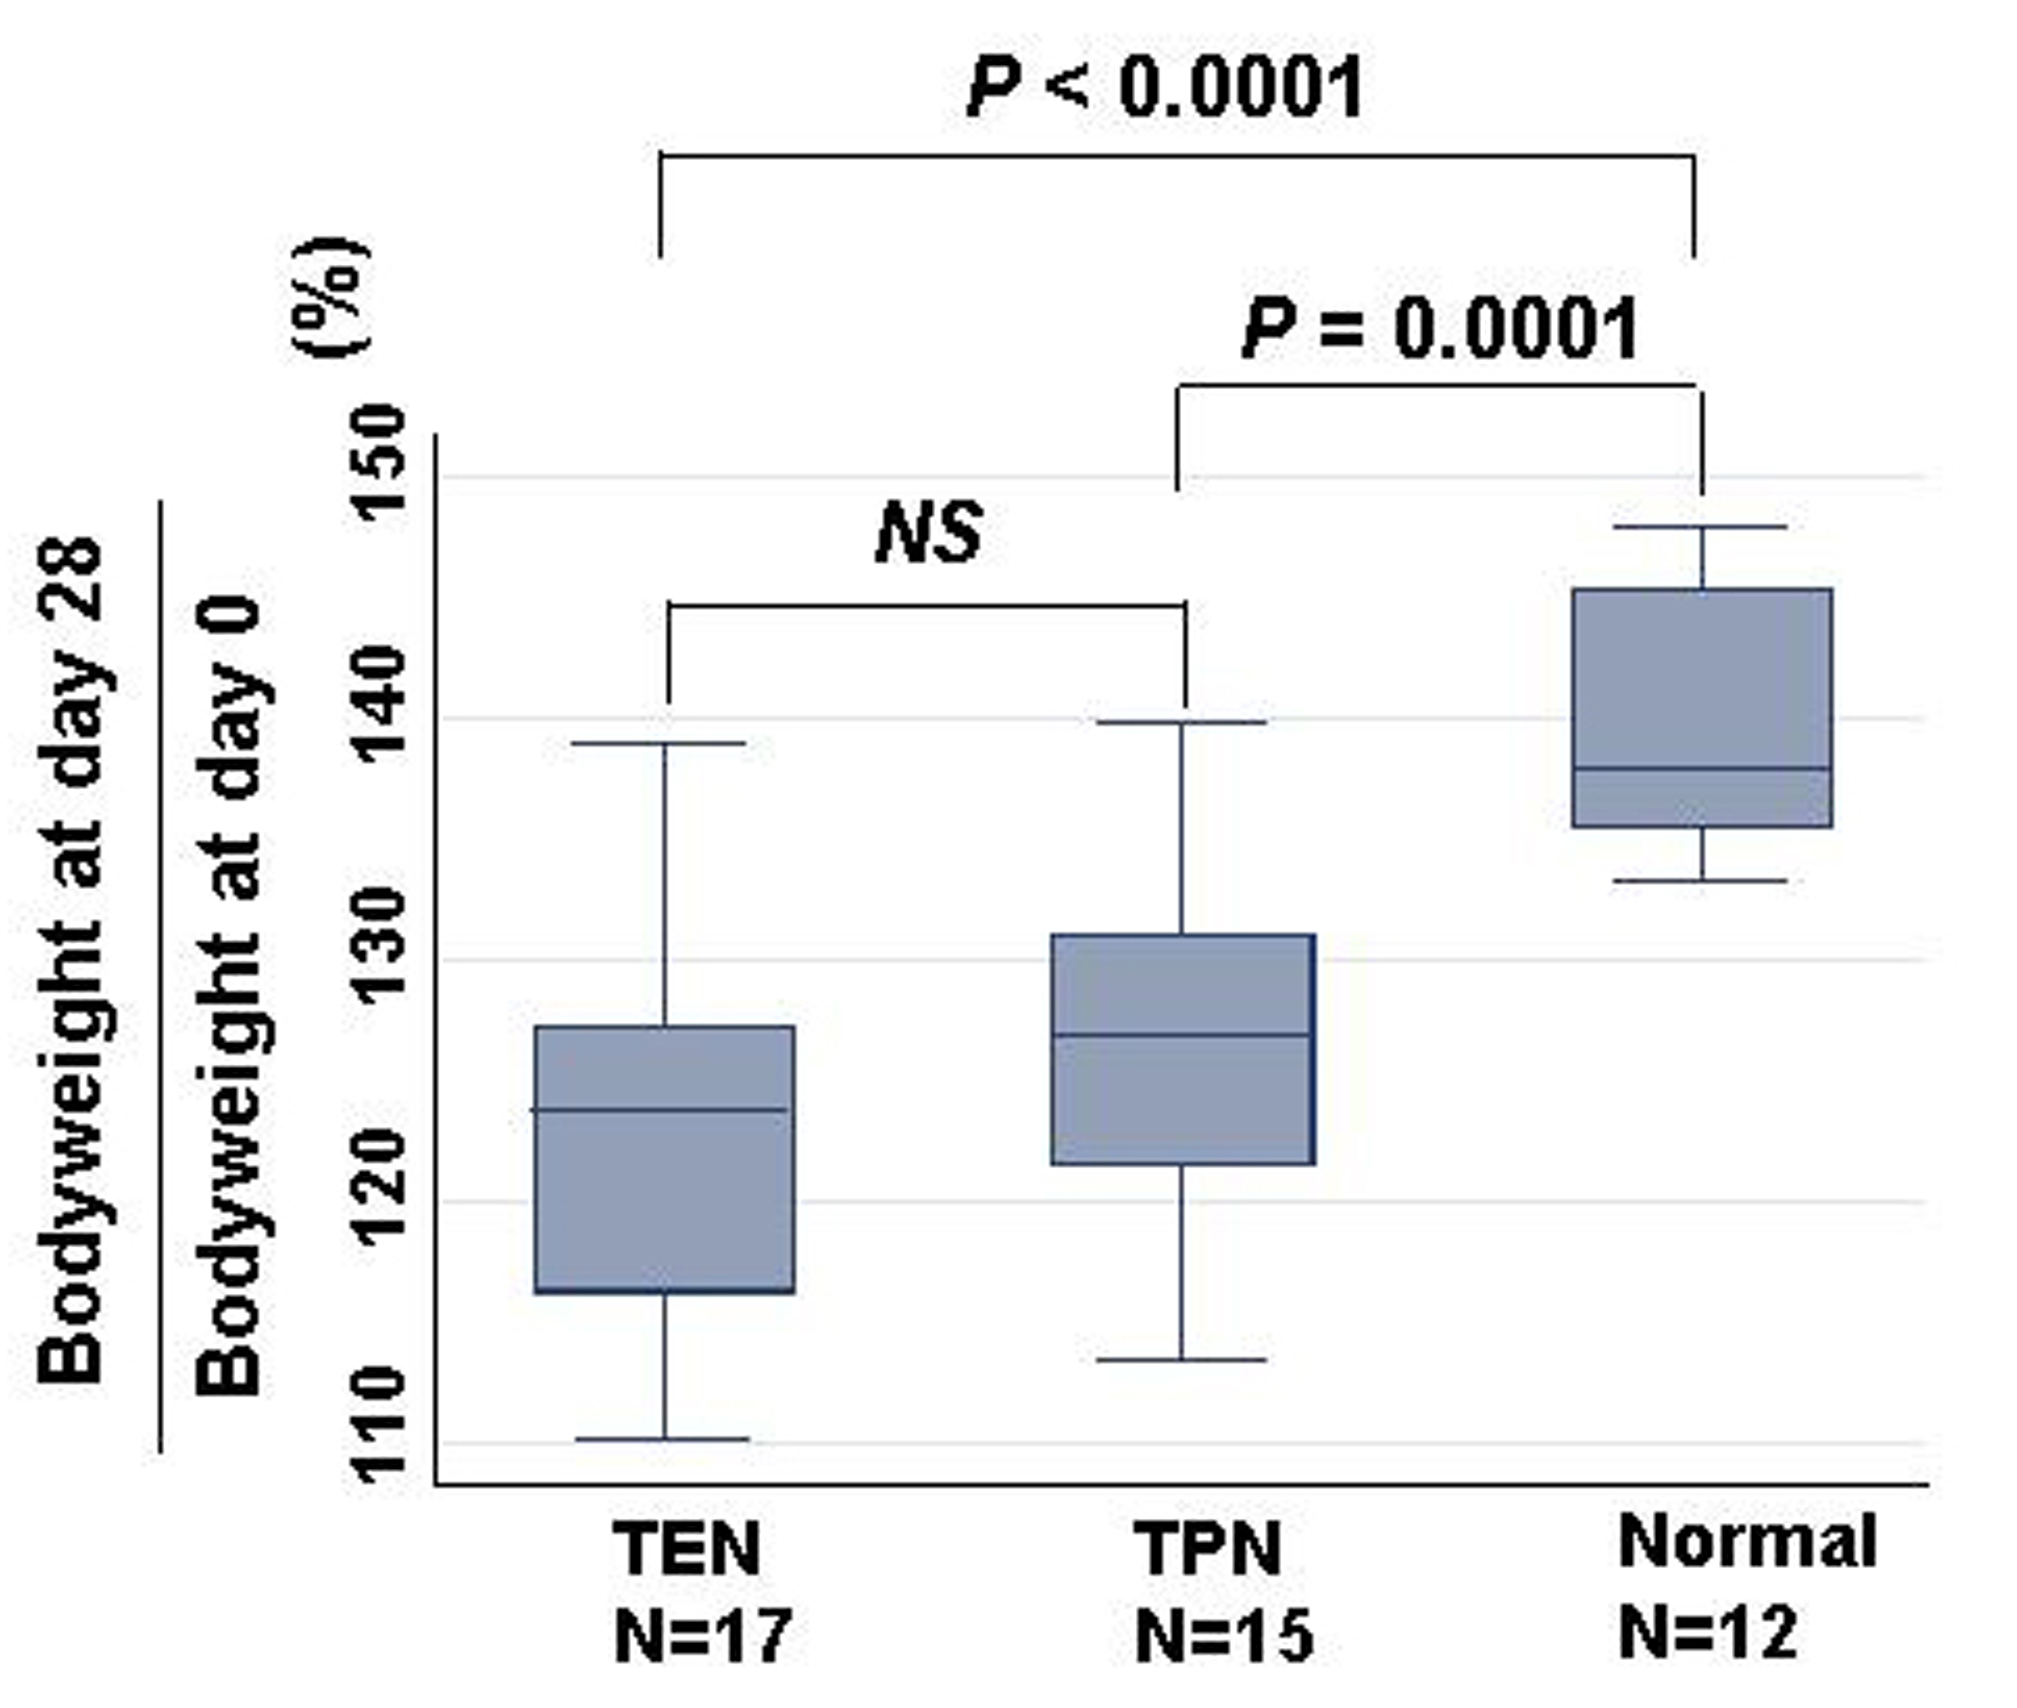
Figure 1. Comparison of bodyweight changes among TEN, TPN, and normal groups. Changes were calculated as bodyweight at day 28/ bodyweight at day 0 (%). Statistical difference was evaluated with Man Whitney U test.
| Gastroenterology Research, ISSN 1918-2805 print, 1918-2813 online, Open Access |
| Article copyright, the authors; Journal compilation copyright, Gastroenterol Res and Elmer Press Inc |
| Journal website http://www.gastrores.org |
Original Article
Volume 2, Number 4, August 2009, pages 224-231
Total Enteral Nutrition Facilitates Wound Healing Through Preventing Intestinal Atrophy, Keeping Protein Anabolism and Suppressing Inflammation
Figures
Tables
| Component | TEN*1 | TPN*2 | |
|---|---|---|---|
| *1: Twinline® (Otsuka co. ltd, Tokyo, Japan) | |||
| *2: Unicaliq® (N) + Multamin®+ Mineralin® + Intrafat® (20%) + 20% Chorine chloride | |||
| Carbohydrate | 14.68 g | 20.59 g | |
| Lipid | LCT | 0.812 g | 0.374 g |
| MCT | 1.968 g | 0 g | |
| Amino acid | 4.05 g | 3.53 g | |
| Total nitrate | 0.6 g | 0.55 g | |
| Volume | 100 ml | 120 ml | |
| Calorie/N | 176 | 182 | |
| Calorie of non protein | 83.7 kcal | 85.9 kcal | |
| Calorie of non protein/N | 140 | 157 | |
| Biomarker | TEN N = 17 | TPN*2 N = 15 | Control*3 N = 12 | Kruskal-Wallis *1 |
|---|---|---|---|---|
| *1: Statistical differences were calculated based on Kruskal-Wallis equality of populations rank test. Statistical significance was defined when p-value was less than 0.05. | ||||
| *2: Value of TPN was compared with TEN by correcting with Bonferroni. | ||||
| *3: Value of control was compared with TEN.: † p < 0.016, ‡: p < 0.005. | ||||
| Medication nitrogen quantity | 947.8 ± 27.3 | 881.2 ± 15.1‡ | 1515.7 ± 8.1‡ | 0.0001 |
| Urine inside nitrogen quantity | 659.2 ± 63.6 | 755.1 ± 73.2† | 625.4 ± 42.1‡ | 0.0077 |
| Feces inside nitrogen quantity | 62.2 ± 30.7 | 22.9 ± 8.6† | 365.4 ± 7.1‡ | < 0.0001 |
| Nitrogen accounts | 226.3 ± 87.2 | 103.3 ± 80.7† | 524.8 ± 34.9‡ | < 0.0001 |
| Prices | 25.3 ± 9.1 | 11.9 ± 9.3† | 45.6 ± 3.3‡ | < 0.0001 |
| Total protein (g/dl) | 5.4 ± 0.3 | 5.3 ± 0.4 | 4.9 ± 0.2‡ | 0.0004 |
| Albumin (g/dl) | 1.8 ± 0.1 | 1.8 ± 0.1 | 2.2 ± 0.1‡ | < 0.0001 |
| Transferrin (mg/ml) | 3.19 ± 0.41 | 3.13 ± 0.62 | 3.16 ± 0.50‡ | 0.0005 |
| Types | Biomarker | TEN N = 17 | TPN N = 15 | Control N = 12 | Kruskal-Wallis *1 |
|---|---|---|---|---|---|
| *1: Statistical differences were calculated based on Kruskal-Wallis equality of populations rank test. Statistical significance was defined when p-value was less than 0.05. *2. Two high levels of AST (2864, 2994) were included in TPN group. †: p < 0.016, ‡: p < 0.005. | |||||
| Immune | Sialic acid (mg/dl) | 109.6 ± 12.2 | 125.5 ± 21.5 | 75.6 ± 6.8‡ | < 0.0001 |
| IL-4 (pg/ml) | 5.4 ± 8.3 | 10.6 ± 12.7 | 9.7 ± 10.6 | NS | |
| IL-6 (pg/ml) | 2.4 ± 6.7 | 56.7 ± 91.6 | 0 ± 0 | 0.0061 | |
| IL-8 (pg/ml) | 193.2 ± 144.0 | 283.5 ± 277.0 | 122.8 ± 46.4 | NS | |
| IL-10 (pg/ml) | 3.6 ± 9.8 | 18.2 ± 42.4 | 3.9 ± 13.4 | NS | |
| TNF-α (pg/ml) | 1.7 ± 4.2 | 3.9 ± 4.1‡ | 1.3 ± 1.7 | 0.0087 | |
| Endotoxin (pg/ml) | 18.5 ± 6.2 | 20.1 ± 6.1 | 5.7 ± 1.5 | 0.0012 | |
| Spleen (g/100g bodyweight) | 0.25 ± 0.03 | 0.71 ± 0.40‡ | 0.22 ± 0.03 | < 0.0001 | |
| Liver | AST (U/l) | 129.0 ± 42.1 | 567.5 ± 1005.2*2 | 327.0 ± 698.6 | NS |
| ALT (U/l) | 36.4 ± 9.4 | 92.1 ± 145.6 | 30.7 ± 7.5 | NS | |
| Alkaliphosphatase (U/l) | 360.5 ± 74.4 | 569.1 ± 222.8‡ | 491 ± 109.4 | 0.0012 | |
| LAP (IU/l) | 54.6 ± 1.5 | 70.1 ± 25.5 | 71.6 ± 6.1† | 0.0066 | |
| Direct bilirubin (mg/dl) | 0.113 ± 0.057 | 0.196 ± 0.117‡ | 0.088 ± 0.016 | 0.0018 | |
| Indirect bilirubin (mg/dl) | 0.015 ± 0.014 | 0.055 ± 0.075† | 0.030 ± 0.012 | NS | |
| Renal | BUN (mg/dl) | 18.5 ± 2.3 | 22.7 ± 4.5‡ | 16.4 ± 15.5 | < 0.0001 |
| Cr (mg/dl) | 0.46 ± 0.05 | 0.55 ± 0.08‡ | 0.42 ± 0.05 | < 0.0001 | |
| Metabolism | Glucose (mg/dl) | 157.3 ± 5.5 | 116.8 ± 32.7‡ | 141.9 ± 17.5 | 0.0004 |
| Triglyceride (mg/dl) | 51.8 ± 19.6 | 23.1 ± 11.1‡ | 35.8 ± 17.3† | 0.0002 | |
| Total cholesterol (mg/dl) | 60.8 ± 11.5 | 55.5 ± 10.4 | 54.0 ± 10.8 | NS | |