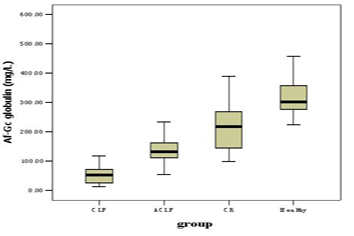
Figure 1. The levels of Af-Gc globulin in CLF, ACLF, CR and health controls
| Gastroenterology Research, ISSN 1918-2805 print, 1918-2813 online, Open Access |
| Article copyright, the authors; Journal compilation copyright, Gastroenterol Res and Elmer Press Inc |
| Journal website http://www.gastrores.org |
Original Article
Volume 2, Number 4, August 2009, pages 213-219
Plasma Actin-free Gc-globulin in Patients with Chronic or Acute-on-chronic Liver Failure Caused by Hepatitis B Virus
Figures
Tables
| Characteristic | CLF | ACLF | CR | Healthy |
|---|---|---|---|---|
| CLF, chronic liver failure; ACLF, acute on chronic liver failure; CR: cirrhosis | ||||
| No. | 33 | 23 | 23 | 25 |
| Age (yr), median (range) | 54 (35 – 79) | 50 (27 – 74) | 54 (39 – 74) | 34 (24 – 62) |
| Gender (M:F) | 23:10 | 21:2 | 20:3 | 19:6 |
| Cause | HBV (33) | HBV (23) | HBV (23) | HBV (0) |
| AST (IU/L) | 57 (20 – 459) | 296 (24 – 1611) | 44 (22 – 201) | |
| ALB (g/L) | 25 (17 – 41) | 28 (21 – 34) | 34 (31 – 38) | |
| CHE (Units) | 1346 (697 – 4034) | 2251 (522 – 4168) | 3457 (3243 – 4814) | |
| TBIL (µmol/L) | 162 (63 – 460) | 240 (95.7 – 918.4) | 39 (19 – 80) | |
| INR | 2.46 (1.91 – 5.01) | 2.36 (1.89 – 5.67) | 1.29 (1.03 – 1.84) | |
| PLT (109/L) | 44 (16 – 172) | 70 (17 – 166) | 88 (31 – 218) | |
| Child-Pugh score | 13 (11 – 14) | 12 (10 – 13) | 8 (6 – 10) | |
| Group | No. | Gender (M:F) | Age (years) | Af-Gc globulin (mg/L) |
|---|---|---|---|---|
| aP < 0.001 vs healthy; bP < 0.001 vs CR;cP = 0.001 vs CR;dP < 0.001 vs ACLF. CLF, chronic liver failure; ACLF, acute on chronic liver failure; CR, cirrhosis | ||||
| CLF | 33 | 23:10 | 54 (35 – 79) | 52.45 (12.02 – 169.47) a, b, d |
| ACLF | 23 | 21:2 | 50 (27 – 74) | 131.17 (53.73 – 374.80) a, c |
| CR | 23 | 20:3 | 54 (39 – 74) | 218.40 (98.19 – 389.51) a |
| Control | 25 | 19:6 | 34 (24 – 62) | 301.38 (223.72 – 520.53) |
| Characteristic | r value | P value |
|---|---|---|
| ALB | 0.422 | 0.001 |
| CHE | 0.539 | < 0.001 |
| ALT | 0.428 | 0.001 |
| AST | 0.426 | 0.001 |
| TBIL | 0.245 | 0.069 |
| INR | – 0.085 | 0.54 |
| Child-Pugh score | – 0.313 | 0.02 |
| PLT | 0.228 | 0.097 |
| Characteristic | Present (mg/L) | Absent (mg/L) | P value |
|---|---|---|---|
| Encephalopathy | 58.83 (12.06 – 374.8) | 99.8 (12.02 – 331.67) | 0.083 |
| Infection | 60.96 (12.02 – 233.14) | 104.47 (32.65 – 374.80) | 0.015 |
| GI bleeding | 66.28 (12.06 – 374.8) | 90 (12.02 – 331.67) | 0.383 |
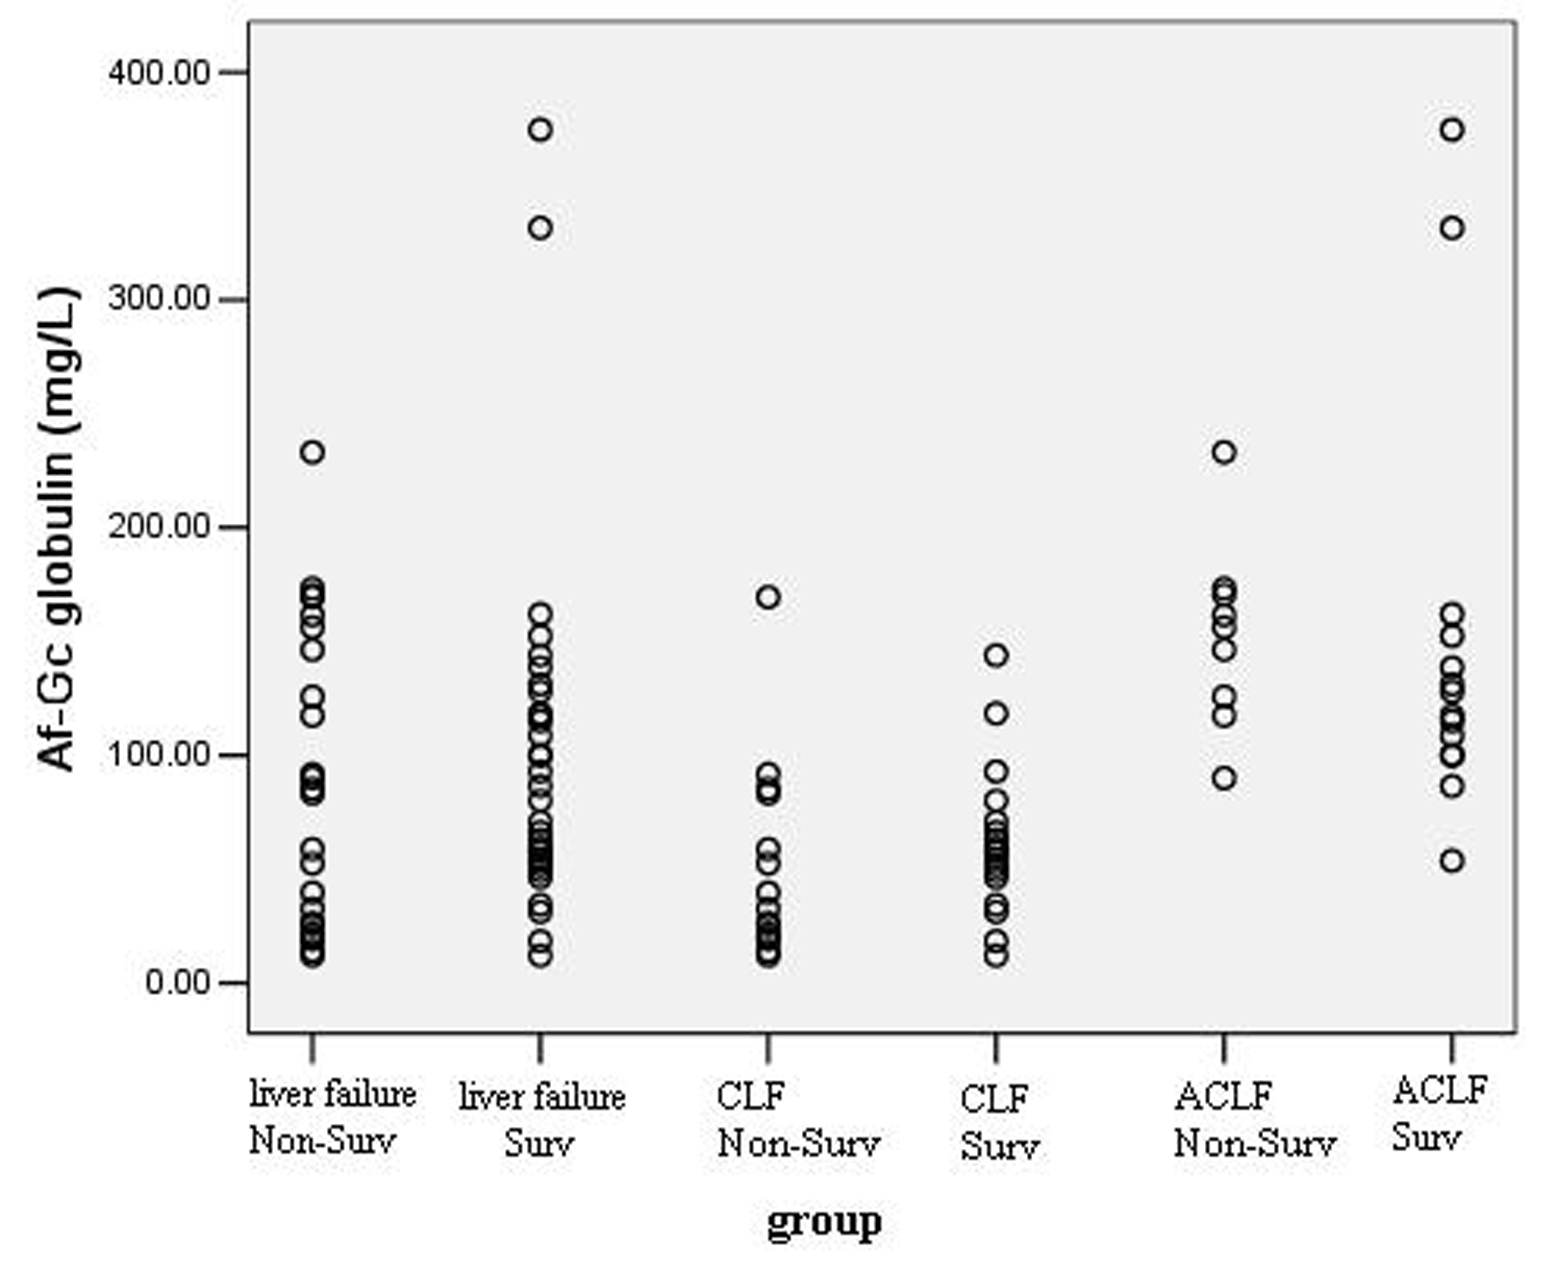
| Group | No. | Non-survivors | Survivors | P value |
|---|---|---|---|---|
| CLF, chronic liver failure; ACLF, acute on chronic liver failure; CR, cirrhosis | ||||
| LF | 56 | 84.36 (12.06 – 233.14) | 83.30 (12.02 – 374.80) | > 0.05 |
| CLF | 33 | 32.65 (12.06 – 169.47) | 57.77 (12.02 – 143.94) | > 0.05 |
| ACLF | 23 | 156.18 (90.00 – 233.14) | 122.71 (53.73 – 374.80) | > 0.05 |