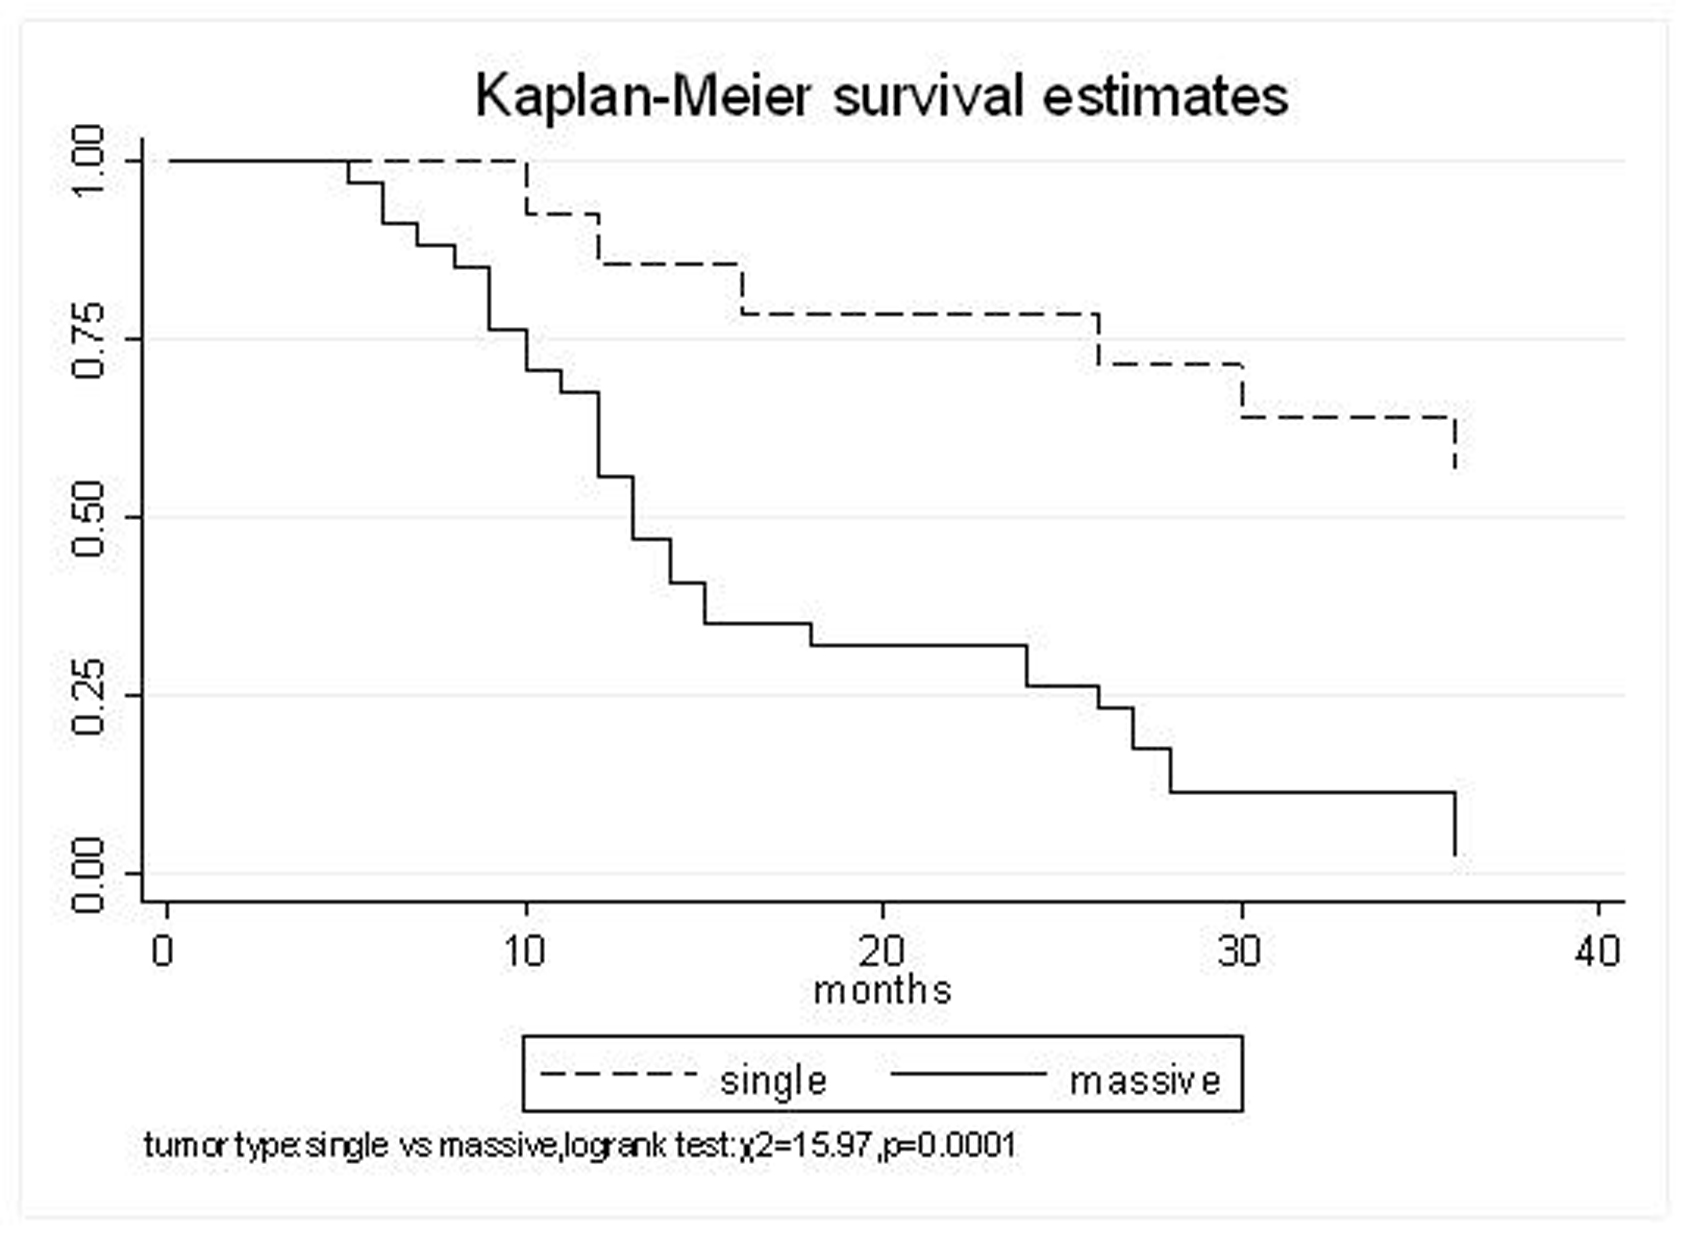
Figure 1. Tumor type, Single VS. Massive
| Gastroenterology Research, ISSN 1918-2805 print, 1918-2813 online, Open Access |
| Article copyright, the authors; Journal compilation copyright, Gastroenterol Res and Elmer Press Inc |
| Journal website http://www.gastrores.org |
Original Article
Volume 2, Number 3, June 2009, pages 141-147
125I Radioactive Seeds Implantation Therapy for Hepatocellular Carcinoma
Figures
Tables
| Characteristic | Number of patients(%) |
|---|---|
| Age (mean) | 32-86 years (59) |
| Gender | |
| Male (%) | 38(79.2%) |
| Female (%) | 10(20.8%) |
| KPS | |
| 100 | 10(20.8%) |
| 80 | 10(20.8%) |
| 60 | 17(35.4%) |
| Viral antigen | |
| HBV | 38(79.2%) |
| HCV | 10(20.8%) |
| AFP (ng/ml) | |
| > 400 | 22(45.8%) |
| ≤ 400 | 26(54.2%) |
| Tumor Size | |
| < 5 cm | 17(35.4%) |
| 5-10 cm | 23(47.9%) |
| > 10 cm | 8(16.7%) |
| Tumor type | |
| Single | 14(29.2%) |
| Massive | 34(70.8%) |
| Liver Child-Pugh | |
| A | 34(70.8%) |
| B | 14(29.2%) |
| Okuda stage | |
| I | 22(45.8%) |
| II | 24(50%) |
| III | 2(4.2%) |
| AJCC stage | |
| II | 10(20.8%) |
| IIIa | 20(41.7%) |
| IIIb | 18(37.5%) |
| Prior TACE (%) | |
| 2 | 5(10.4%) |
| 2+ | 43(89.6%) |
| TACE median sessions | 4(95%CI,4-5) |
| Characteristic | Number of patients (%) |
|---|---|
| mCi: millicuries; MPD: matched peripheral dose; Gy: gray. | |
| Activity per seed | |
| 0.4 mCi | 10 (20.8%) |
| 0.7 mCi | 23 (47.9%) |
| 1.0 mCi | 15 (31.3%) |
| Number of seeds | |
| 30-40 | 8 (16.7%) |
| 41-60 | 21 (43.8%) |
| ≥61 | 18 (37.5%) |
| Total activity | |
| 10-20 mCi | 10 (20.8%) |
| 21-30 mCi | 30 (62.5%) |
| 31-50 mCi | 8 (16.7%) |
| MPD | |
| 60-80 Gy | 12 (25%) |
| 90-120 Gy | 29 (60.4%) |
| 130-160 Gy | 7 (14.6%) |
| Number of implant sites | |
| 1 | 40(83.3%) |
| 2 | 5(10.4%) |
| 3 | 3(6.25%) |
| Response | Number of patients(%) |
|---|---|
| CR: complete response; PR: partial response; SD: stable disease; PD: progressive disease | |
| CR | 8 (16.7%) |
| PR | 26 (54.2%) |
| SD | 10 (20.8%) |
| PD | 4 (8.3%) |
| Toxicity grade | ||||
|---|---|---|---|---|
| 1 | 2 | 3 | 4 | |
| Transaminase | 2 | 3 | - | - |
| Bilirubin | 1 | 2 | - | - |
| Albumin | 2 | 3 | - | - |
| Alkaline phosphatase | 2 | 2 | - | - |
| Leucopenia | 3 | 3 | - | - |
| Anemia | 5 | 2 | - | - |
| Thrombocytopenia | 1 | 3 | - | - |
| Category | Number of Patients (%) |
|---|---|
| Number remaining alive | 9 (18.8%) |
| Death of intrahepatic disease | 16 (33.3%) |
| Death of extrahepatic disease | 7 (14.6%) |
| Death of complications of further Treatment | 10 (20.8%) |
| Death of unrelated cause | 6 (12.5%) |
| Actuarial survival | |
| 1 year | 75% |
| 2 year | 45.8% |
| 3 year | 27.1% |
| Median survival time | 15.5 months (95%CI,12.7-27) |
| Patient group | Survival rate(%) | Mean survival (months) | P | ||
|---|---|---|---|---|---|
| 1-Y | 2-Y | 3-Y | |||
| All patients | 75% | 45.8% | 27.1% | 24.2 (95% CI, 19.2-29.2) | - |
| Age(years) | |||||
| <50 | 80% | 60% | 40% | 28.9 (95% CI, 14.7-43.1) | 0.4683 |
| ≥50 | 73.7% | 42.1% | 23.7% | 22.9 (95% CI, 17.5-28.4) | |
| Gender | |||||
| Male | 76.3% | 44.7% | 26.3% | 22.9 (95% CI, 17.7-28.1) | 0.5499 |
| Female | 70% | 50% | 30% | 29.1 (95% CI, 13.1-45.1) | |
| KPS | 0.3461 | ||||
| 100 | 80% | 60% | 40% | 28.9 (95% CI, 14.7-43.1) | - |
| 80 | 81% | 57.1% | 28.6% | 26.5 (95% CI, 18.4-34.6) | - |
| 60 | 64.7% | 23.5% | 17.6% | 18.5 (95% CI, 11.2-25.8) | - |
| Tumor type | |||||
| Single | 92.9% | 71.4% | 64.3% | 41.2 (95% CI, 29.8-52.6) | 0.0001 |
| Massive | 67.6% | 32.4% | 11.8% | 17.1 (95% CI, 13.7-20.6) | |
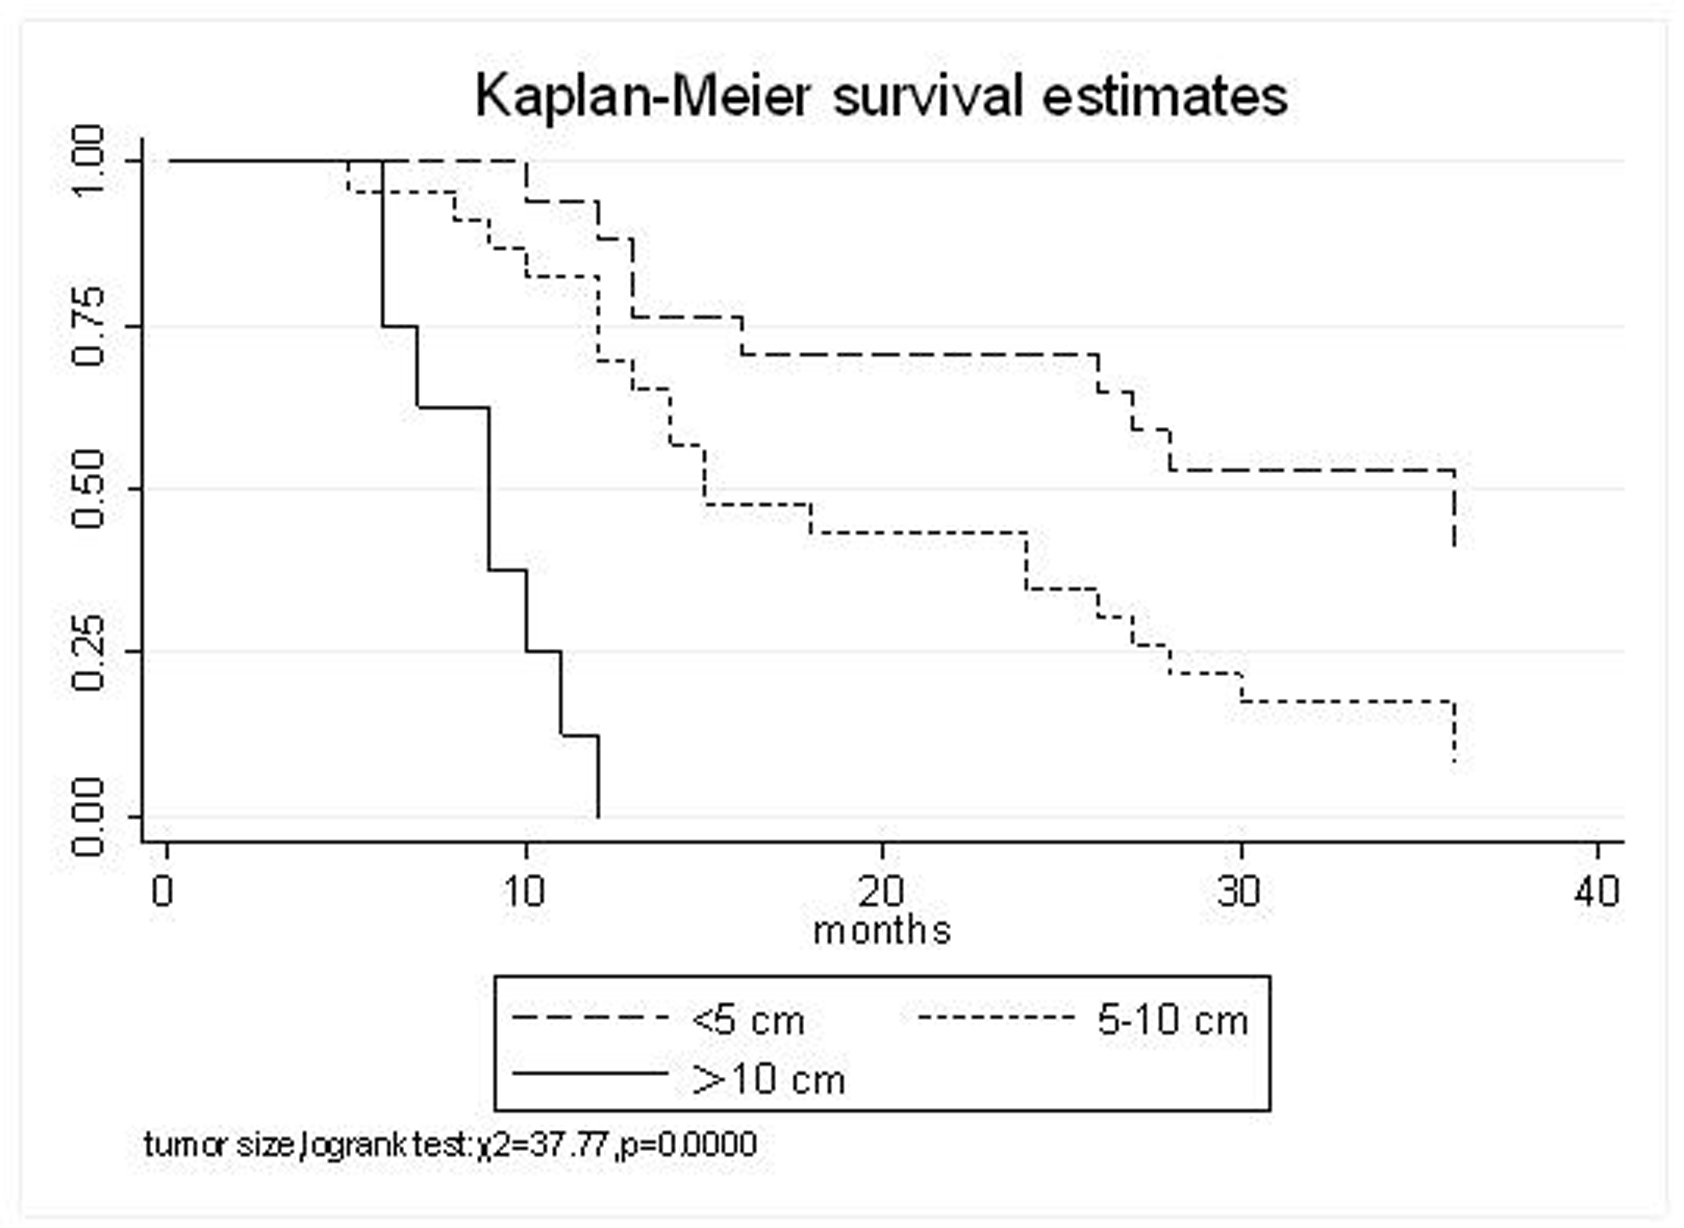
| Tumor Size | 0.0000 | ||||
| <5 cm | 94.1% | 70.6% | 52.9% | 35.5 (95% CI, 25.6-45.5) | |
| 5-10 cm | 82.6% | 43.5% | 17.4% | 21.1 (95% CI, 15.6-26.7) | |
| >10 cm | 12.5% | 0% | 0% | 8.75 (95% CI, 6.9-10.6) | |
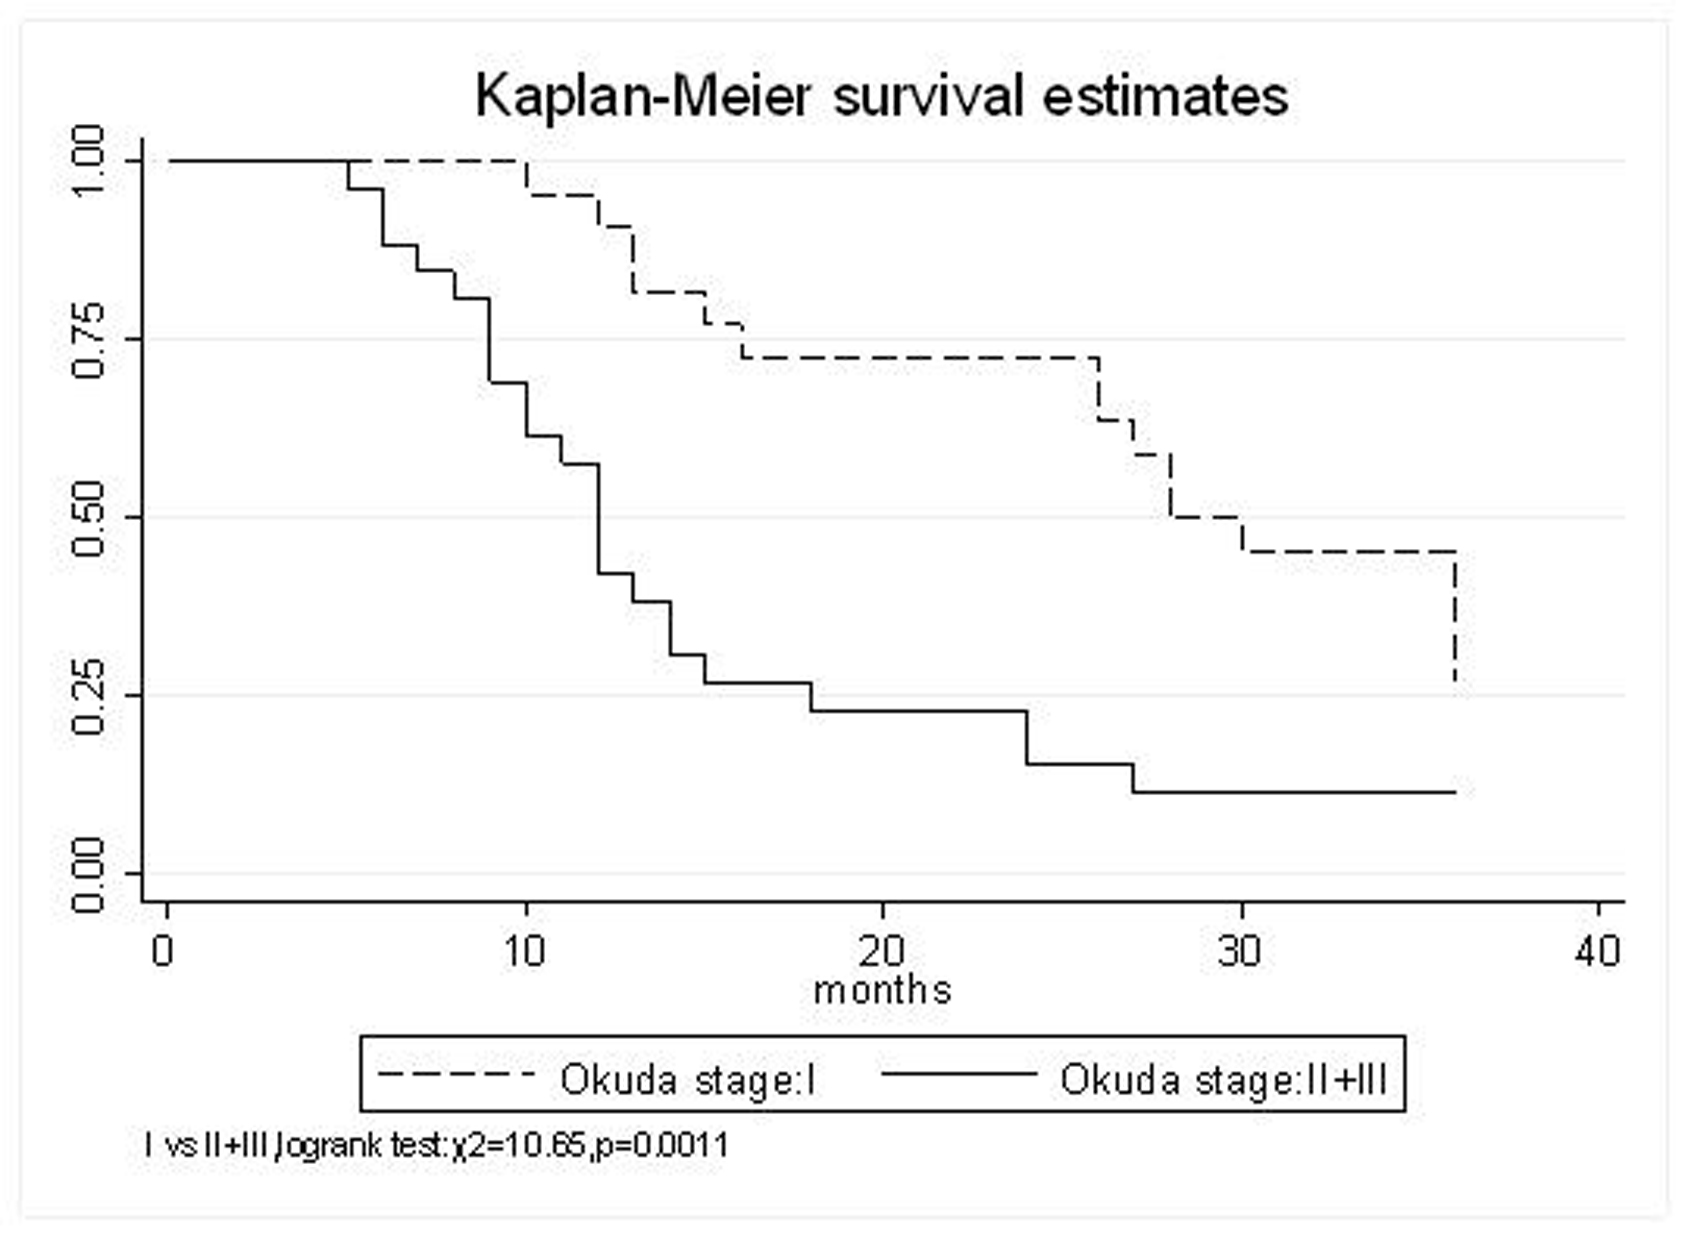
| Okuda stage | |||||
| I | 95.4% | 72.7% | 45.5% | 33 (95% CI, 25.3-40.7) | 0.0011 |
| II+III | 57.7% | 23.1% | 11.5% | 16.7 (95% CI, 11.3-22.1) | |
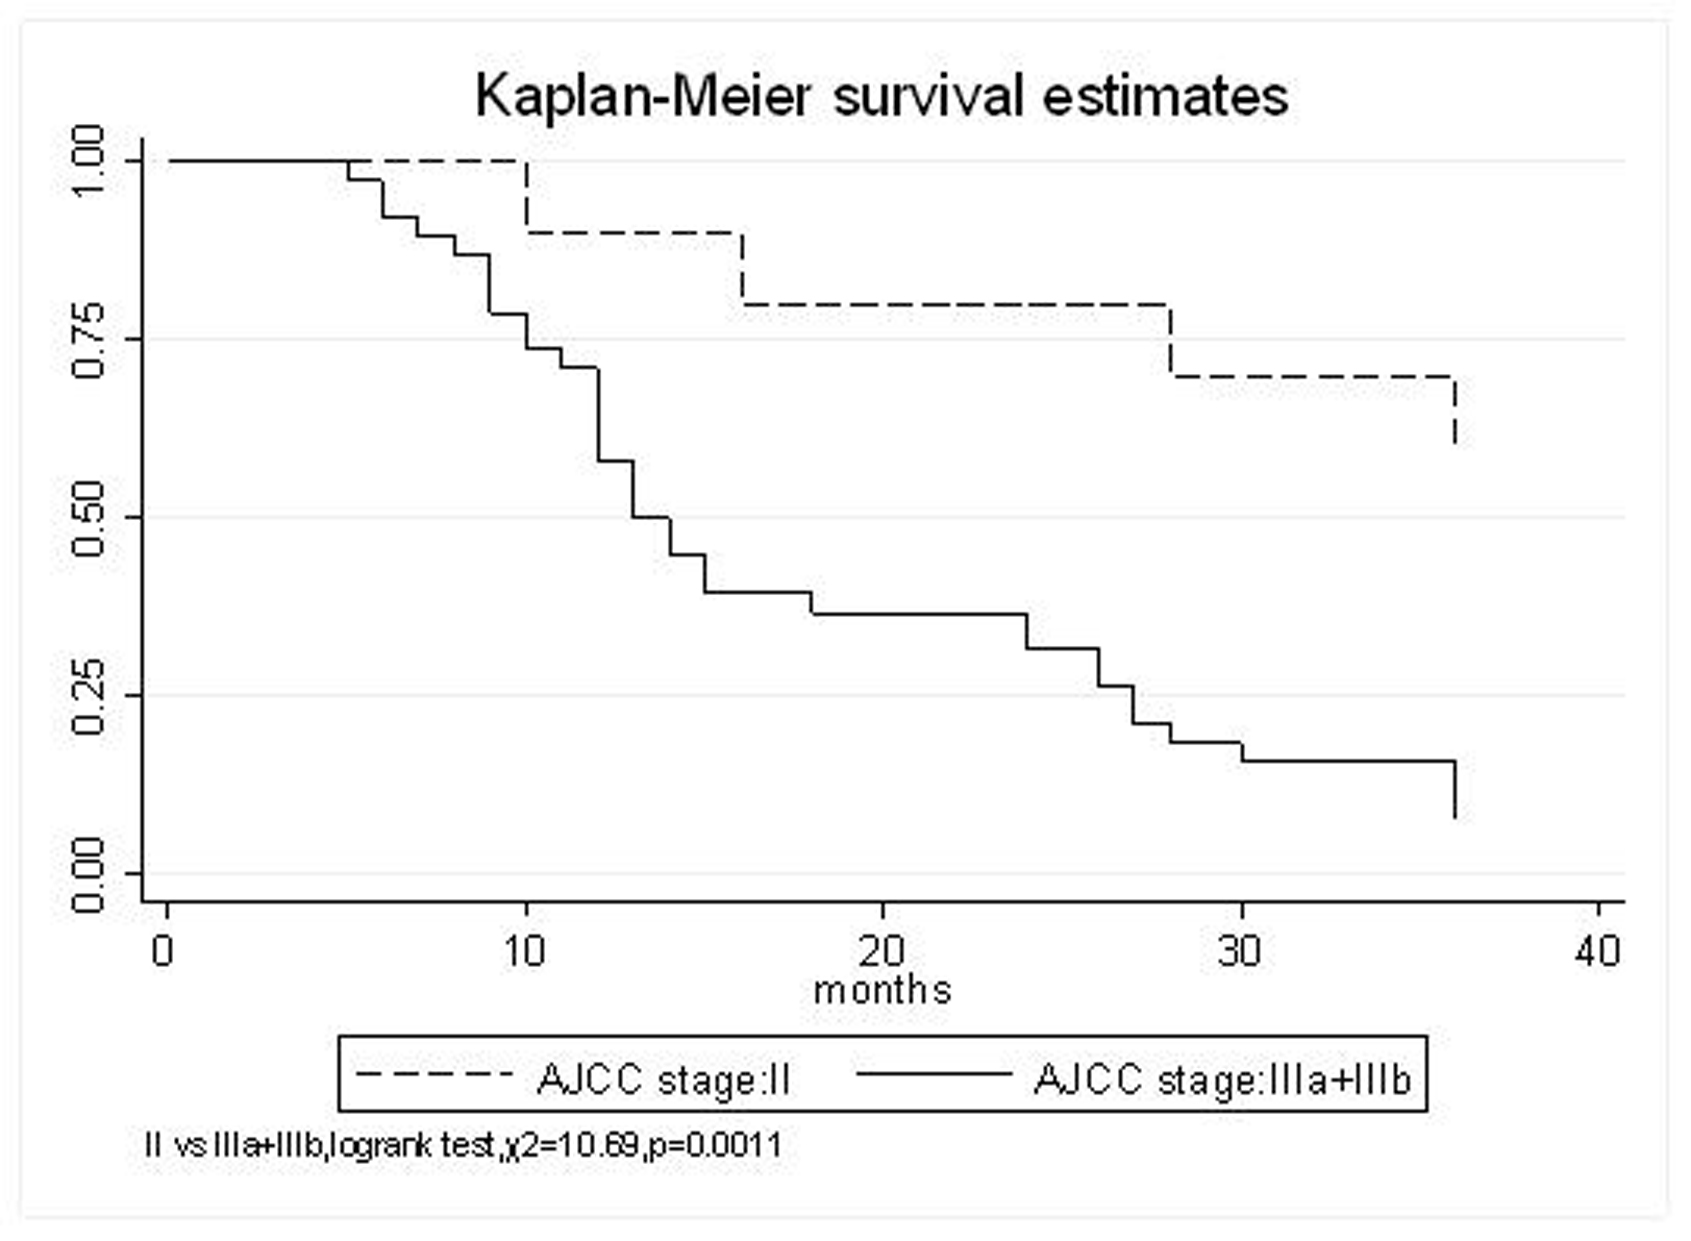
| AJCC stage | |||||
| II | 90% | 80% | 70% | 41.7 (95% CI, 28-55.4) | 0.0011 |
| IIIa+IIIb | 71.1% | 36.8% | 15.8% | 19.6 (95% CI, 15.1-24) | |
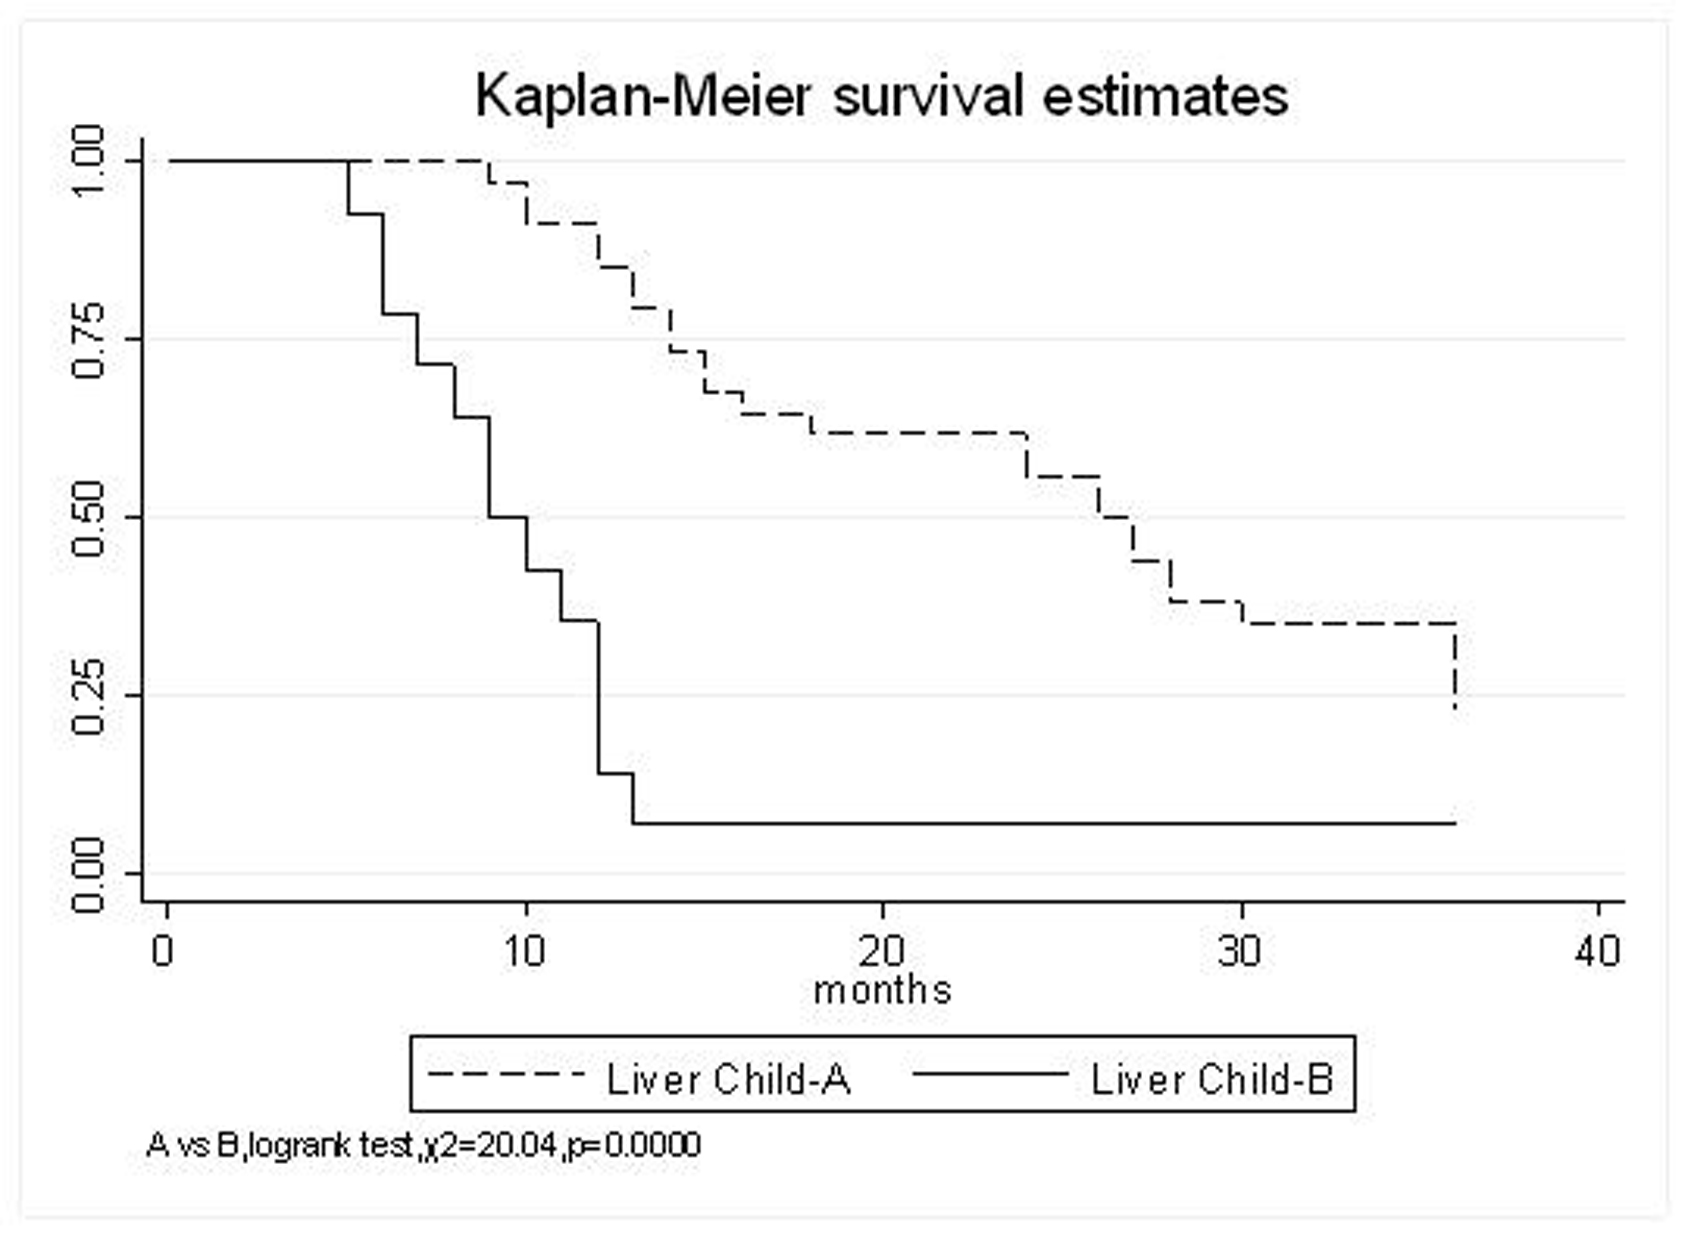
| Liver Child–Pugh | |||||
| A | 85.3% | 61.8% | 35.3% | 9.5 (95% CI, 23.4-35.5) | 0.0000 |
| B | 35.7% | 7.1% | 7.1% | 11.3 (95% CI, 6.6-16) | |
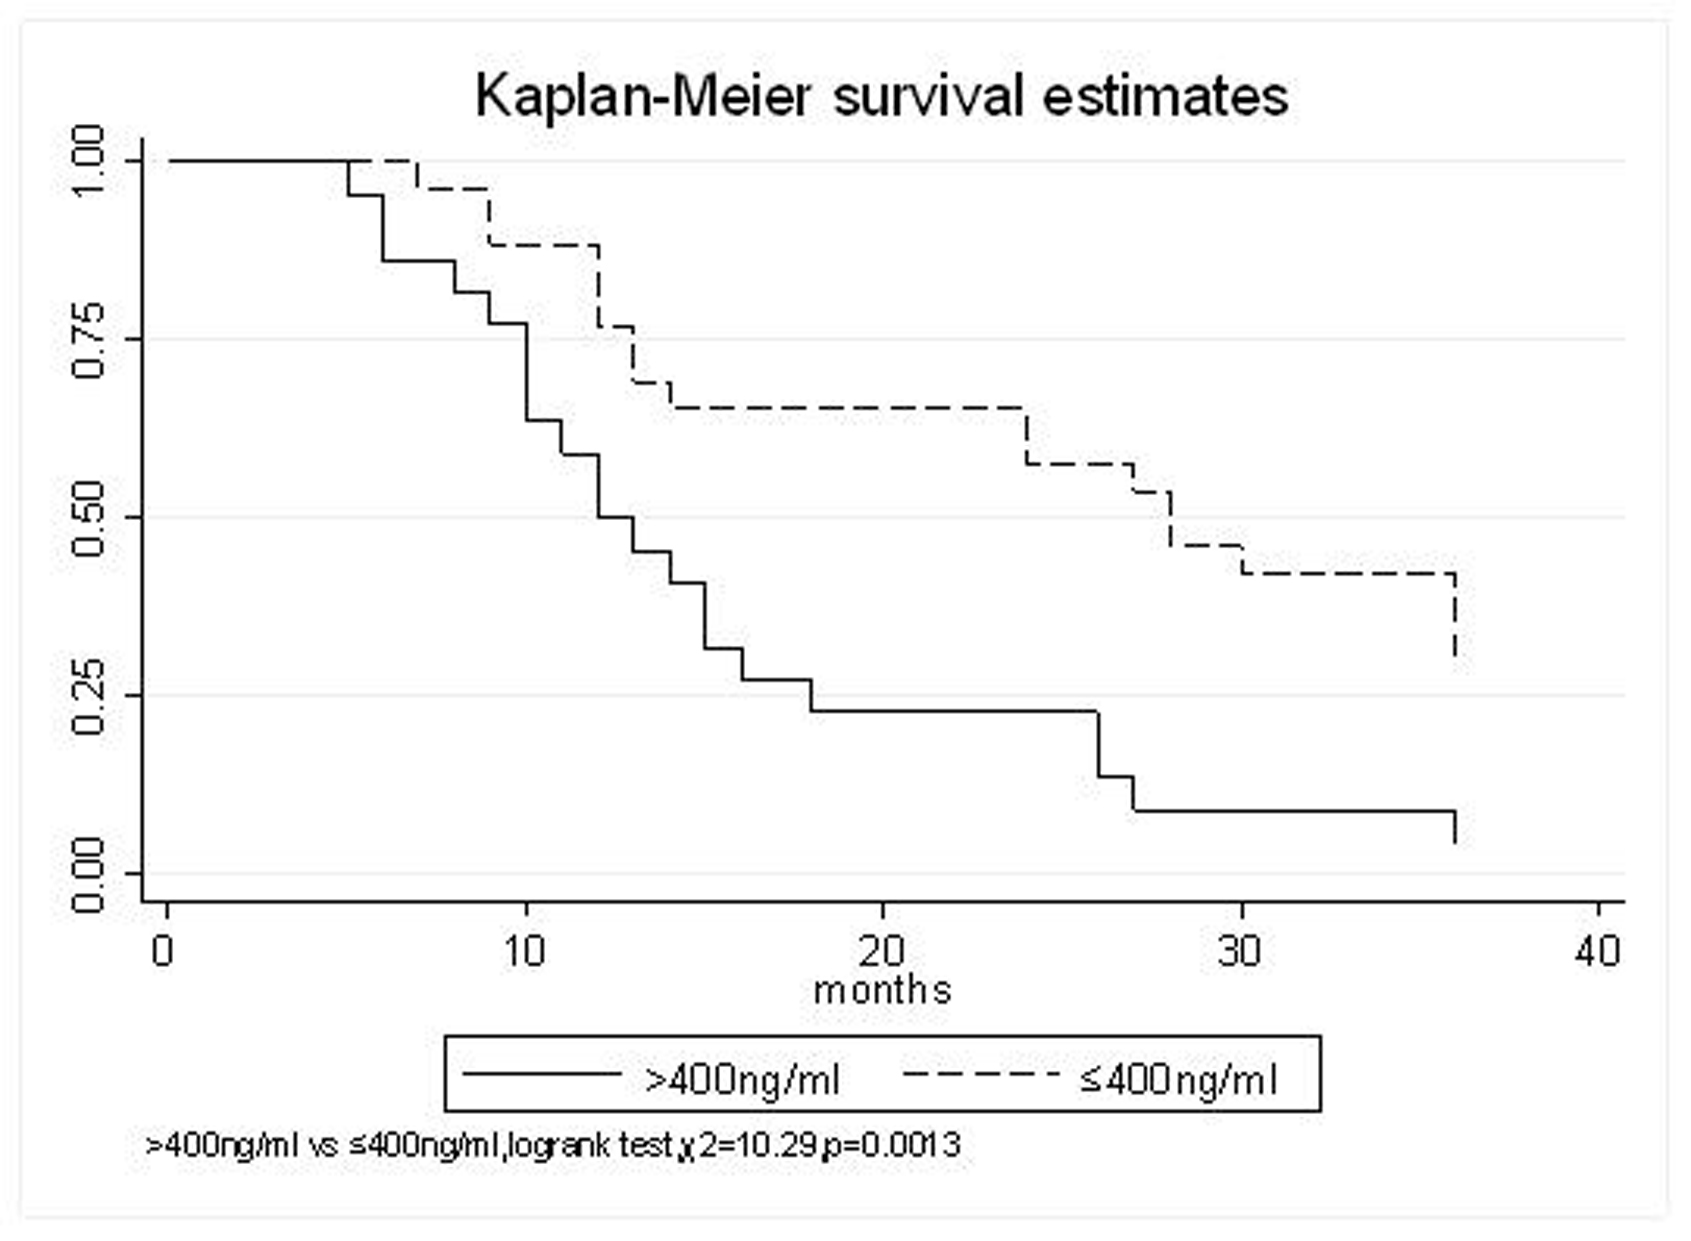
| AFP(ng/ml) | |||||
| > 400 | 59.1% | 22.7% | 9.1% | 16.6 (95% CI, 11.1-22.1) | 0.0013 |
| ≤ 400 | 88.5% | 65.4% | 42.3% | 30.6 (95% CI, 23.2-38) | |
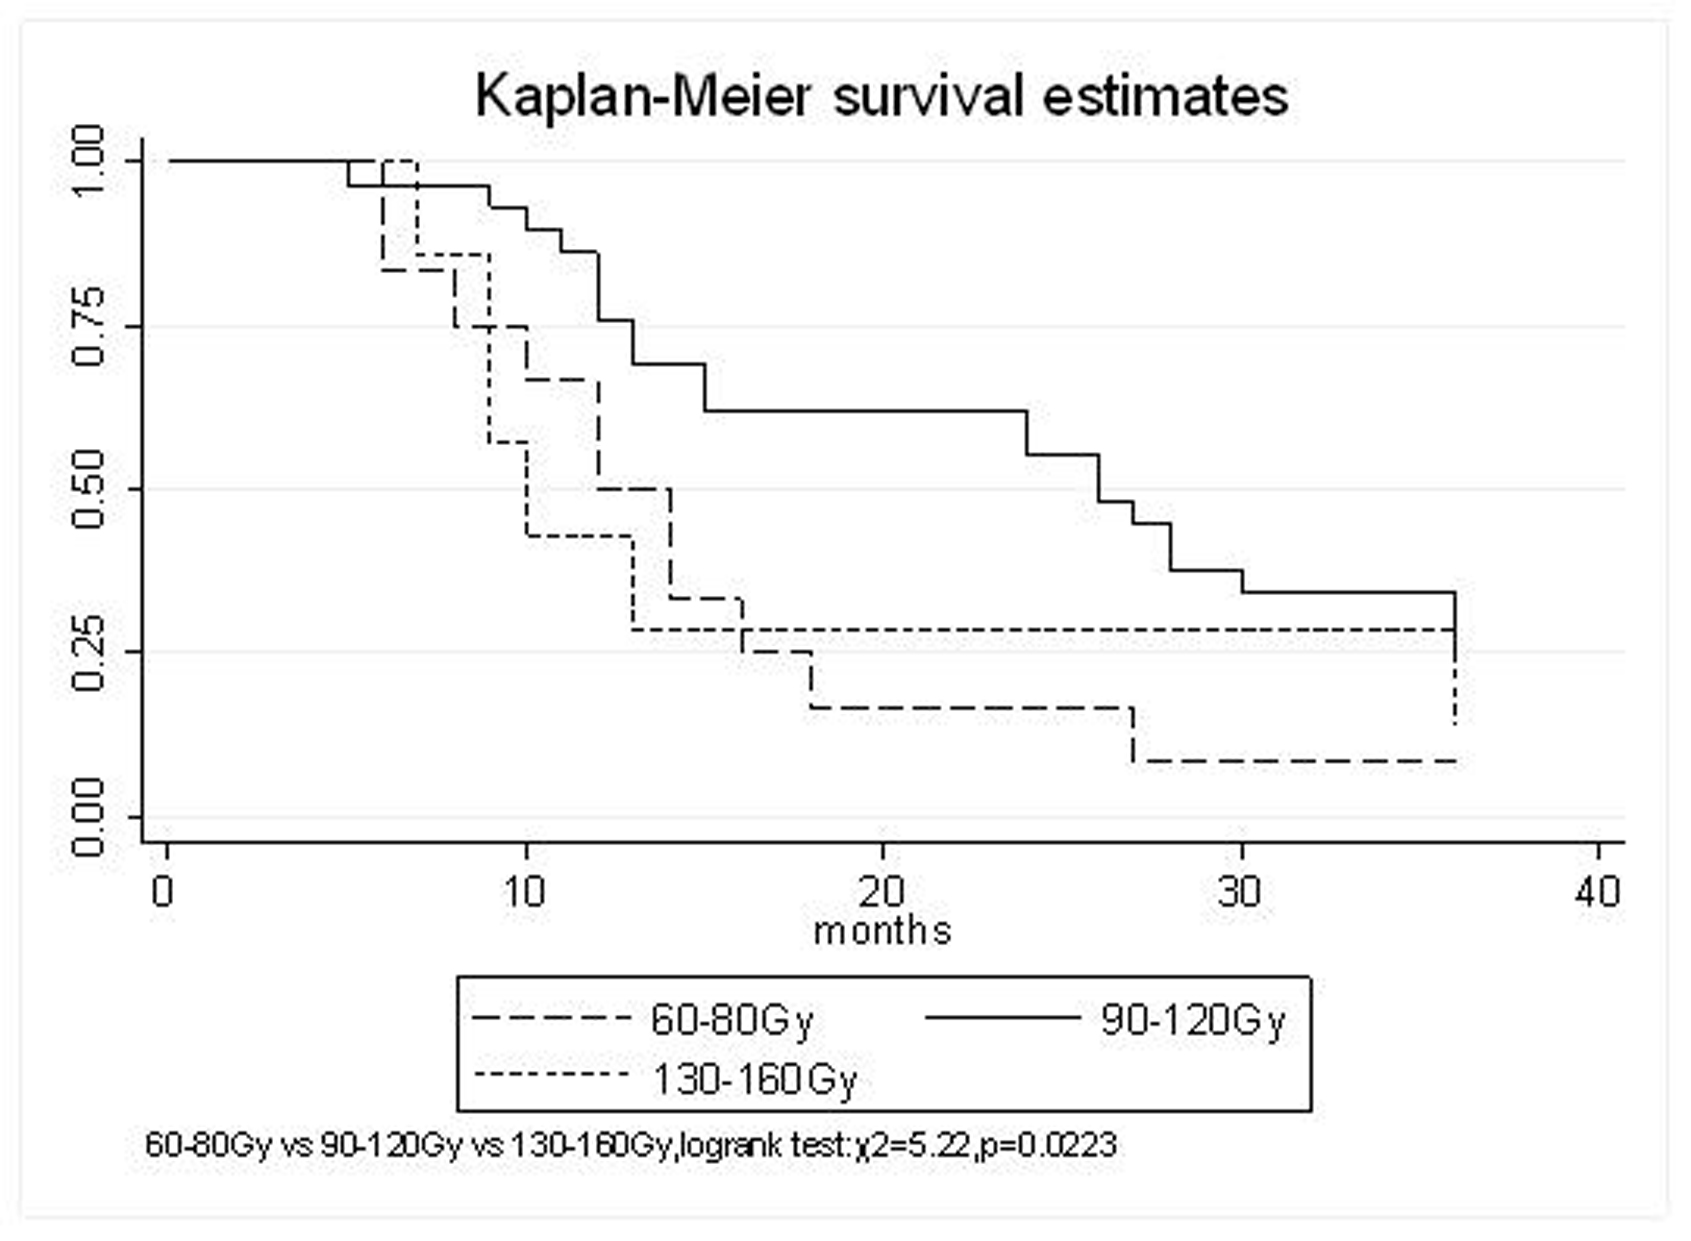
| MPD | 0.0223 | ||||
| 60-80 Gy | 66.7% | 16.7% | 8.3% | 15.1 (95% CI, 9.2-21) | |
| 90-120 Gy | 86.2% | 58.6% | 34.5% | 29.1(95% CI, 22.3-36) | |
| 130-160 Gy | 42.9% | 28.6% | 28.6% | 20.6 (95% CI, 2-39.1) | |