Figures
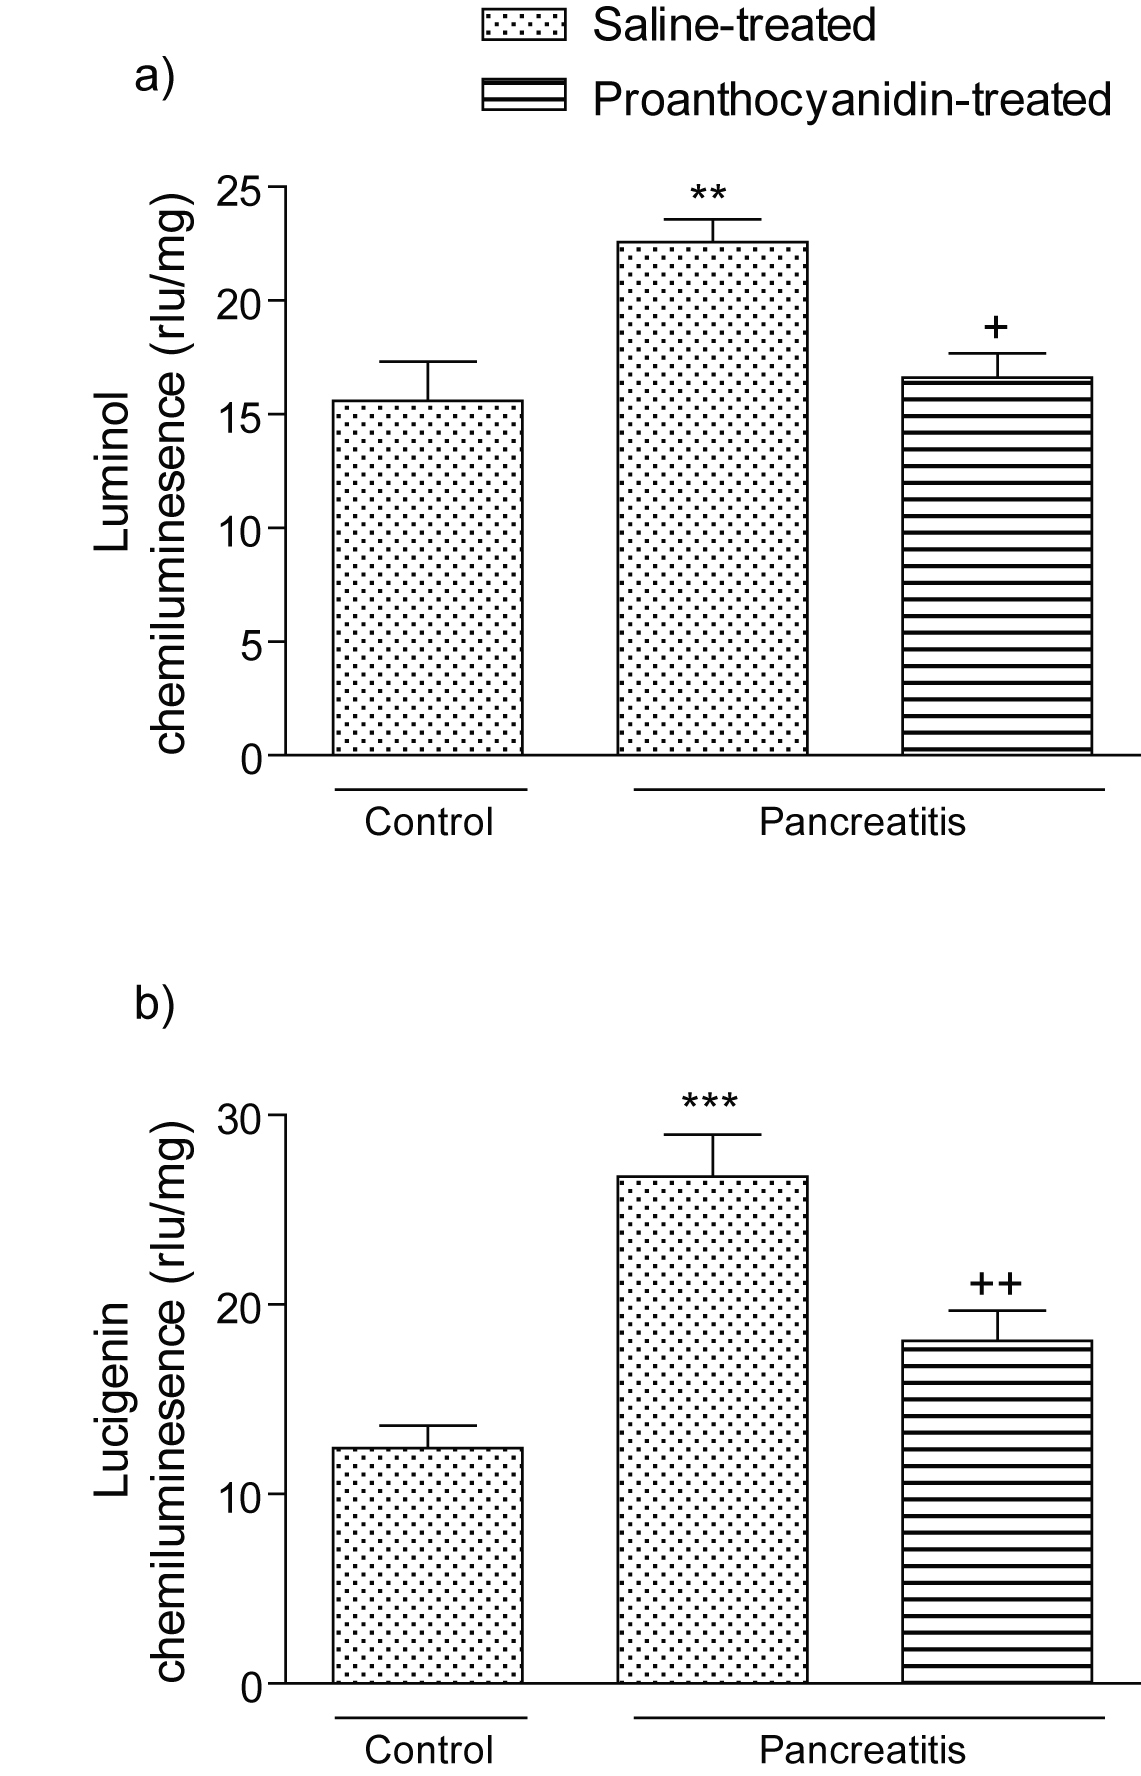
Figure 1. (a) Luminol and (b) lucigenin chemiluminescence (CL) in the pancreatic tissues of control, saline-treated pancreatitis and proanthocyanidin-treated pancreatitis groups. Each group consists of 6 animals. rlu: relative light units. ** p < 0.01, *** p < 0.001, compared to the control group. +p < 0.05, ++p < 0.01, compared to saline-treated pancreatitis group.
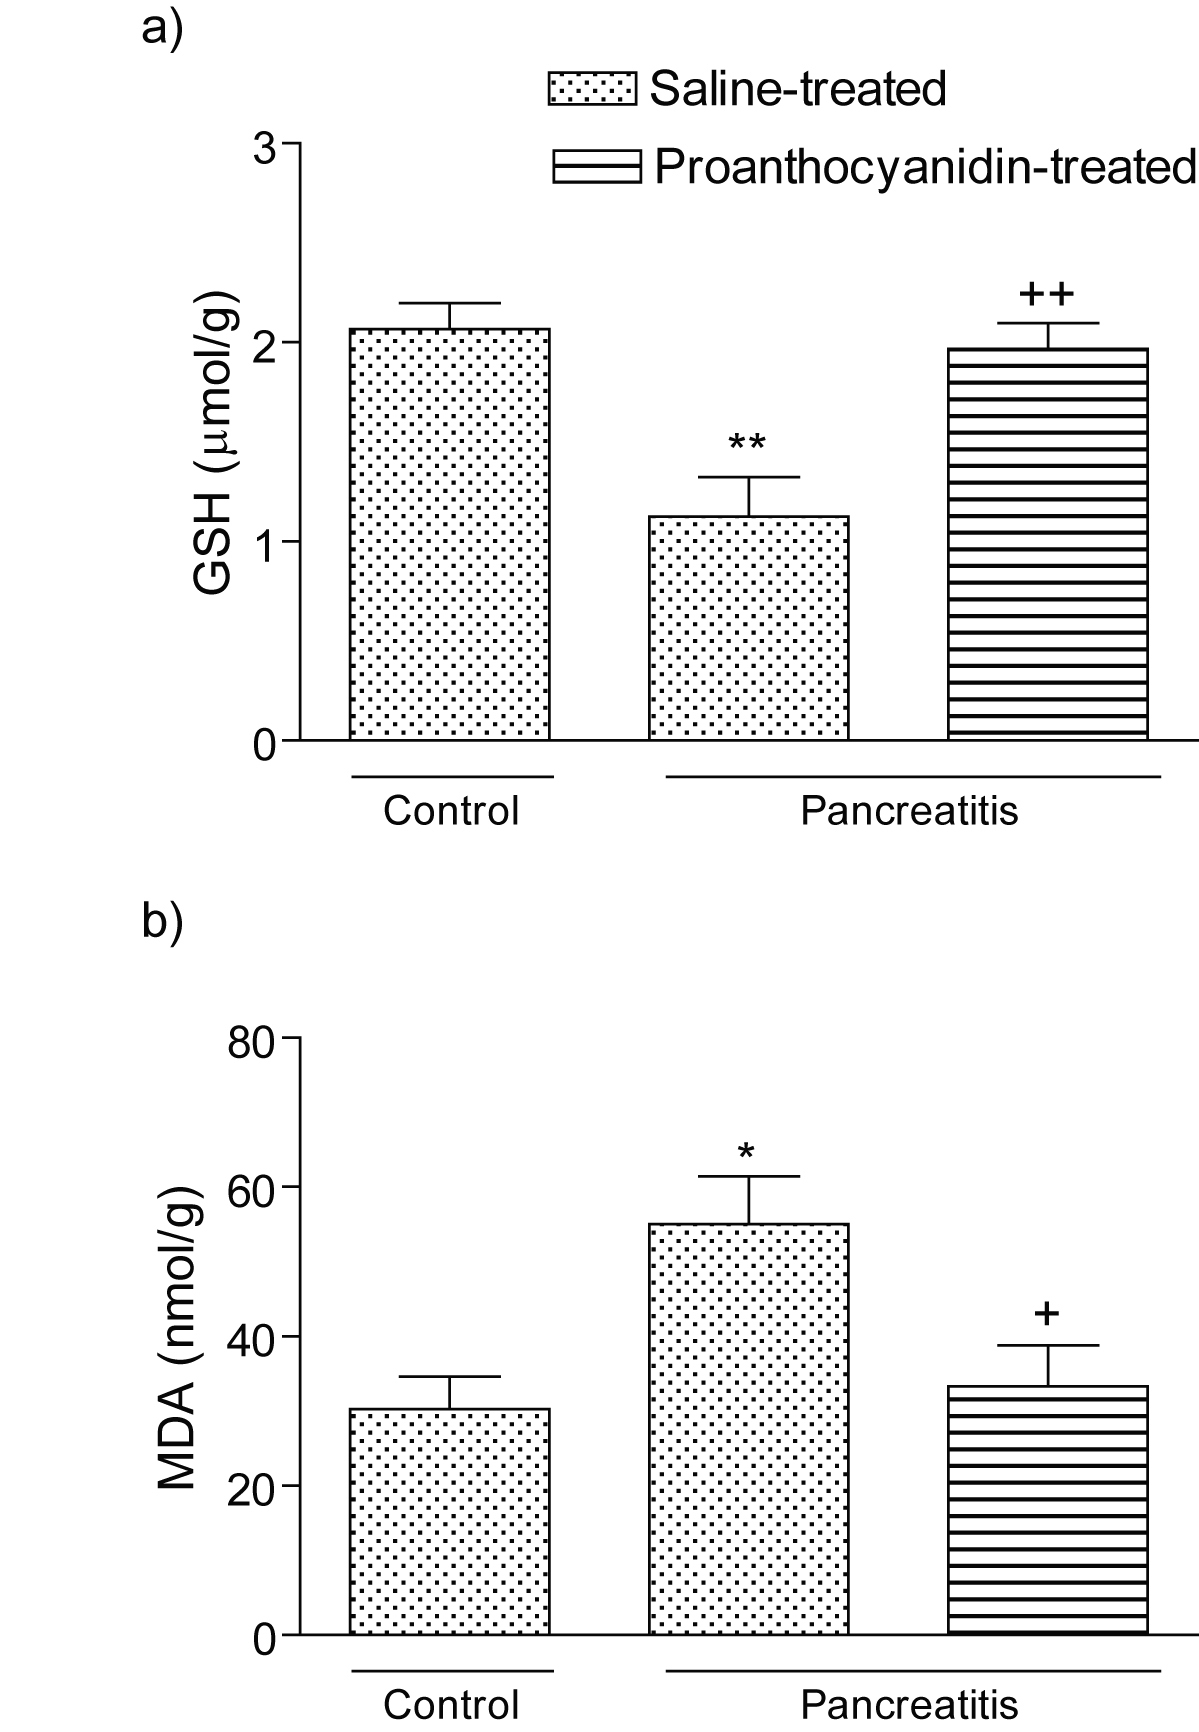
Figure 2. (a) Glutathione (GSH) level and (b) malondialdehyde (MDA) level in the pancreatic tissues of control, saline-treated pancreatitis and proanthocyanidin-treated pancreatitis groups. Each group consists of 6 animals. *p < 0.05, **p < 0.01, compared to the control group. +p < 0.01, ++p < 0.001, compared to saline-treated pancreatitis group.
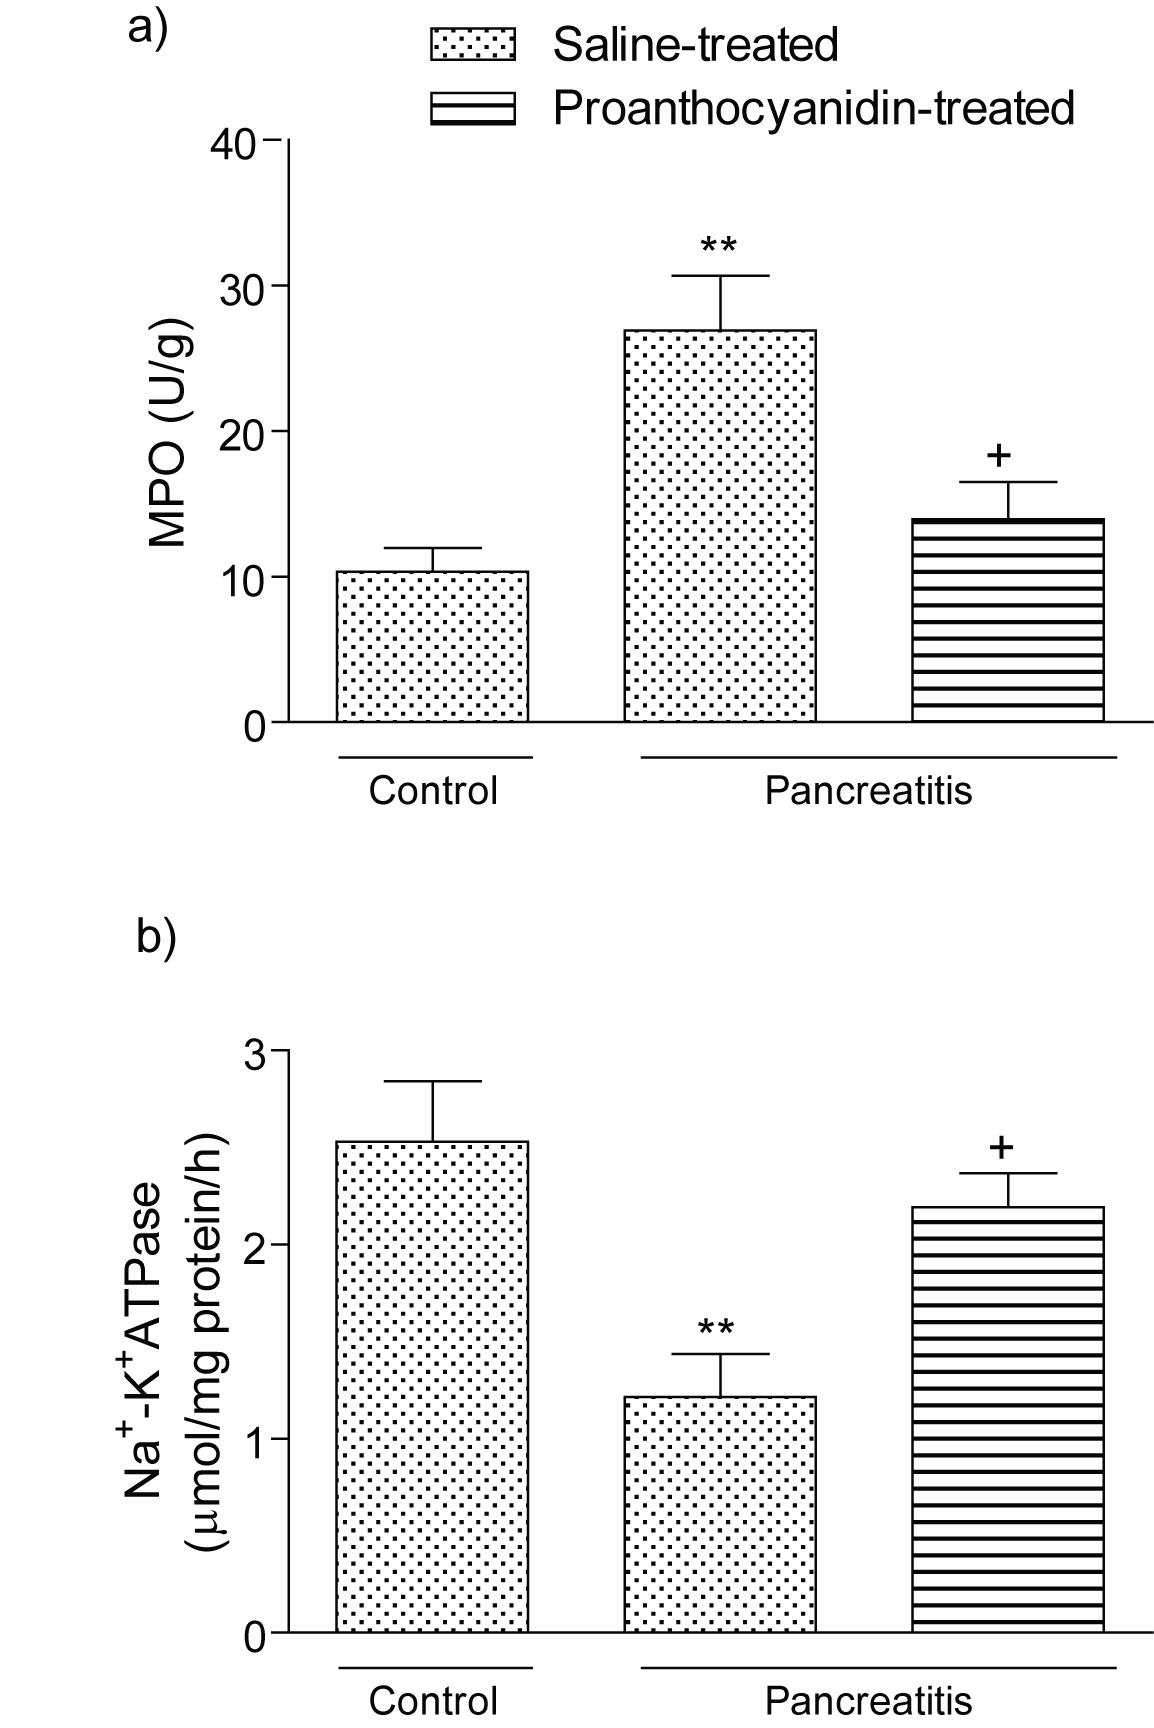
Figure 3. (a) Myeloperoxidase activity and (b) Na+-K+ ATPase activity in the pancreatic tissues of control, saline-treated pancreatitis and proanthocyanidin-treated pancreatitis groups. Each group consists of 6 animals. **p < 0.01, compared to the control group. +p < 0.05, compared to saline-treated pancreatitis group.
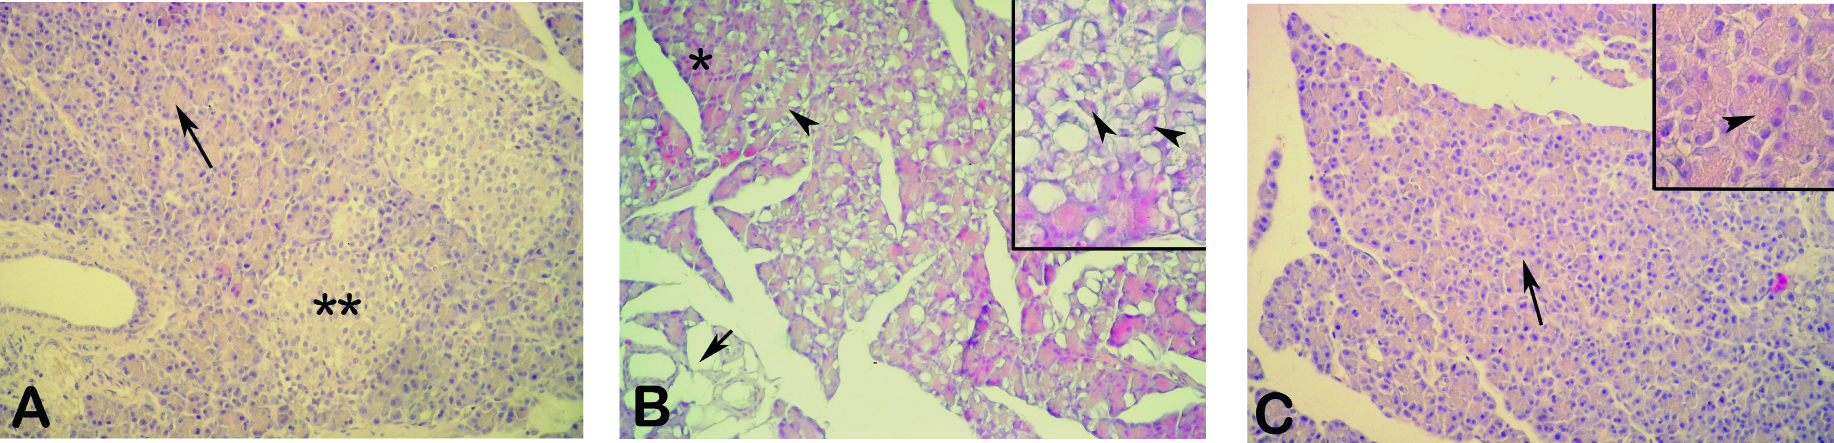
Figure 4. (A) Control group, regular acini (arrow) with Langerhans islets (**). (B) Cerulein treated group, severe degeneration of acini which shows thyroidization (arrowheads) with overall tissue vacuolization (arrow), note the partially intact acini (*), (C) Proanthocyanidin treated group, regenerated acini (arrow), loss of tissue vacuoles, cytoplasmic vacuolization (inset-arrowhead). HE, X200, insets X400.
Table
Table 1. The plasma amylase, lipase, tumour necrosis factor-α (TNF-α) and interleukin-1β (IL-1β) levels in sham control group or cerulein-induced acute pancreatitis groups treated with either saline or proanthocyanidine (100 mg/kg). Each group consists of 6 animals.
| Control | Pancreatitis |
|---|
| Saline-treated | Proanthocyanidin-treated |
|---|
| Data are the mean ± SEM of six animals. ***P < 0.001 compared to control group; ++P < 0.01, compared with the saline-treated pancreatitis group. |
| Amylase (U/L) | 646.03 ± 46.2 | 1202.82 ± 67.3 *** | 666.80 ± 53.7 ++ |
| Lipase (U/L) | 114.92 ± 23.2 | 393.37 ± 38.5 *** | 163.13 ± 26.7 ++ |
| TNF-α (pg/ml) | 5.37 ± 0.91 | 40.58 ± 8.54 *** | 15.30 ± 2.76 ++ |
| IL-1β (pg/ml) | 9.52 ± 1.69 | 52.07 ± 5.99 *** | 23.28 ± 4.99 ++ |