Figures
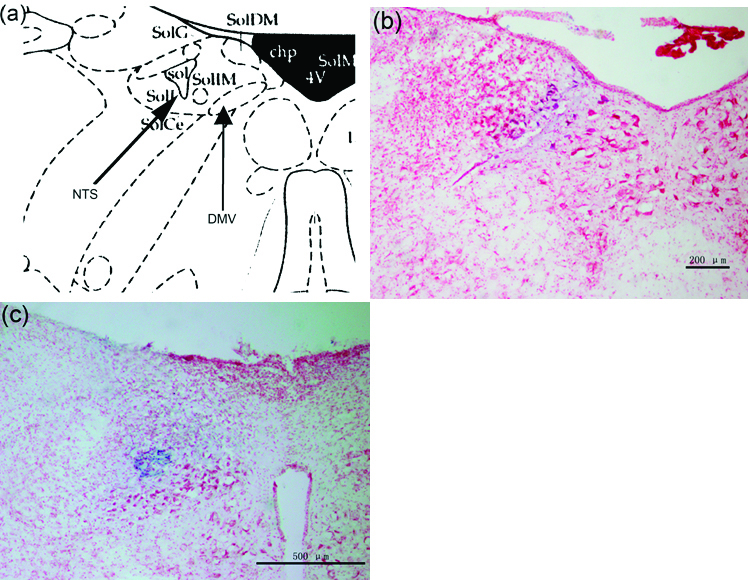
Figure 1. (a) Representative site of DMV and NTS in the brain atlas. (b) Brain stem section stained with neutral red, blue macula indicates DMV. (c) Brain stem section stained with neutral red, blue macula indicates NTS.
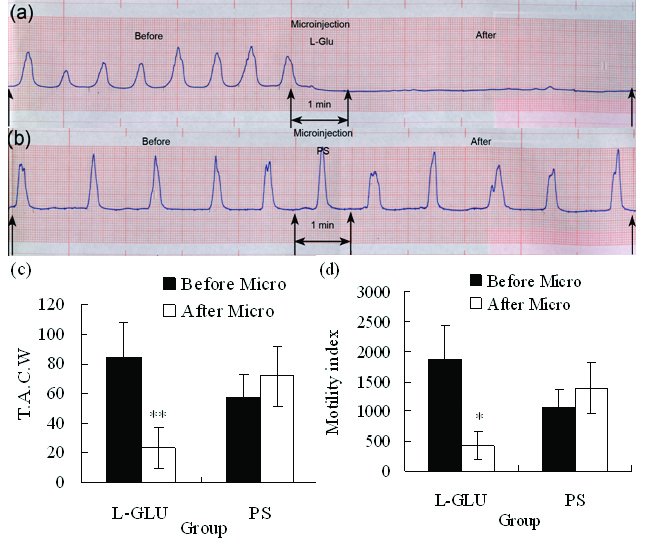
Figure 2. (a) Representative effects of L-Glu microinjected into the right DMV on gastric motility (representing curve from a rat). (b) Representative effects of PS microinjected into the right DMV on gastric motility (representing curve from a rat). (c) TACW before and after microinjection of L-Glu or PS into DMV. (d) Gastric motility index before and after microinjection of L-Glu (or PS into DMV. *P < 0.05; **P < 0.01, versus before microinjection. TACW, total amplitude of contraction waves; Micro, microinjection.
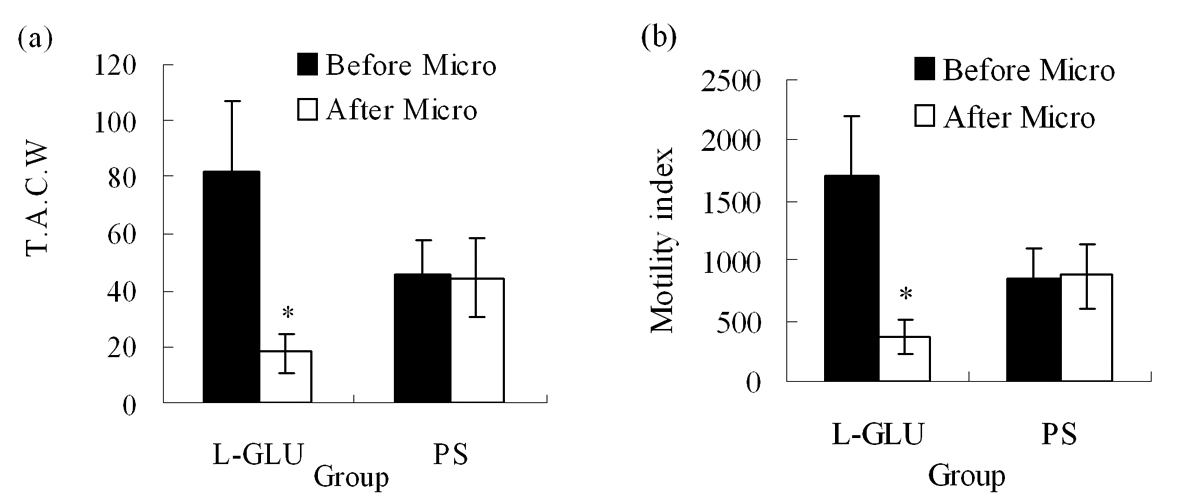
Figure 3. (a) TACW before and after microinjection of L-Glu or PS into NTS. (b) Gastric motility index before and after microinjection of L-Glu or PS into NTS. TACW, total amplitude of contraction waves; Micro, microinjection; *P < 0.05, versus before microinjection.
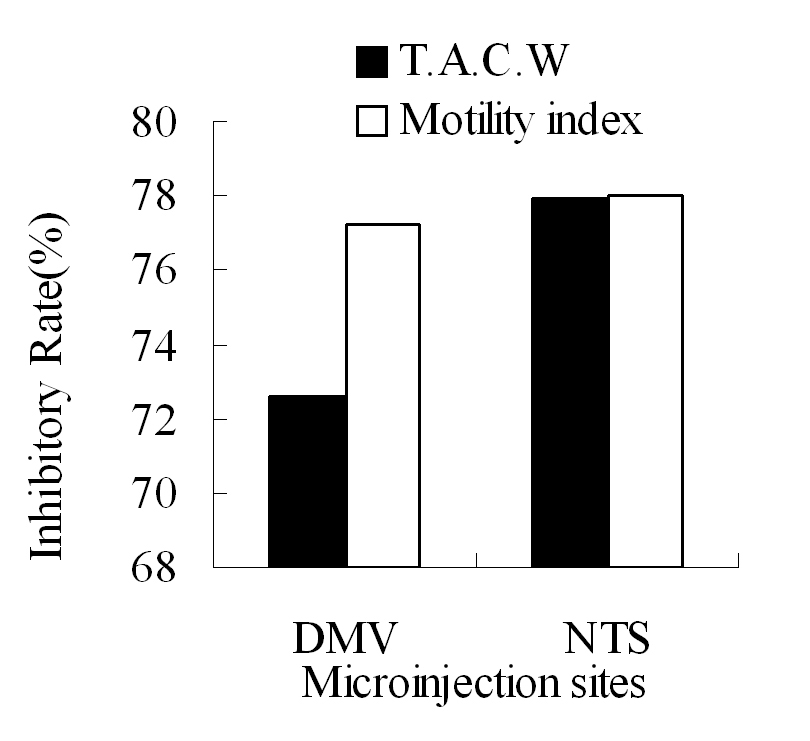
Figure 4. The inhibitory rate of T.A.C.W or gastric motility index after microinjection of L-Glu into the right DMV and NTS respectively. TACW, total amplitude of contraction waves.