Gastroenterology Research, ISSN 1918-2805 print, 1918-2813 online, Open Access
Article copyright, the authors; Journal compilation copyright, Gastroenterol Res and Elmer Press Inc
Journal website https://www.gastrores.org

Original Article

Volume 17, Number 1, February 2024, pages 23-31


Clinicopathological Aspects and Inflammation-Immune Markers in Alcohol and/or Hepatitis C Virus-Induced Hepatocellular Carcinoma Patients Treated With Sorafenib

Figure

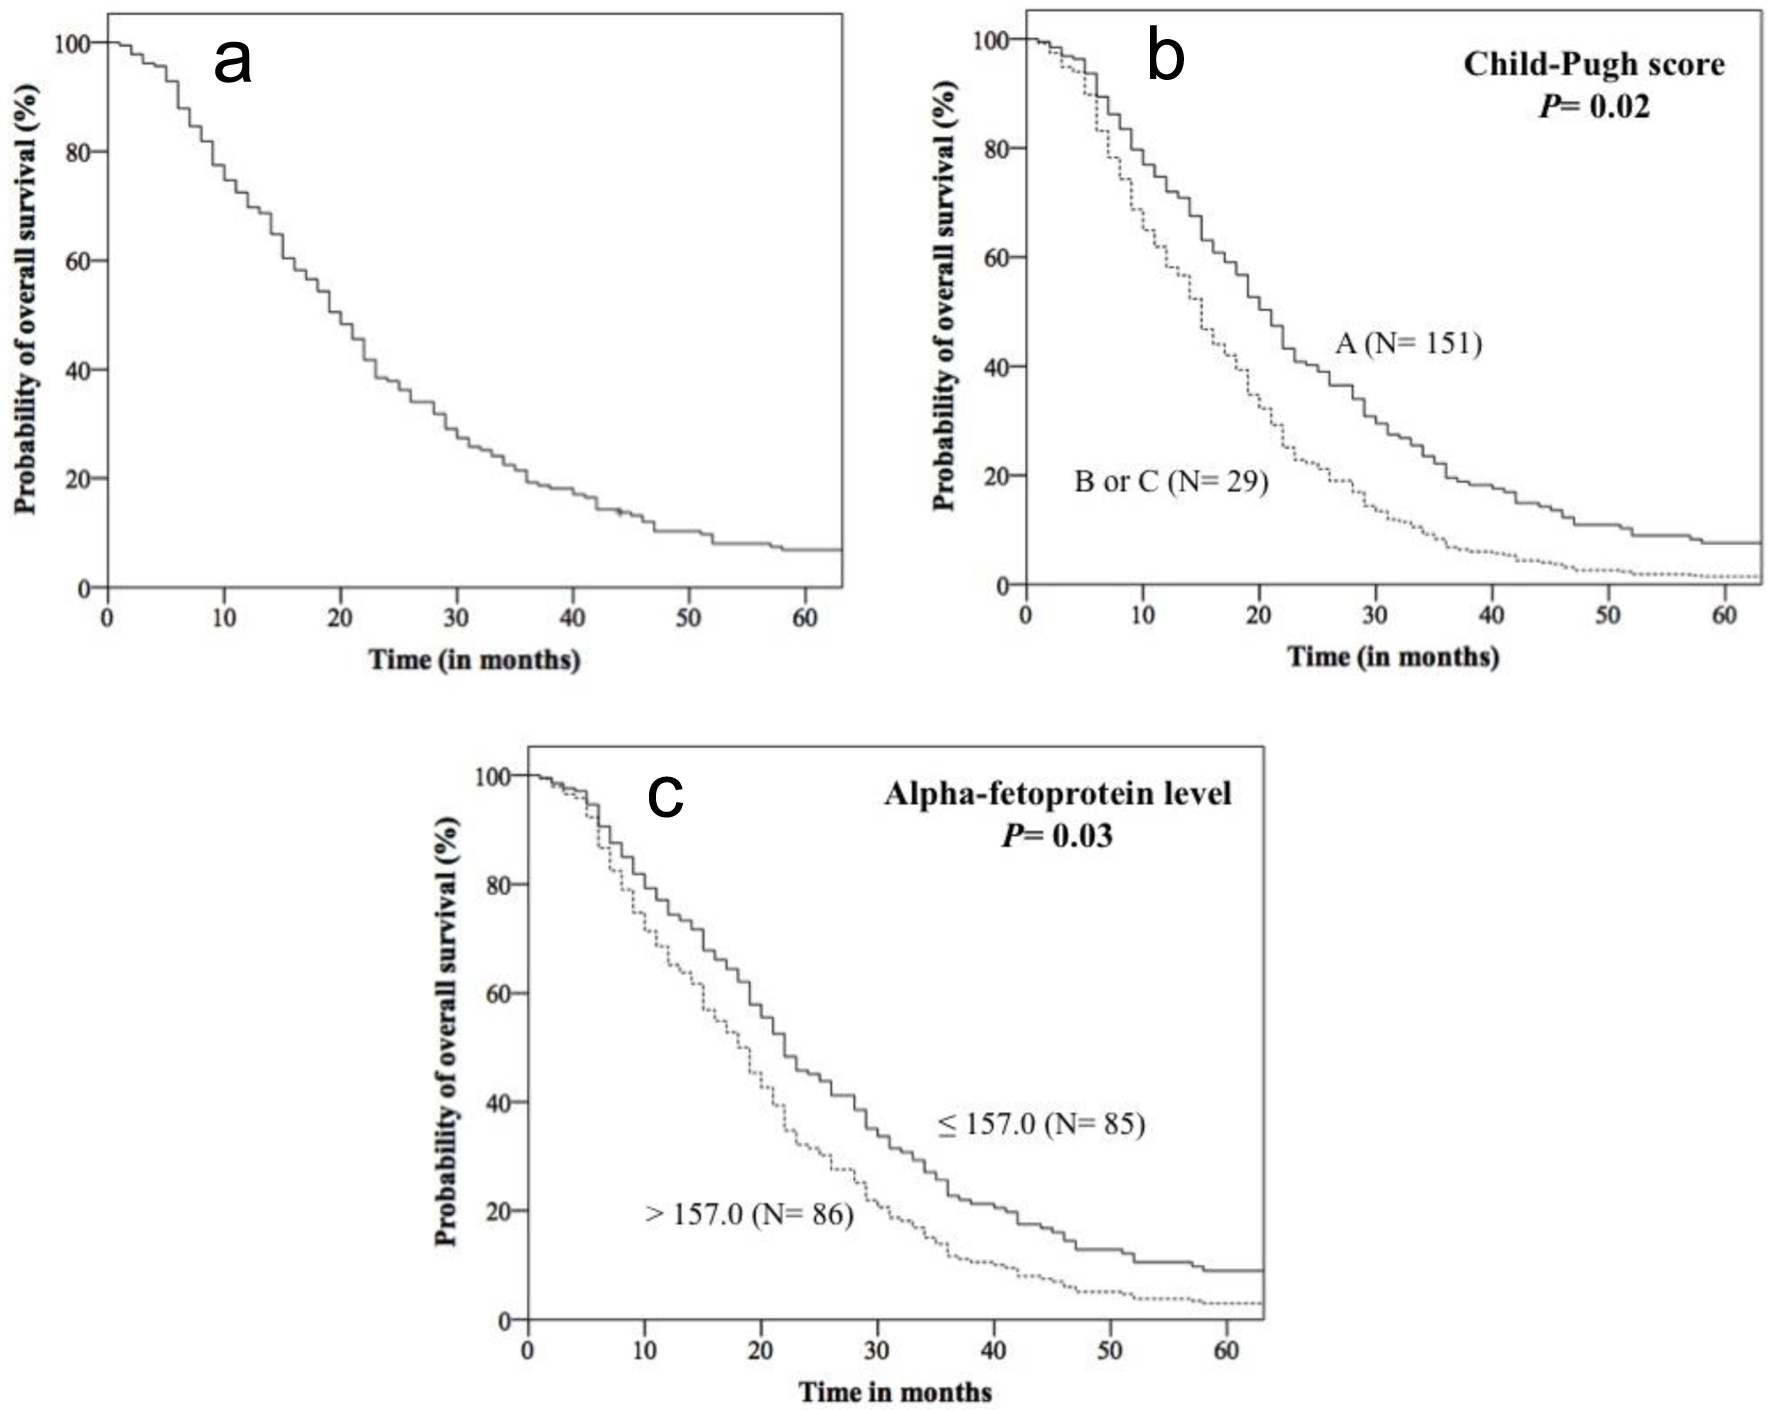
Figure 1.
Figure 1. Kaplan-Meier curves for overall survival of 182 patients with hepatocellular carcinoma treated with sorafenib obtained from data of Cox’s multivariate analysis. Overall survival of the entire cohort (a), and of patients stratified by Child-Pugh classification (b), and alpha-fetoprotein level (c).

Tables

Table 1. Baseline Characteristics of the 182 Patients With Hepatocellular Carcinoma
 
VariableMedian (min. - max.) or number (%)
SII: systemic inflammatory index; SIRI: systemic inflammation response index.
Age (years)60 (31 - 86)
Gender
  Male148 (81.3)
  Female34 (18.7)
Alcoholism
  Yes86 (47.2)
  Ex-drinker22 (12.1)
  No74 (40.7)
Smoking
  Yes74 (40.7)
  Ex-smoker17 (9.3)
  No91 (50.0)
Obesity
  Yes33 (18.1)
  No149 (81.9)
Neutrophil/µL3,120.0 (1,020.0 - 13,540.0)
Lymphocyte/µL1,370.0 (320.0 - 4,980.0)
Monocyte/µL500.0 (50.0 - 1,720.0)
Platelet/µL126,000.0 (38,000.0 - 666,000.0)
Neutrophil/lymphocyte ratio2.17 (0.5 - 14.4)
Platelet/lymphocyte ratio98,705.6 (26,108.0 - 1,016,667.0)
Lymphocyte/monocyte ratio2.80 (0.4 - 12.0)
SIRI1.07 (0.09 - 12.89)
SII307,786.3 (39,424.0 - 4,575,000.0)
Type 2 diabetes mellitus
  Yes60 (33.0)
  No122 (67.0)
Alpha-fetoprotein (ng/mL)157 (1.6 - 300,000.00)
Hepatitis B
  Yes13 (7.1)
  No169 (92.9)
Hepatitis C
  Yes107 (58.8)
  No75 (41.2)
Child-Pugh score
  A151 (83.0)
  B27 (14.8)
  C2 (1.2)
Grade 3 toxicity
  Yes35 (19.2)
  No147 (80.8)


Table 2. Association of Clinical and Pathological Aspects With Overall Survival of 182 Patients With Hepatocellular Carcinoma
 
VariableTotal N/N eventOverall survival
Univariate analysisMultivariate analysis
HR (95% CI)P valueHR (95% CI)P value
Bootstrapping analysis: aP = 0.02 and bP = 0.002. cThe number of individuals is different from the total number of the study (n = 182) because it was not possible to obtain consistent information about the variable in some patients. *P ≤ 0.05. AFP: alpha-foetoprotein; CI: confidence interval; HR: hazard ratio; LMR: lymphocyte-to-monocyte ratio; NA: variable not included in Cox’s multivariate analysis; NLR: neutrophil-to-lymphocyte ratio; PLR: platelet-to-lymphocyte ratio; SII: systemic inflammatory index; SIRI: systemic inflammation response index.
Age (years)
  ≤ 6094/91Reference0.63NANA
  > 6088/861.07 (0.80 - 1.44)
Gender
  Female34/32Reference0.16NANA
  Male148/451.31 (0.89 - 1.92)
Alcoholism
  No74/76Reference0.20NANA
  Yes or ex108/1061.21 (0.89 - 1.64)
Smoking
  No91/87Reference0.08Reference0.24
  Yes or ex91/901.30 (0.96 - 1.75)1.20 (0.87 - 1.64)
Obesity
  No149/144Reference0.52NANA
  Yes33/331.13 (0.77 - 1.65)
NLRc
  ≤ 2.292/92Reference0.78NANA
  > 2.288/831.04 (0.77 - 1.40)
PLRc
  ≤ 98,70586/84Reference0.53NANA
  > 98,70586/841.10 (0.81 - 1.49)
LMRc
  ≤ 2.886/84Reference0.31NANA
  > 2.887/851.17 (0.86 - 1.58)
SIRIc
  ≤ 1.0786/85Reference0.72NANA
  > 1.0787/841.05 (0.77 - 1.43)
SIIc
  ≤ 307,786.386/84Reference0.90NANA
  > 307,786.386/841.02 (0.75 - 1.38)
Type 2 diabetes
  No122/117Reference0.02*Reference0.17
  Yes60/601.42 (1.03 - 1.94)1.26 (0.89 - 1.78)
AFP (ng/mL)c
  ≤ 157.086/82Reference0.04*Reference0.03*a
  > 157.085/841.34 (1.00 - 1.82)1.40 (1.03 - 1.91)
Hepatitis B
  Negative169/164Reference0.73NANA
  Positive13/131.10 (0.62 - 1.94)
Hepatitis C
  Negative75/73Reference0.64NANA
  Positive107/1041.07 (0.79 - 1.44)
Child-Pugh score
  A151/146Reference0.009*Reference0.02*b
  B or C29/291.72 (1.14 - 2.59)1.64 (1.07 - 2.52)
Grade 3 toxicity
  Yes147/144Reference0.06Reference0.07
  No35/331.45 (0.99 - 2.13)1.44 (0.96 - 2.15)