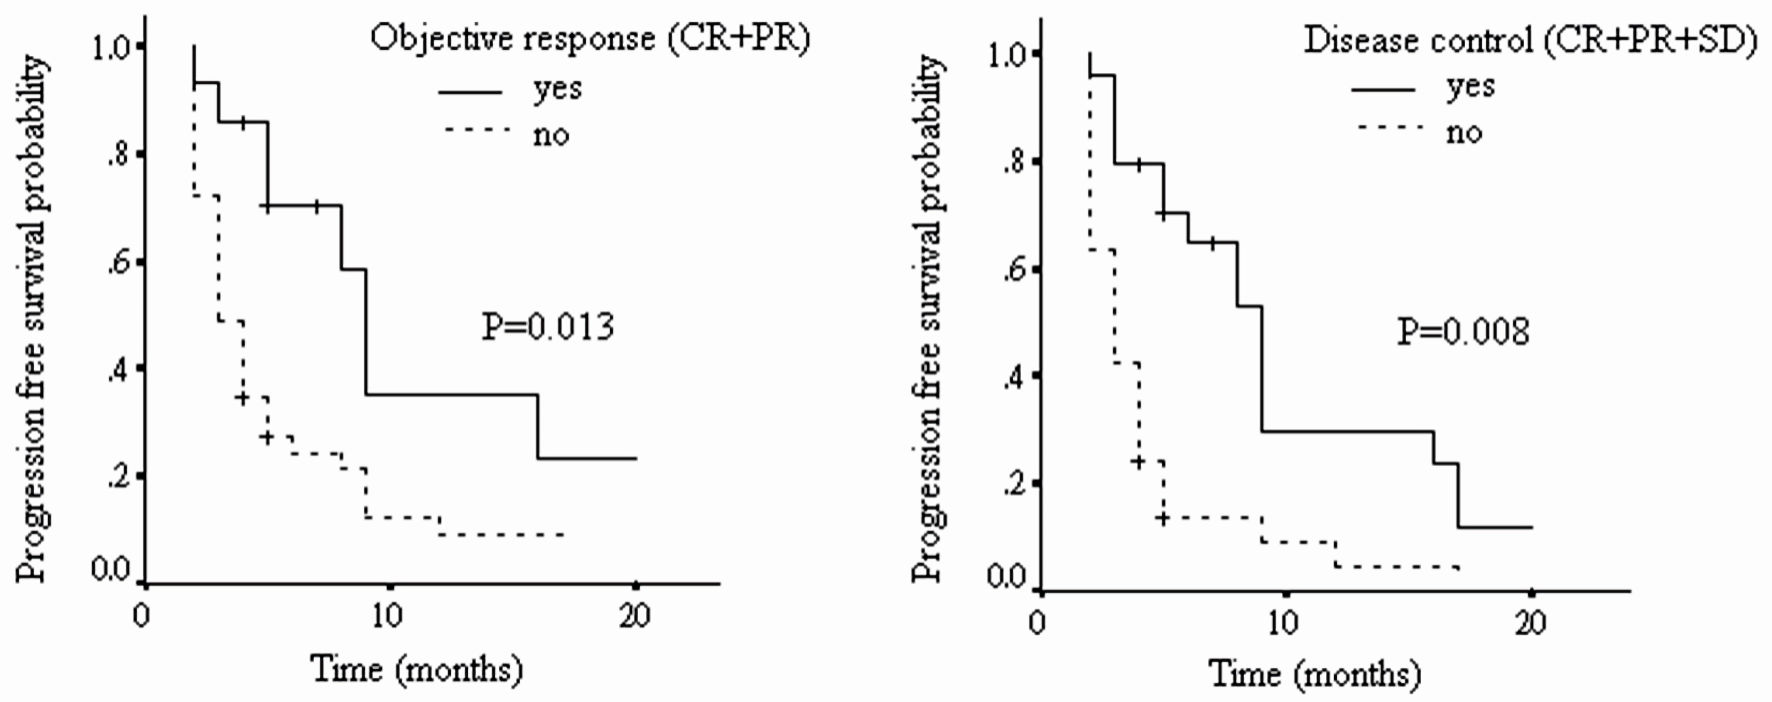
Figure 1. The progression-free survival of patients with different tumor radiological responses (CR: complete response; PR: partial response; SD: stable disease; PD: progressive disease).
| Gastroenterology Research, ISSN 1918-2805 print, 1918-2813 online, Open Access |
| Article copyright, the authors; Journal compilation copyright, Gastroenterol Res and Elmer Press Inc |
| Journal website https://www.gastrores.org |
Original Article
Volume 17, Number 1, February 2024, pages 15-22
A Real-World Experience on a Chinese Population of Patients With Unresectable Hepatocellular Carcinoma Treated With Nivolumab
Figures
Tables
| All (n = 57) | ||
|---|---|---|
| Mean ± SD | N (%) | |
| BCLC: Barcelona Clinic Liver Cancer; AFP: alpha-fetoprotein; EHS: extrahepatic spread; HBV: hepatitis B virus; HCV: hepatitis C virus; LRT: local regional therapy; MVI: microscopic vascular invasion; N: number of patients; NLR: neutrophil to lymphocyte ratio; SD: standard derivation; TKI: tyrosine kinase inhibitor; ALBI: albumin-bilirubin. | ||
| Age (years) | 66.7 ± 9.8 | |
| ≤ 65 | 34 (59.6%) | |
| > 65 | 23 (40.4%) | |
| Gender | ||
| Male | 48 (84.2%) | |
| Female | 9 (15.8%) | |
| Viral hepatitis | ||
| HBV | 26 (45.5%) | |
| HCV | 12 (21.1%) | |
| HBV/HCV | 2 (3.5%) | |
| Nil | 17 (29.9%) | |
| Child-Pugh stage | ||
| A | 40 (70.2%) | |
| B | 17 (29.8%) | |
| ALBI grade | ||
| 1 | 25 (43.9%) | |
| 2 | 30 (52.6%) | |
| 3 | 2 (3.5%) | |
| BCLC stage | ||
| B | 19 (33.3%) | |
| C | 38 (66.7%) | |
| MVI | 21 (36.8%) | |
| EHS | 25 (43.9%) | |
| Systemic therapy line | ||
| First-line | 14 (24.6%) | |
| Second-line | 43 (75.4%) | |
| Combined TKI | 9 (15.8%) | |
| Combined LRT | 8 (14.0%) | |
| Nivolumab dosage (mg/kg) | 2.5 ± 0.7 | |
| ≤ 2 mg/kg | 19 (33.3%) | |
| > 2 mg/kg | 38 (66.7%) | |
| Nivolumab duration (months) | 6.5 ± 5.9 | |
| Total bilirubin (mg/dL) | 1.0 ± 0.7 | |
| Albumin (g/dL) | 3.7 ± 0.6 | |
| NLR | ||
| > 5 | 14 (24.6%) | |
| ≤ 5 | 43 (75.4%) | |
| AFP (ng/mL) | 10,544.1 ± 46,120.1 | |
| > 400 ng/mL | 18 (31.6%) | |
| ≤ 400 ng/mL | 39 (68.4%) | |
| All (n = 57) | |||
|---|---|---|---|
| Mean | 95% CI | N (%) | |
| aDefined as decline AFP level over 10% from baseline during nivolumab therapy. AFP: alpha-fetoprotein; CR: complete response; DCR: disease control rate; IRAE: immune-related adverse event; N: number of patients; ORR: objective response rate; OS: overall survival; PD: progressive disease; PFS: progression-free survival; PR: partial response; SD: stable disease; CI: confidence interval. | |||
| Radiological tumor responses | |||
| CR | 2 (3.5%) | ||
| PR | 12 (21.1%) | ||
| SD | 10 (17.5%) | ||
| PD | 33 (57.9%) | ||
| ORR | 14 (24.6%) | ||
| DCR | 24 (42.1%) | ||
| OS (months) | 11.5 | 4.3 - 17.8 | |
| PFS (months) | 5.8 | 1.1 - 10.6 | |
| IRAE | 5 (8.8%) | ||
| AFP responsea | 17 (30.4%) | ||
| Univariable analysis | Multivariable analysis | |||||
|---|---|---|---|---|---|---|
| HR | 95% CI | P value | HR | 95% CI | P value | |
| aDefined as decline AFP level over 10% from baseline during nivolumab therapy. BCLC: Barcelona Clinic Liver Cancer; AFP: alpha-fetoprotein; CI: confidence interval; EHS: extrahepatic spread; HBV: hepatitis B virus; HCV: hepatitis C virus; HR: hazard ratio; IRAE: immune-related adverse event; LRT: local regional therapy; MVI: microscopic vascular invasion; NLR: neutrophil to lymphocyte ratio; TKI: tyrosine kinase inhibitor; ALBI: albumin-bilirubin. | ||||||
| Age (≤ 65 vs. > 65 years old) | 0.17 | 0.03 - 0.88 | 0.034 | 0.25 | 0.04 - 1.38 | 0.110 |
| Gender (male vs. female) | 0.86 | 0.16 - 4.70 | 0.859 | |||
| HBV (HbsAg + vs. -) | 0.72 | 0.21 - 2.42 | 0.590 | |||
| HCV (anti-HCV + vs. -) | 5.14 | 1.36 - 19.33 | 0.015 | 2.98 | 0.64 - 13.73 | 0.162 |
| Child-Pugh stage (B vs. A) | 0.31 | 0.61 - 1.58 | 0.159 | |||
| ALBI grade (2/3 vs. 1) | 0.72 | 0.21 - 2.42 | 0.595 | |||
| BCLC stage (C vs. B) | 0.87 | 0.25 - 3.08 | 0.828 | |||
| Baseline AFP (> 400 vs. ≤ 400 ng/mL) | 1.94 | 0.55 - 6.77 | 0.300 | |||
| AFP responsea (yes vs. no) | 7.65 | 2.01 - 29.14 | 0.003 | 4.89 | 1.14 - 21.00 | 0.033 |
| MVI (yes vs. no) | 0.61 | 0.16 - 2.27 | 0.463 | |||
| EHS (yes vs. no) | 0.95 | 0.28 - 3.20 | 0.931 | |||
| Systemic therapy (second-line vs. first-line) | 0.76 | 0.19 - 2.95 | 0.737 | |||
| Combined TKI (yes vs. no) | 1.68 | 0.36 - 7.85 | 0.508 | |||
| Combined LRT (yes vs. no) | 1.03 | 0.18 - 5.78 | 0.975 | |||
| Nivolumab dosage (> 2 vs. ≤ 2 mg/kg) | 1.34 | 0.36 - 5.00 | 0.664 | |||
| NLR (≤ 5 vs. > 5) | 1.26 | 0.30 - 5.37 | 0.754 | |||
| IRAE (yes vs. no) | 5.59 | 0.83 - 37.71 | 0.077 | |||
| Univariable analysis | Multivariable analysis | |||||
|---|---|---|---|---|---|---|
| HR | 95% CI | P value | HR | 95% CI | P value | |
| aDefined as decline AFP level over 10% from baseline during nivolumab therapy. BCLC: Barcelona Clinic Liver Cancer; AFP: alpha-fetoprotein; CI: confidence interval; EHS: extrahepatic spread; HBV: hepatitis B virus; HCV: hepatitis C virus; HR: hazard ratio; IRAE: immune-related adverse event; LRT: local regional therapy; MVI: microscopic vascular invasion; NLR: neutrophil to lymphocyte ratio; TKI: tyrosine kinase inhibitor; ALBI: albumin-bilirubin. | ||||||
| Age (≤ 65 vs. > 65 years old) | 0.31 | 0.10 - 0.99 | 0.048 | 0.41 | 0.12 - 1.40 | 0.156 |
| Gender (male vs. female) | 0.64 | 0.14 - 2.88 | 0.564 | |||
| HBV (HbsAg + vs. -) | 0.60 | 0.21 - 1.72 | 0.338 | |||
| HCV (anti-HCV + vs. -) | 2.25 | 0.66 - 7.67 | 0.195 | |||
| Child-Pugh stage (B vs. A) | 0.75 | 0.24 - 2.35 | 0.622 | |||
| ALBI grade (2/3 vs. 1) | 0.87 | 0.30 - 2.51 | 0.798 | |||
| BCLC stage (C vs. B) | 0.72 | 0.24 - 2.20 | 0.569 | |||
| Baseline AFP (> 400 vs. ≤ 400 ng/mL) | 2.23 | 0.72 - 6.96 | 0.166 | |||
| AFP responsea (yes vs. no) | 5.40 | 1.55 - 18.76 | 0.008 | 4.71 | 1.32 - 16.81 | 0.017 |
| MVI (yes vs. no) | 0.56 | 0.18 - 1.71 | 0.308 | |||
| EHS (yes vs. no) | 0.85 | 0.30 - 2.48 | 0.776 | |||
| Systemic therapy (second-line vs. first-line) | 0.65 | 0.19 - 2.20 | 0.492 | |||
| Combined TKI (yes vs. no) | 1.91 | 0.45 - 8.02 | 0.378 | |||
| Combined LRT (yes vs. no) | 0.80 | 0.17 - 3.73 | 0.776 | |||
| Nivolumab dosage (> 2 vs. ≤ 2 mg/kg) | 1.39 | 0.45 - 4.30 | 0.570 | |||
| NLR (≤ 5 vs. > 5) | 1.53 | 0.45 - 5.14 | 0.492 | |||
| IRAE (yes vs. no) | 6.40 | 0.70 - 61.42 | 0.108 | |||
| Univariable analysis | |||
|---|---|---|---|
| HR | 95% CI | P value | |
| aDefined as decline AFP level over 10% from baseline during nivolumab therapy. BCLC: Barcelona Clinic Liver Cancer; AFP: alpha-fetoprotein; CI: confidence interval; EHS: extrahepatic spread; HBV: hepatitis B virus; HCV: hepatitis C virus; HR: hazard ratio; IRAE: immune-related adverse event; LRT: local regional therapy; MVI: microscopic vascular invasion; NLR: neutrophil to lymphocyte ratio; TKI: tyrosine kinase inhibitor; ALBI: albumin-bilirubin. | |||
| Age (≤ 65 vs. > 65 years old) | 0.60 | 0.32 - 1.13 | 0.112 |
| Gender (male vs. female) | 0.59 | 0.27 - 1.29 | 0.187 |
| HBV (HbsAg + vs. -) | 0.74 | 0.40 - 1.40 | 0.356 |
| HCV (anti-HCV + vs. -) | 2.36 | 1.02 - 5.40 | 0.043 |
| Child-Pugh stage (B vs. A) | 0.75 | 0.38 - 1.49 | 0.418 |
| ALBI grade (2/3 vs. 1) | 0.58 | 0.30 - 1.11 | 0.101 |
| BCLC stage (C vs. B) | 0.61 | 0.30 - 1.27 | 0.187 |
| Baseline AFP (> 400 vs. ≤ 400 ng/mL) | 0.80 | 0.41 - 1.57 | 0.523 |
| AFP responsea (yes vs. no) | 1.38 | 0.69 - 2.80 | 0.364 |
| MVI (yes vs. no) | 0.86 | 0.45 - 1.64 | 0.646 |
| EHS (yes vs. no) | 0.58 | 0.31 - 1.10 | 0.095 |
| Systemic therapy (second-line vs. first-line) | 0.85 | 0.42 - 1.75 | 0.667 |
| Combined TKI (yes vs. no) | 1.34 | 0.61 - 2.92 | 0.463 |
| Combined LRT (yes vs. no) | 1.75 | 0.68 - 4.50 | 0.245 |
| Nivolumab dosage (> 2 vs. ≤ 2 mg/kg) | 1.03 | 0.53 - 2.00 | 0.921 |
| NLR (≤ 5 vs. > 5) | 1.17 | 0.57 - 2.41 | 0.663 |
| IRAE (yes vs. no) | 5.58 | 0.76 - 40.88 | 0.091 |
| Univariable analysis | |||
|---|---|---|---|
| HR | 95% CI | P value | |
| CI: confidence interval; DC: disease control; HR: hazard ratio; OR: objective response. | |||
| Progression-free survival | |||
| OR vs. non-OR | 2.63 | 1.23 - 5.66 | 0.013 |
| DC vs. non-DC | 2.89 | 1.56 - 5.37 | 0.008 |
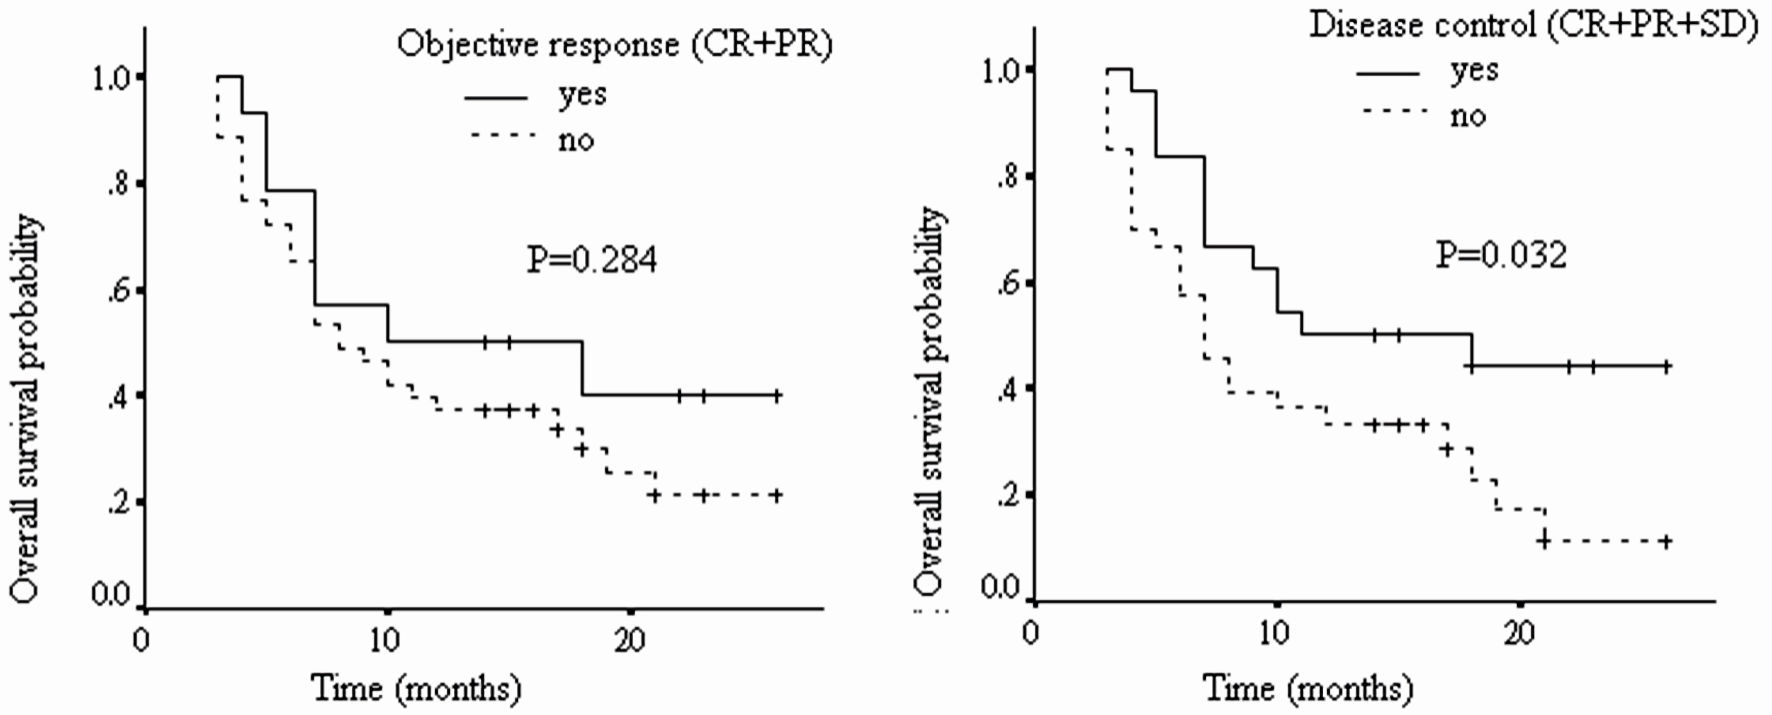
| Overall survival | |||
| OR vs. non-OR | 1.53 | 0.71 - 3.34 | 0.284 |
| DC vs. non-DC | 2.09 | 1.07 - 4.08 | 0.032 |