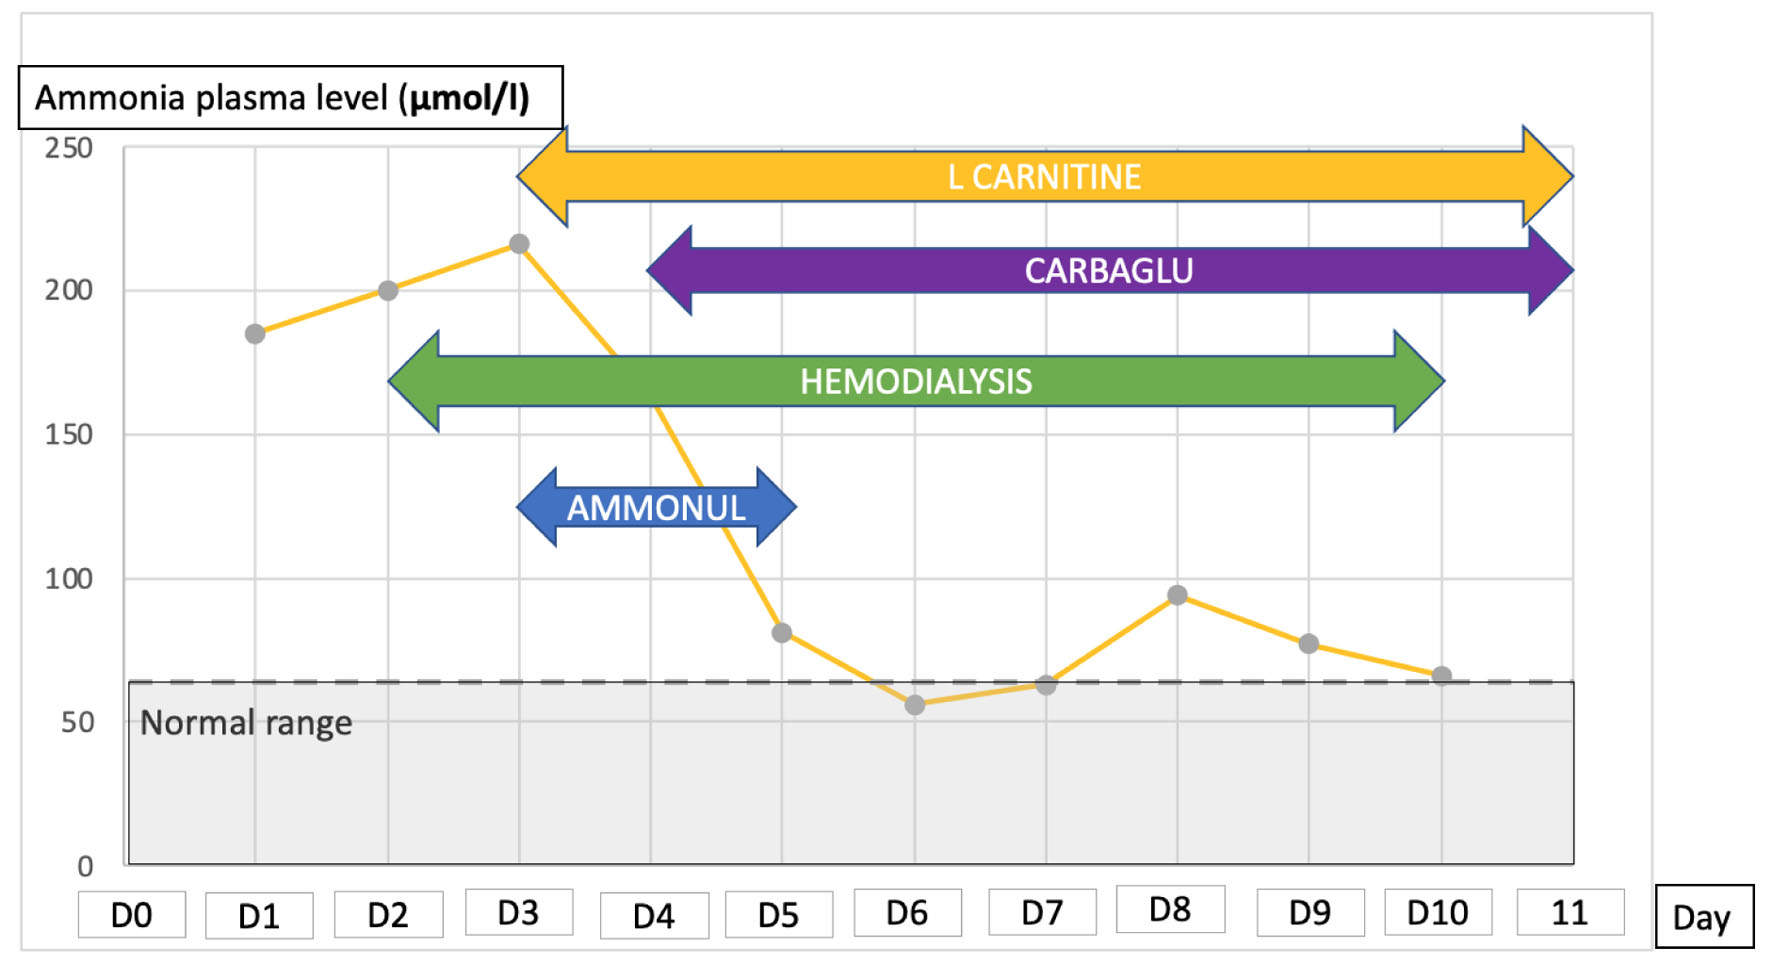
Figure 1. Evolution of plasma ammonia level during ICU stay and treatment for controlling the hyperammonemia. ICU: intensive care unit.
| Gastroenterology Research, ISSN 1918-2805 print, 1918-2813 online, Open Access |
| Article copyright, the authors; Journal compilation copyright, Gastroenterol Res and Elmer Press Inc |
| Journal website https://www.gastrores.org |
Case Report
Volume 16, Number 4, August 2023, pages 244-248
Coma With Hyperammonemia in a Patient With Kwashiorkor
Figures
Table
| Biological variables | Plasma concentration | Normal range |
|---|---|---|
| ALT: alanine aminotransferase; AST: aspartate aminotransferase; ICU: intensive care unit; INR: international normalized ratio. | ||
| Hemoglobin | 9.2 | 12 - 16 g/dL |
| Mean corpuscular volume | 113 | 80 - 100 fL |
| Platelet count | 63 | 150 - 450 g/L |
| White blood cell count | 17 | 4 - 10 g/L |
| Prothrombin time ratio | 27 | 70-120% |
| INR | 2.27 | |
| Factor II | 28 | 70-120% |
| Factor V | 52 | 70-120% |
| Factor VII | 10 | 70-120% |
| Factor VIII | > 480% | |
| Factor IX | 46 | 70-150% |
| Factor X | 23 | 70-120% |
| Sodium | 150 | 136 - 145 mmol/L |
| Potassium | 2.7 | 3.5 - 4.8 mmol/L |
| Total protein | 42 | 60 - 78 g/L |
| Albumin | 16 | 35 - 50 g/L |
| Urea | 3.0 | 2.1 - 7.1 mmol/L |
| Creatinine | 51.1 | 49 - 90 µmol/L |
| AST | 59 | 5 - 34 U/L |
| ALT | 10 | 0 - 55 U/L |
| Zinc | 4 | 11 - 18 µmol/L |
| Ionized calcium | 1.00 | 1.15 - 1.29 mmol/L |
| Phosphate | 0.72 | 0.74 - 1.52 mmol/L |
| Magnesium | 0.90 | 0.66 - 1.07 mmol/L |
| Haptoglobin | 0.67 | 0.35 - 2.50 g/L |
| Total cholesterol | 0.30 | 1.4 - 2 g/L |
| Triglycerides | 0.38 | 0 - 1.7 g/L |