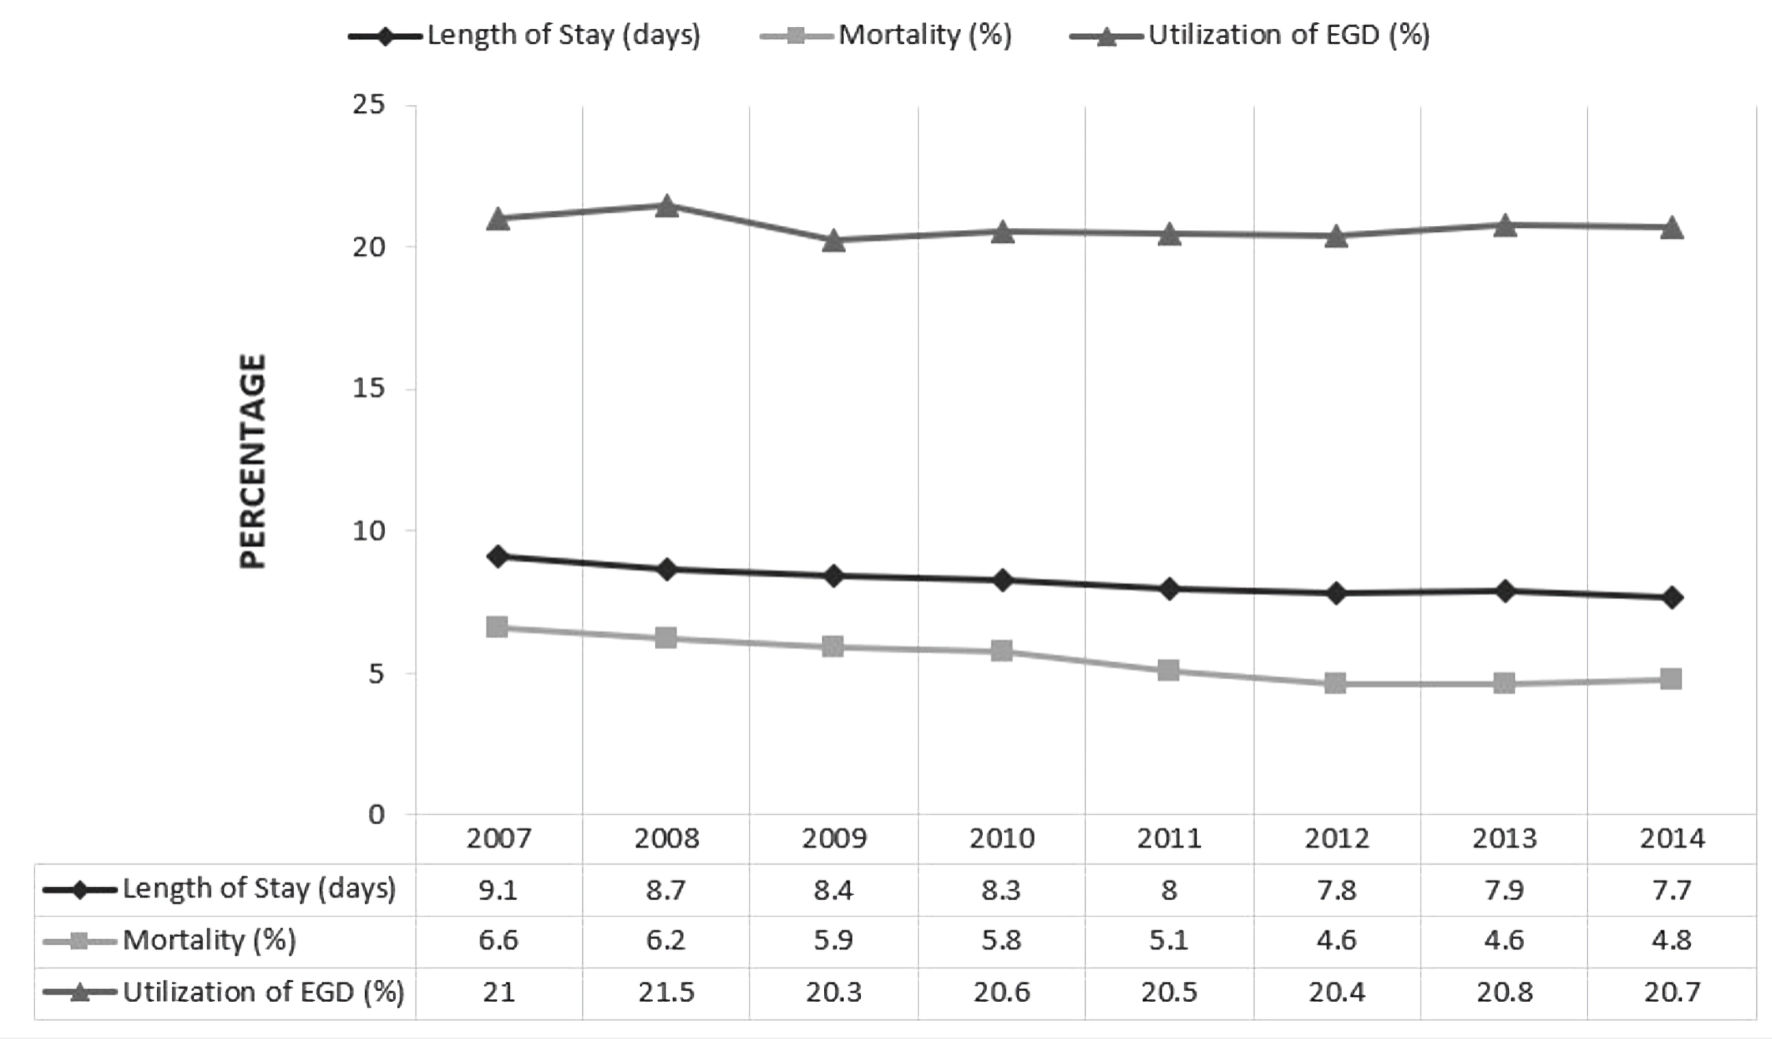
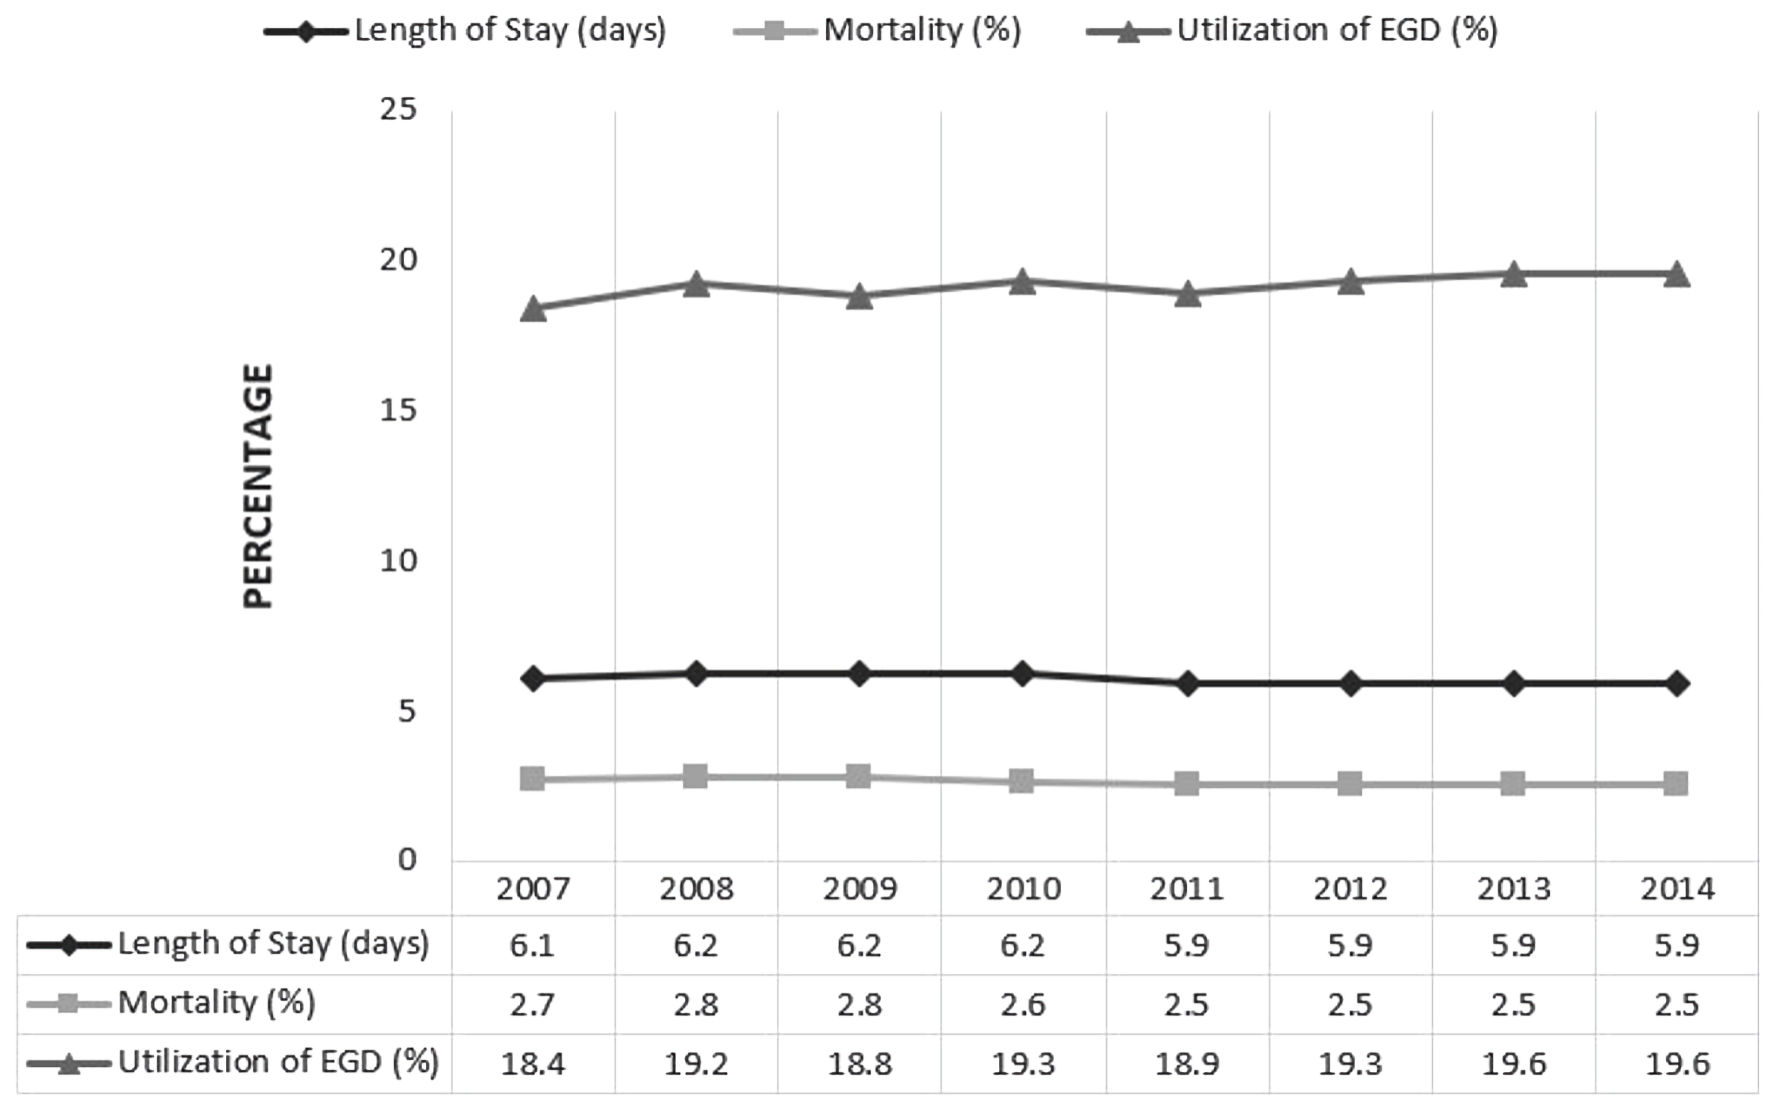
Figure 1. Trends of length of stay, esophagogastroduodenoscopy (EGD) utilization and all-cause inpatient mortality for peptic ulcer bleeding (PUB) hospitalizations with end-stage renal disease (ESRD) in the United States.
| Gastroenterology Research, ISSN 1918-2805 print, 1918-2813 online, Open Access |
| Article copyright, the authors; Journal compilation copyright, Gastroenterol Res and Elmer Press Inc |
| Journal website https://www.gastrores.org |
Original Article
Volume 16, Number 1, February 2023, pages 17-24
A Comparative Analysis of Bleeding Peptic Ulcers in Hospitalizations With and Without End-Stage Renal Disease
Figures
Tables
| Variables | PUB with ESRD | PUB without ESRD | P value |
|---|---|---|---|
| H. pylori: Helicobacter pylori. | |||
| Total number of hospitalizations | 351,965 | 2,037,037 | |
| Age (years) | 71.6 | 63.5 | < 0.001 |
| Gender | < 0.001 | ||
| Male | 196,360 (55.8%) | 997,936 (49%) | |
| Female | 155,605 (44.2%) | 1,039,101 (51%) | |
| Race | < 0.001 | ||
| White | 198,644 (63.2%) | 1,297,454 (72.4%) | |
| Black | 63,585 (20.2%) | 221,799 (12.4%) | |
| Hispanic | 28,831 (9.2%) | 152,650 (8.5%) | |
| Asian | 14,125 (4.5%) | 59,707 (3.3%) | |
| Native American | 1,677 (0.5%) | 10,830 (0.6%) | |
| Others | 7,648 (2.4%) | 49,999 (2.8%) | |
| H. pylori infection | 13,527 (3.8%) | 116,849 (5.7%) | < 0.001 |
| Inpatient mortality | 18,949 (5.4%) | 53,352 (2.6%) | < 0.001 |
| Length of stay (days) | 8.2 | 6 | < 0.001 |
| Esophagogastroduodenoscopy (EGD) | 72,840 (20.7%) | 389,784 (19.1%) | < 0.001 |
| Hospital bed size | < 0.001 | ||
| Large | 219,322 (62.7%) | 1,230,296 (60.7%) | |
| Medium | 89,445 (25.6%) | 533,817 (26.3%) | |
| Small | 41,301 (11.8%) | 262,116 (12.9%) | |
| Hospital location | < 0.001 | ||
| Urban teaching | 167,709 (47.9%) | 924,791 (45.6%) | |
| Urban non-teaching | 150,220 (42.9%) | 871,869 (43%) | |
| Rural | 32,139 (9.2%) | 229,569 (11.3%) | |
| Hospital region | < 0.001 | ||
| Northeast | 60,192 (17.1%) | 368,414 (18.1%) | |
| Midwest | 86,813 (24.7%) | 481,810 (23.7%) | |
| South | 131,181 (37.3%) | 786,158 (38.6%) | |
| West | 73,779 (21%) | 400,654 (19.7%) | |
| Primary payer | < 0.001 | ||
| Medicare | 269,817 (76.8%) | 1,073,633 (52.8%) | |
| Medicaid | 23,821 (6.8%) | 204,515 (10.1%) | |
| Private | 45,460 (12.9%) | 534,371 (26.3%) | |
| Self-pay | 6,585 (1.9%) | 141,970 (7%) | |
| Median household income (quartile) | < 0.001 | ||
| 1st (0 - 25th) | 105,810 (30.7%) | 569,429 (28.6%) | |
| 2nd (26th - 50th) | 89,408 (25.9%) | 530,758 (26.7%) | |
| 3rd (51st - 75th) | 81,799 (23.7%) | 479,937 (24.1%) | |
| 4th (76th - 100th) | 67,885 (19.7%) | 410,205 (20.6%) | |
| Variables | Odds ratio (OR) | 95% confidence interval (CI) |
|---|---|---|
| Age | 0.994 | 0.991 - 0.997 |
| Male (reference = female) | 0.974 | 0.908 - 1.044 |
| Black (reference = White) | 0.757 | 0.683 - 0.840 |
| Hispanic (reference = White) | 0.953 | 0.834 - 1.089 |
| Asian or Pacific Islander (reference = White) | 0.788 | 0.650 - 0.955 |
| Native American (reference = White) | 1.421 | 0.934 - 2.162 |
| 2011 - 2014 study period (reference = 2007 - 2010) | 0.696 | 0.645 - 0.751 |