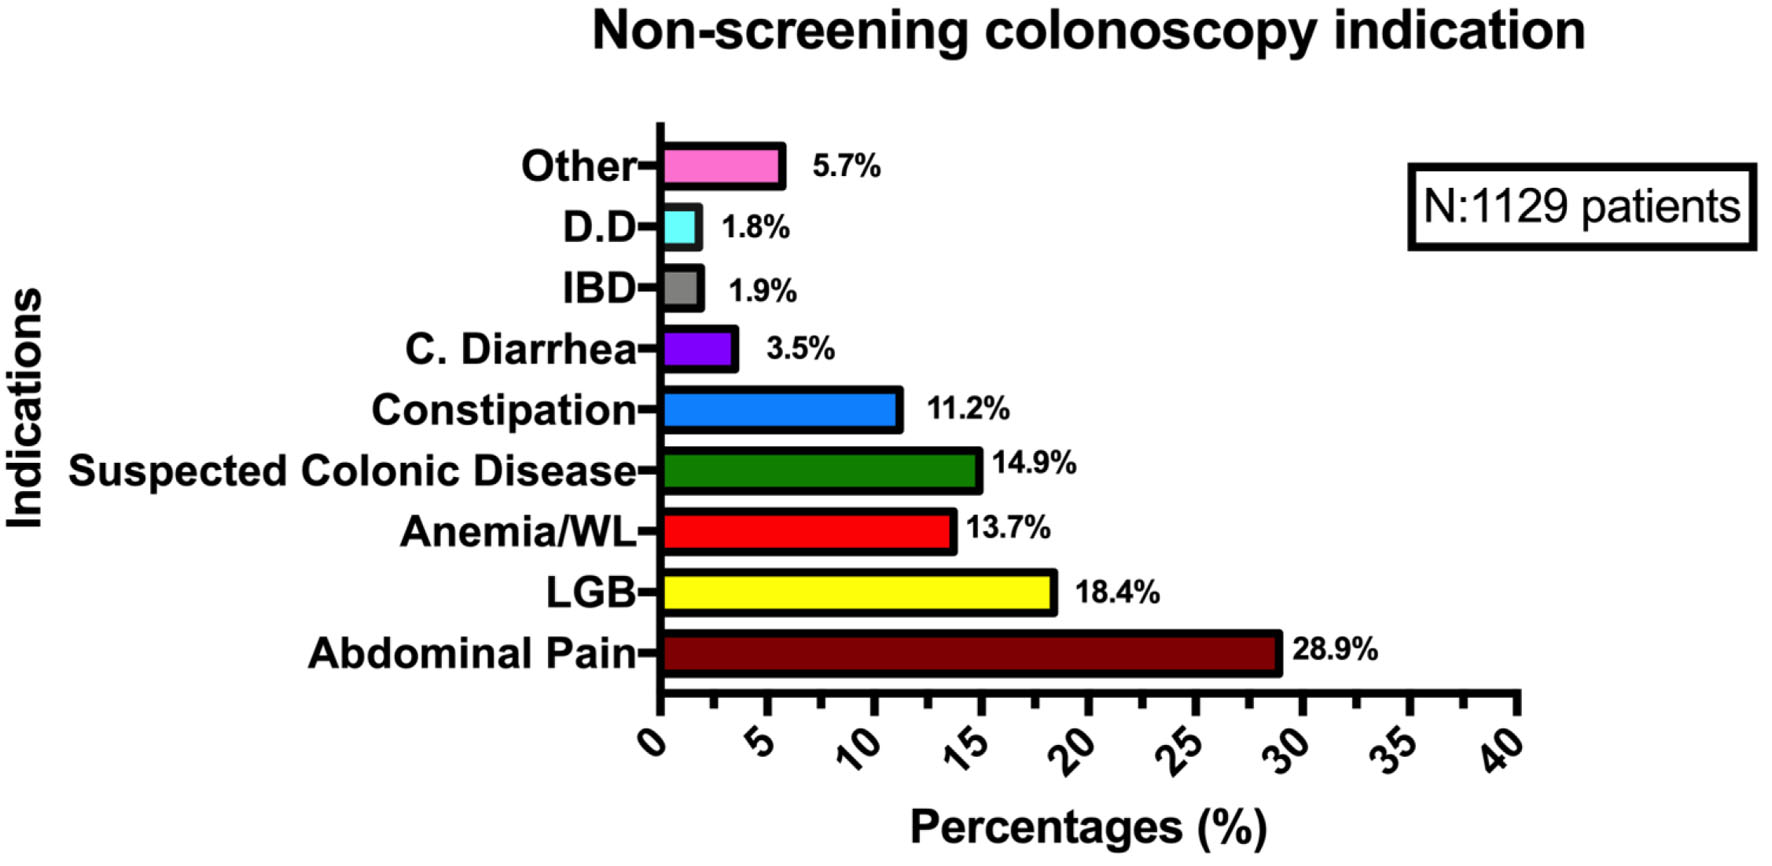
Figure 1. Non-screening colonoscopy indications. DD: diverticular disease; IBD: inflammatory bowel disease; C. diarrhea: chronic diarrhea; WL: weight loss; LGB: low gastrointestinal bleeding.
| Gastroenterology Research, ISSN 1918-2805 print, 1918-2813 online, Open Access |
| Article copyright, the authors; Journal compilation copyright, Gastroenterol Res and Elmer Press Inc |
| Journal website https://www.gastrores.org |
Original Article
Volume 16, Number 2, April 2023, pages 96-104
Is There a Difference in Adenoma Detection Rates According to Indication? An Experience in a Panamanian Colorectal Cancer Screening Program
Figures
Tables
| Variable | Screening (n = 365) | Non-screening (n = 1,129) | P value |
|---|---|---|---|
| CIR: cecal intubation rate; WT: withdrawal time; BBPS: Boston Bowel Preparation Scale; SD: standard deviation. | |||
| Age (years) | 56.9 ± 0.42 | 60.7 ± 0.42 | 0.003 |
| Sex | 0.004 | ||
| Male | 89 (24.4%) | 365 (32.3%) | |
| Female | 272 (74.5%) | 753 (66.7%) | |
| Non-specified | 4 (1%) | 11 (1%) | |
| Endoscopist | 0.0021 | ||
| Endoscopist 1 | 27 (8.2%) | 96 (9.23%) | |
| Endoscopist 2 | 25 (7.6%) | 118 (11.4%) | |
| Endoscopist 3 | 40 (12.1%) | 113 (10.9%) | |
| Endoscopist 4 | 36 (10.9%) | 85 (8.2%) | |
| Endoscopist 5 | 50 (15.1%) | 109 (10.5%) | |
| Endoscopist 6 | 91 (27.5%) | 324 (31.2%) | |
| Endoscopist 7 | 38 (11.5%) | 145 (13.9%) | |
| Non-specified | 17 (5.1%) | 20 (1.9%) | |
| Total | 331 (100%) | 1,040 (100%) | |
| CIR (%) | 340 (93.1%) | 1,049 (92.9%) | 0.174 |
| WT (min) | 10.19 (SD: 0.49) | 9.20 (SD: 0.24) | 0.034 |
| Colonoscopy working time | 19.03 (SD: 1.2) | 17.35 (SD: 0.96) | 0.001 |
| BBPS ≥ 6 (%) | 273 (74.5%) | 892 (79.0%) | 0.075 |
| Family history of colon cancer (%) | 80 (24.2%) | 151 (14.5%) | 0.002 |
| Diverticulosis (%) | 143 (43.2%) | 385 (37%) | 0.102 |
| Inflammatory bowel disease (%) | 6 (1.8%) | 52 (15.7%) | 0.001 |
| Angiodysplasia (%) | 2 (0.6%) | 2 (0.2%) | 0.732 |
| Hemorroids (%) | 84 (25.4%) | 277 (26.6%) | 0.471 |
| Polyps (%) | 106 (32.0%) | 257 (24.7%) | 0.082 |
| Polyp size | 0.13 | ||
| ≤ 5 mm | 65 (61.3%) | 165 (64.2%) | |
| 6 - 10 mm | 21 (19.8%) | 53 (20.6%) | |
| 11 - 20 mm | 12 (11.3%) | 17 (6.6%) | |
| > 21 mm | 0 (0) | 5 (1.9%) | |
| Non-specified | 9 (8.4%) | 17 (6.6%) | |
| Polyp histology | 0.551 | ||
| Hyperplasic polyp | 37 (34.9%) | 91 (35.4%) | |
| Tubular adenoma | 47 (44.3%) | 113 (43.9%) | |
| Villous adenoma | 0 (0) | 3 (1.2%) | |
| Tubulovillous adenoma | 9 (8.5%) | 16 (6.2%) | |
| Traditional serrated polyp | 0 (0) | 0 | |
| Serrated polyp | 0 (0) | 0 | |
| No-classified | 13 (12.3%) | 11 (9.7%) | |
| Dysplasia | 46 (13.9%) | 108 (10.4%) | 0.041 |
| Colon cancer | 5 (1.5%) | 12 (1.2%) | 0.055 |
| Features | Tubular adenoma (N = 160) | Villous adenoma (N = 3) | Tubulovillous adenoma (N = 25) | Hyperplasic polyp (N = 128) | No classified (N = 24) | Colon cancer (N = 17) |
|---|---|---|---|---|---|---|
| Localization | ||||||
| Proximal | 58 (36.3%) | 0 (0) | 5 (20%) | 51 (39.8%) | 7 (29.2%) | 8 (47.5%) |
| Distal | 52 (32.5%) | 2 (66.6%) | 11 (44%) | 62 (48.4%) | 9 (37.5%) | 9 (52.5%) |
| Synchronous | 50 (31.3%) | 1 (33.3%) | 9 (36%) | 15 (11.7%) | 8 (33.3%) | |
| Size | ||||||
| < 5 mm | 100 (62.5%) | 0 (0) | 12 (48%) | 92 (71.8%) | 17 (70.8%) | 4 (23.5%) |
| 10 mm | 33 (20.6%) | 1 (33.3%) | 4 (16%) | 27 (21.1%) | 6 (25%) | 2 (11.7%) |
| 11 - 20 mm | 15 (9.4%) | 1 (33.3%) | 6 (24%) | 3 (2.3%) | 1 (4.2%) | 3 (17.6%) |
| > 21 mm | 3 (1.9%) | 1 (33.3%) | 1 (4%) | 0 (0) | 0 (0) | 8 (47.1%) |
| No-specified | 9 (5.6%) | 0 (0) | 0 (0) | 6 (4.7%) | 0 (0) | 0 (0) |
| Dysplasia | ||||||
| No | 31 (19.4%) | 1 (33.3%) | 4 (16%) | 127 (99.2%) | 21 (87.5%) | 0 |
| Low grade | 117 (73.1%) | 1 (33.3%) | 16 (64%) | 1 (0.8%) | 3 (12.5%) | 0 |
| High grade | 12 (7.5%) | 1 (33.3%) | 5 (20%) | 0 (0) | 0 | 0 |
| Endoscopist | Screening group BBPS ≥ 6 (%) | Non-screening group BBPS ≥ 6 (%) | P | Screening group CIR (%) | Non-screening group CIR (%) | P | Screening group WT (min) | Non-screening group WT (min) | P |
|---|---|---|---|---|---|---|---|---|---|
| BBPS: Boston Bowel Preparation Scale; CIR: cecal intubation rate; WT: withdrawal time. | |||||||||
| Endoscopist 1 | 22/23 (95.7%) | 69/78 (88.5%) | 0.031 | 27/30 (90%) | 91/101 (90.1%) | 0.177 | 9.48 ± 1.49 | 6.46 ± 0.47 | 0.011 |
| Endoscopist 2 | 15/22 (68.2%) | 83/112 (74.1%) | 0.124 | 23/31 (74.2%) | 117/138 (84.8%) | 0.041 | 7.45 ± 0.67 | 8.45 ± 0.79 | 0.578 |
| Endoscopist 3 | 32/35 (91.4%) | 76/106 (71.7%) | 0.002 | 37/45 (82.2%) | 108/124 (87.1%) | 0.055 | 7.43 ± 1.75 | 6.66 ± 0.39 | 0.531 |
| Endoscopist 4 | 24/31 (77.5%) | 45/67 (67.2%) | 0.044 | 32/40 (80.0%) | 67/87 (77.0%) | 0.081 | 7.74 ± 0.99 | 7.06 ± 0.71 | 0.532 |
| Endoscopist 5 | 38/51 (74.5%) | 83/101 (82.2%) | 0.049 | 50/52 (96.1%) | 101/111 (90.9%) | 0.069 | 12.1 ± 1.22 | 12.61 ± 0.98 | 0.759 |
| Endoscopist 6 | 56/90 (62.2%) | 193/291 (66.3%) | 0.321 | 90/91 (98.9%) | 296/322 (91.9%) | 0.181 | 12.35 ± 1.04 | 10.17 ± 0.44 | 0.013 |
| Endoscopist 7 | 33/36 (91.7%) | 104/135 (77.0%) | 0.006 | 37/41 (90.2%) | 129/149 (86.6%) | 0.065 | 11.27 ± 1.68 | 10.56 ± 0.58 | 0.306 |
| Total | 273/365 (74.5%) | 892/1,129 (79.0%) | 0.075 | 340/365 (93.1%) | 1,049/1,129 (92.9%) | 0.174 | 10.19 ± 0.49 | 9.20 ± 0.24 | 0.046 |