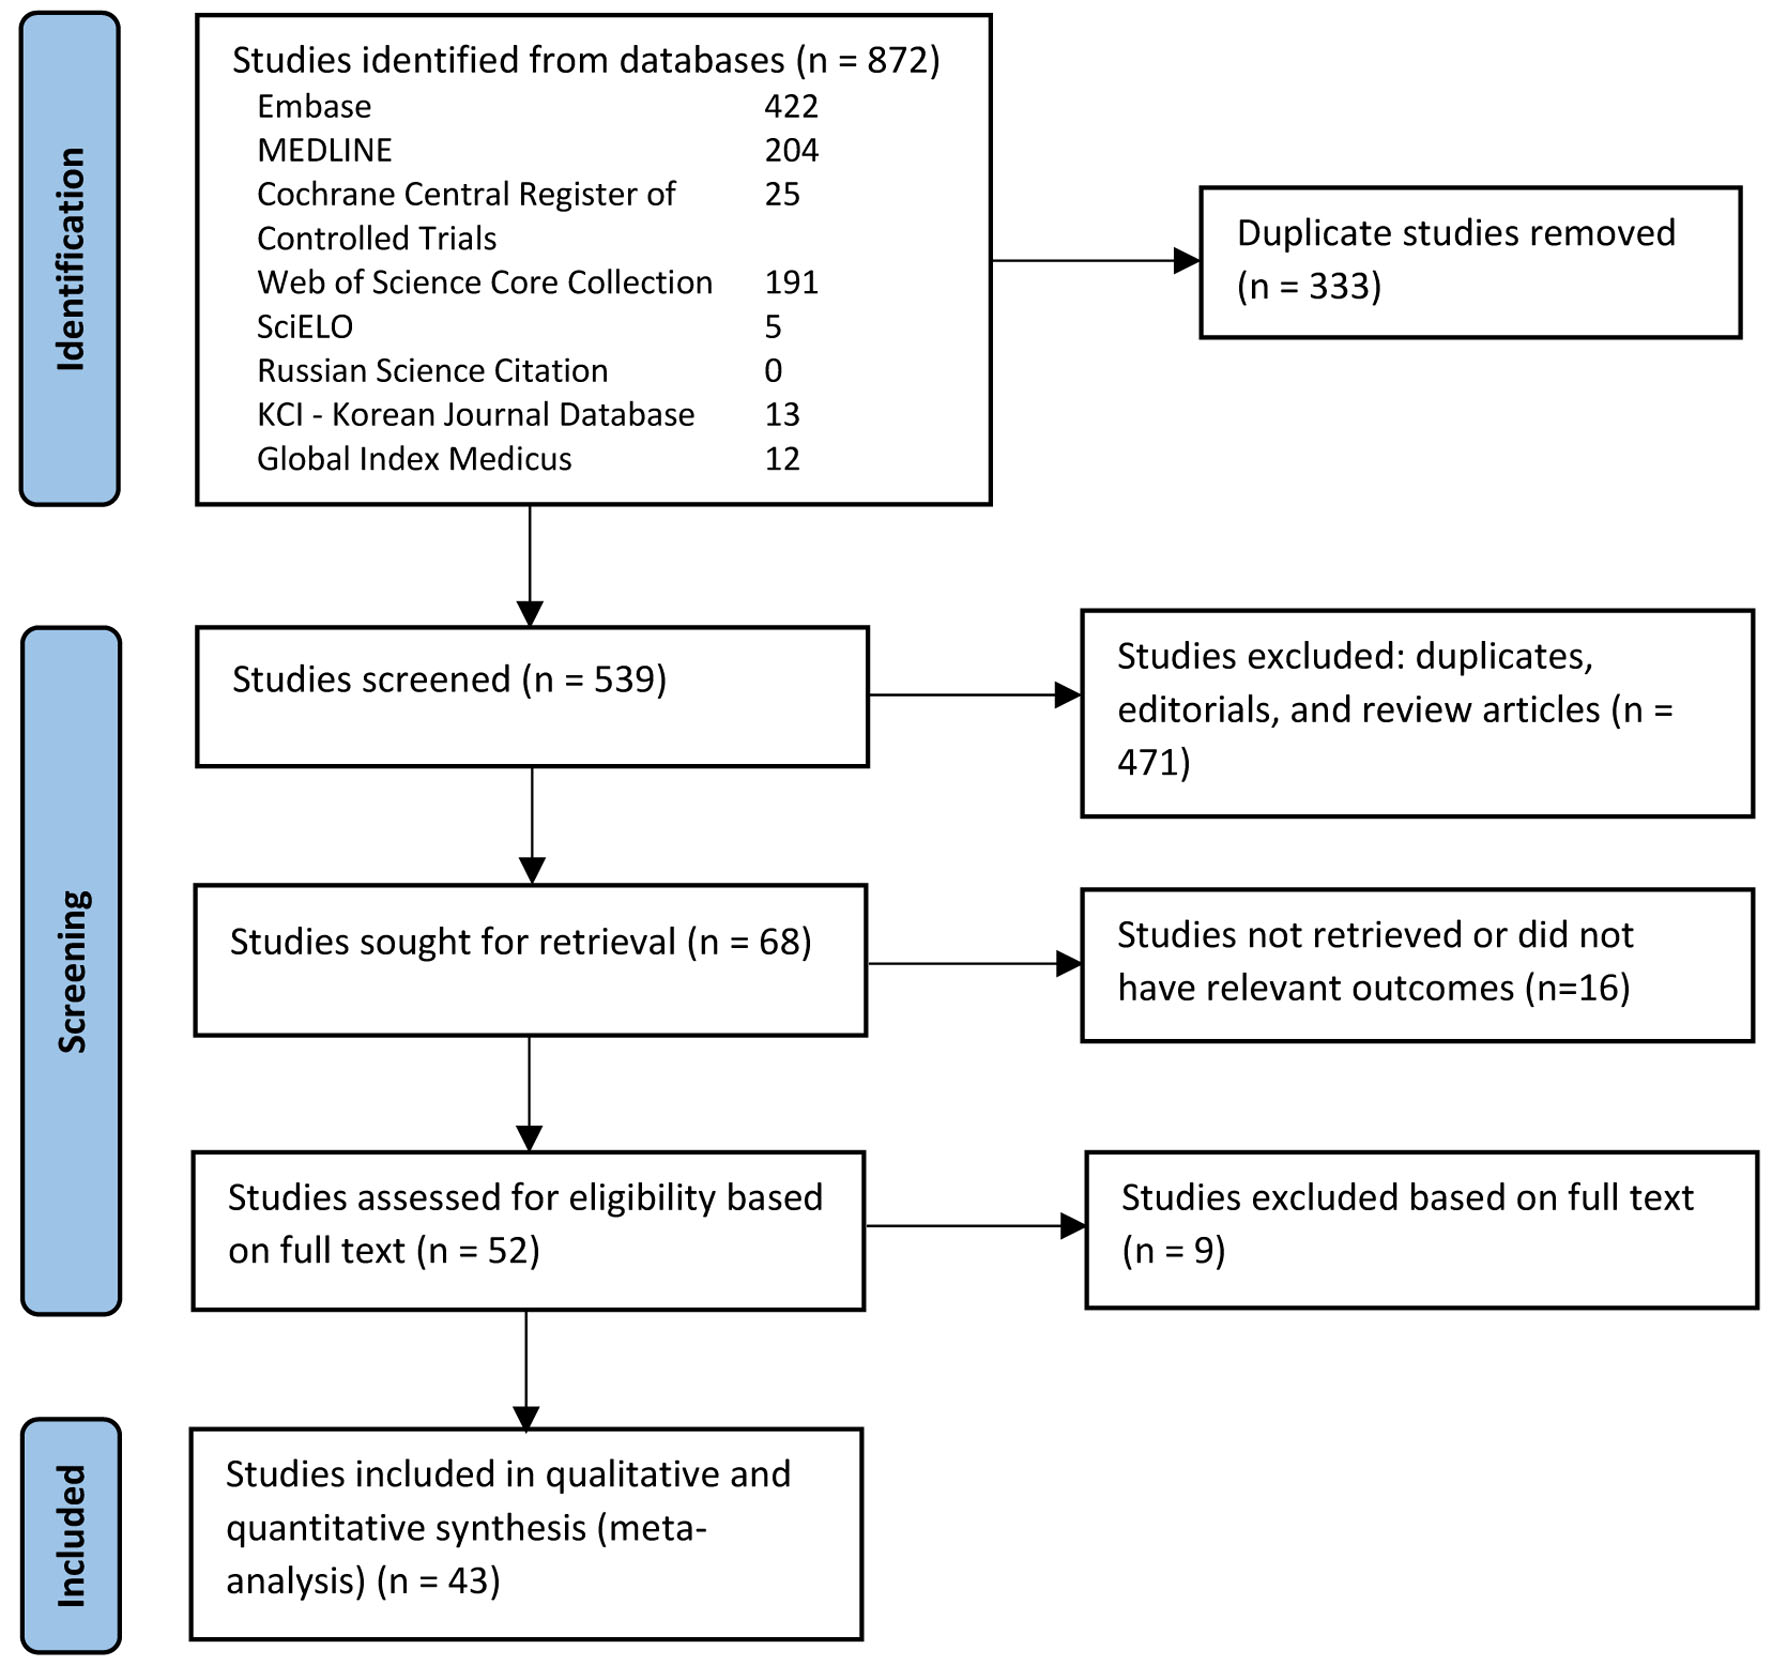
Figure 1. PRISMA flow diagram of the literature review process.
| Gastroenterology Research, ISSN 1918-2805 print, 1918-2813 online, Open Access |
| Article copyright, the authors; Journal compilation copyright, Gastroenterol Res and Elmer Press Inc |
| Journal website https://www.gastrores.org |
Original Article
Volume 16, Number 2, April 2023, pages 79-91
Outcomes and Complications of Radiological Gastrostomy vs. Percutaneous Endoscopic Gastrostomy for Enteral Feeding: An Updated Systematic Review and Meta-Analysis
Figures
Tables
| Study | Year | Demographics | Study design | Total | PRG | PEG | Indications |
|---|---|---|---|---|---|---|---|
| ALS: amyotrophic lateral sclerosis; CVA: cerebrovascular accident; HNC: head and neck cancers; NR: not reported; NMDs: neuromuscular disorders; PEG: percutaneous endoscopic gastrostomy; PRG: percutaneous radiological gastrostomy; SD: standard deviation. | |||||||
| Allen et al [16] | 2013 | Mean age in PRG = 61 (SD ± 10.4); Mean age in PEG = 62 (SD ± 11.3); Male in PRG = 30 (57%); Male in PEG = 35 (61%) | Retrospective | 108 | 51 | 57 | ALS |
| Alvarez-Alvarez et al [17] | 2022 | Mean age overall: 66; Male overall: 41% | Retrospective | 25 | 4 | 21 | ALS |
| Bazarah et al [18] | 2002 | Mean age in PRG = 51; Mean age in PEG = 65; Male in PRG = 16 (48%); Male in PEG = 14 (73%) | Retrospective | 52 | 33 | 19 | Neurological disorders (60%); HNC (21.2%); other |
| Blondet et al [19] | 2010 | Mean age in PRG = 66 (SD ± 12); Mean age in PEG = 66 (SD ± 11.2); Male in PRG = 11 (50%); Male in PEG = 6 (33%) | Retrospective | 43 | 22 | 21 | ALS |
| Carey et al [20] | 2004 | NR | Retrospective | 182 | 96 | 86 | NR |
| Chandran et al [21] | 2017 | Median age in PRG = 64; Median age in PEG = 65; Male in PRG = 34 (65.4%); Male in PEG = 54 (63.5%) | Retrospective | 137 | 52 | 85 | HNC (37.2%); CVA (27.7%); NMDs (6.6%); trauma (6.6%); esophageal cancer (5.8%); other (16.1%) |
| Cherian et al [22] | 2019 | Median age in PRG = 65 (35 - 89); Median age in PEG = 62 (18 - 91); Male in PRG = 65 (68%); Male in PEG = 242 (61%) | Retrospective | 403 | 95 | 308 | HNC (62.9%); non-HNC malignancy (11%); other (26.1%) |
| Chio et al [23] | 2004 | Mean age in PRG = 69 (SD ± 9.5); Mean age in PEG = 65 (SD ± 10.3); Male in PRG = 12 (48%); Male in PEG = 13 (52%) | Retrospective | 25 | 25 | 50 | ALS |
| Clayton et al [24] | 2019 | Mean age in PRG = 62 (SD ± 16.4); Mean age in PEG = 66 (SD ± 17.3); Male in PRG = 82 (54%); Male in PEG = 90 (61%) | Retrospective | 297 | 150 | 147 | Gastrointestinal disorders (59.9%); neurological disorders (19.5%); other (17.8%) |
| Cosentini et al [25] | 1998 | Median age in PRG = 57 (20 - 84); Median age in PEG = 55 (10 - 90); Male in PRG = 28 (63%); Male in PEG = 16 (66%) | Retrospective | 68 | 44 | 24 | HNC (66%); neurological disorders (19%); esophageal perforation (4%); cachexia (4%); esophageal cancer (3%); gastric cancer/decompression (3%) |
| Desport et al [26] | 2005 | Mean age in PRG = 66 (SD ± 9.7); Mean age in PEG = 65 (SD ± 10.3); Male in PRG = 5 (25%); Male in PEG = 21 (70%) | Retrospective | 50 | 20 | 30 | ALS |
| El Chaarani et al [27] | 2014 | Mean age in PRG = 69; Mean age in PEG = 72; Male in PRG = 111 (60%); Male in PEG = 87 (42%) | Retrospective | 394 | 186 | 208 | NR |
| Elliot et al [28] | 1996 | NR | Prospective (non-randomized controlled trial (non-RCT)) | 78 | 45 | 33 | CVA (42%); cystic fibrosis (22%); malignancy (8%); chest disease (4%); other (24%) |
| Galaski et al [29] | 2009 | Mean age in PRG = 65 (SD ± 19); Mean age in PEG = 55 (SD ± 21); Male in PRG = 31 (71%); Male in PEG = 19 (63%) | Retrospective | 74 | 44 | 30 | Neurological disorders (31.1%); trauma (17.6%); HNC (10.8%); coronary artery disease (10.8%); other |
| Grant et al [30] | 2009 | Mean age in PRG = 65 (36 - 95); Mean age in PEG = 61 (28 - 97); Male in PRG = 39 (77%); Male in PEG = 79 (65%) | Prospective (non-RCT) | 172 | 51 | 121 | HNC |
| Hazratjee et al [31] | 2012 | NR | Retrospective | 267 | 70 | 197 | NR |
| Hoffer et al [32] | 1999 | Mean age in PRG = 58 (18 - 93); Mean age in PEG = 52 (18 - 89); Male in PRG = 36 (55%); Male in PEG = 41 (59%) | Prospective (RCT) | 135 | 66 | 69 | Neurological impairment (80.7%); HNC (11.9%); gastrointestinal decompression (3%); other (4.4%) |
| Kim et al [33] | 2014 | Mean age overall = 60 (SD ± 17.5); Male overall = 102 (74%) | Retrospective | 138 | 48 | 90 | Unable to eat (67.4%); recurrent aspiration (18.1%); esophageal stricture (10.1%) |
| Kohli et al [34] | 2021 | Mean age in PRG = 70 (SD ± 9.7); Mean age in PEG = 71 (SD ± 10.2); Male in PRG = 9,432 (97.1%); Male in PEG = 22,989 (97.6%) | Retrospective (Nationwide Veterans Affairs Database) | 33,281 | 9,715 | 23,566 | Dysphagia/aphagia (86%); malignancy (65%); other non-malignant disorders including neurological diseases and aspiration pneumonia |
| Kohli et al [35] | 2021 | Mean age in PRG = 67 (SD ± 17.5); Mean age in PEG = 54 (SD ± 29); Male in PRG = 86,262 (56%); Male in PEG = 8,855 (54%) | Retrospective (Nationwide Readmissions Database) | 170,391 | 154,007 | 16,384 | Dysphagia/aphagia (48%); malignancy including HNC; non-malignant disorders including neurological diseases, aspiration pneumonia, and sepsis |
| Kohli et al [36] | 2022 | Mean age in PRG = 68.6 (SD ± 8.23); Mean age in PEG = 68.3 (SD ± 7.13); Male in PRG = 100%; Male in PEG = 100% | Prospective (non-RCT) | 92 | 45 | 47 | HNC; esophageal cancer; other cancer; critical illness/ALS |
| La Nauze et al [37] | 2012 | Median age in PRG = 61 (16 - 92); Median age in PEG = 61 (16 - 94); Male in PRG = 69 (71%); Male in PEG = 53 (66%) | Retrospective | 177 | 97 | 80 | HNC (27%); trauma (25%); stroke (23%); neuromuscular diseases/dementia (10%); other |
| Laasch et al [38] | 2003 | Mean age in PRG = 68 (27 - 86); Mean age in PEG = 73 (19 - 96); Sex = NR | Retrospective | 100 | 50 | 50 | Neurological disorders; malignancy; nutritional support; other |
| Laskaratos et al [39] | 2012 | Mean age in PRG = 76.2 (48 - 93); Mean age in PEG = 69.4 (21 - 93); Male in PRG = 20 (50%); Male in PEG = 24 (45%) | Retrospective | 93 | 40 | 53 | CVA (31.2%); NMDs (30%); HNC (18.3%); other (22.6%) |
| Leeds et al [40] | 2010 | Mean age in PRG = 63; Mean age in PEG = 62; Male in PRG = 119 (70%); Male in PEG = 146 (64%) | Retrospective | 403 | 170 | 233 | HNC (43%); neurological diseases (29%); dysphagic stroke (9%); other |
| Maasarani et al [41] | 2020 | Age = NR; Male in PRG = 14,416 (54.4%); Male in PEG = 110,933 (47.8%) | Retrospective | 258,641 | 26,477 | 232,164 | NR |
| MacLean et al [42] | 2007 | Mean age in PRG = 57 (SD ± 19); Mean age in PEG = 51 (SD ± 21); Male in PRG = 113 (42%); Male in PEG = 74 (67%) | Retrospective | 378 | 110 | 268 | Gastrointestinal surgery (21%); trauma and burns (12%); head and neck surgery (9%); gastrointestinal obstruction (7%); other |
| McAllister et al [43] | 2013 | NR | Retrospective | 110 | 89 | 21 | HNC |
| McDermott et al [44] | 2015 | Mean age in PRG = 63.6 (SD ± 9.8); Mean age in PEG = 64.2 (SD ± 11.7); Male in PRG = 62 (51%); Male in PEG = 90 (55%) | Retrospective | 284 | 121 | 163 | ALS |
| Moller et al [45] | 1999 | Median age in PRG = 64 (20 - 92); Median age in PEG = 48 (29 - 73); Male in PRG = 49 (52%); Male in PEG = 6 (50%) | Retrospective | 106 | 94 | 12 | Neurological disorders (42%); malignancy (38%); other (20%) |
| Neeff et al [46] | 2003 | Mean age in PRG = 66 (SD ± 12); Mean age in PEG = 65 (SD ± 10.5); Male in PRG = 13 (72%); Male in PEG = 43 (77%) | Retrospective | 74 | 18 | 56 | HNC |
| Pannick et al [47] | 2019 | Median age overall = 64; Sex = NR | Retrospective | 155 | 132 | 33 | Dysphagia (45.2%); HNC (36.8%); stroke (12.3%) |
| Park et al [6] | 2019 | Mean age in PRG = 66 (SD ± 13.3); Mean age in PEG = 67 (SD ± 14.8); Male in PRG = 58 (62%); Male in PEG = 234 (72%) | Retrospective | 418 | 94 | 324 | Neurological diseases (70.8%); HNC (14.6%); esophageal cancer (6.5%); other |
| Pinar-Gutierrez et al [48] | 2021 | NR | Retrospective | 896 | 330 | 896 | NR |
| Abd Rahim et al [49] | 2014 | NR | Retrospective | 244 | 168 | 76 | Intracranial events; HNC; dysphagia |
| Righetti et al [50] | 2020 | Mean age in PRG = 64.1 (SD ± 12.6); Mean age in PEG = 63.0 (SD ± 15.0); Male in PRG = 340 (65.5%); Male in PEG = 134 (49.6%) | Retrospective | 789 | 519 | 270 | Neurological indications (29%); cancer (36%); chronic aspiration (4.4%); malnutrition (22%); gastric outlet obstruction (8.4%); other (5.7%) |
| Rio et al [51] | 2010 | Mean age overall = 62 (SD ± 12); Sex = NR | Retrospective | 142 | 121 | 21 | Motor neuron disease |
| Rustom et al [52] | 2006 | Mean age in PRG = 64.8; Mean age in PEG = 63.6; Male in PRG = 15 (53.6%); Male in PEG = 24 (60%) | Retrospective | 68 | 28 | 40 | HNC |
| Silas et al [53] | 2005 | Mean age in PRG = 63 (SD ± 14); Mean age in PEG = 68 (SD ± 15); Male in PRG = 114 (59.1%); Male in PEG = 100 (56.5%) | Retrospective | 370 | 193 | 177 | Nutrition/dysphagia (93%); decompression (7%); neurological disorders (34%); malignancy (47%) |
| Strijbos et al [54] | 2019 | Mean age in PRG = 62 (SD ± 15); Mean age in PEG = 63 (SD ± 11); Male in PRG = 305 (65%); Male in PEG = 173 (60%) | Retrospective | 760 | 469 | 291 | HNC (58%); ALS (7%); CVA (7%); Neurological disorders (7%); other including gastrointestinal and muscular diseases |
| Tan et al [55] | 2019 | Mean age overall = 66 (21 - 102); Male overall = 134 (54%) | Retrospective | 248 | 90 | 158 | Altered mental status (37%); cognitive impairment (16%); malignancy (15%); dysphagia (14%); other (18%) |
| Vashi et al [56] | 2015 | Mean age in PRG = 56 (SD ± 9.1); Mean age in PEG = 54 (SD ± 10.7); Male in PRG = 30 (57.7%); Male in PEG = 45 (55.6%) | Retrospective | 133 | 52 | 81 | Malignancy causing dysphagia, malnutrition, or need for decompression |
| Wollman et al [57] | 1997 | Mean age in PRG = 54 (15 - 89); Mean age in PEG = 55 (12 - 94); Male in PRG = 38 (56%); Male in PEG = 71 (62%) | Retrospective | 182 | 68 | 114 | Neurological impairment (59.9%); HNC (20.9%); decompression (6.6%); other (12.6%) |
| Studies | Clearly stated aim | Consecutive patient inclusion | Prospective data collection | Appropriate end-points | Unbiased study end-point assessment | Appropriate follow-up period | Attrition bias (< 5%) | Sample size | Adequate control group | Contemporary groups | Baseline equivalence of groups | Statistical analysis | Total score |
|---|---|---|---|---|---|---|---|---|---|---|---|---|---|
| Allen et al [16] | 2 | 2 | 2 | 2 | 0 | 2 | 2 | 0 | 2 | 2 | 2 | 2 | 20 |
| Alvarez-Alvarez et al [17] | 2 | 2 | 2 | 2 | 0 | 2 | 2 | 0 | 2 | 2 | 1 | 1 | 18 |
| Bazarah et al [18] | 2 | 2 | 2 | 2 | 0 | 2 | 2 | 0 | 2 | 2 | 2 | 2 | 20 |
| Blondet et al [19] | 2 | 2 | 2 | 2 | 0 | 2 | 2 | 0 | 2 | 2 | 2 | 2 | 20 |
| Carey et al [20] | 2 | 2 | 2 | 2 | 0 | 2 | 2 | 0 | 2 | 2 | 1 | 1 | 18 |
| Chandran et al [21] | 2 | 2 | 2 | 2 | 0 | 2 | 2 | 0 | 2 | 2 | 1 | 2 | 19 |
| Cherian et al [22] | 2 | 2 | 2 | 2 | 0 | 2 | 2 | 0 | 2 | 2 | 1 | 2 | 19 |
| Chio et al [23] | 2 | 2 | 2 | 2 | 0 | 2 | 2 | 0 | 2 | 2 | 2 | 2 | 20 |
| Clayton et al [24] | 2 | 2 | 2 | 2 | 0 | 2 | 2 | 0 | 2 | 2 | 1 | 2 | 19 |
| Cosentini et al [25] | 2 | 2 | 2 | 2 | 0 | 2 | 2 | 0 | 2 | 2 | 0 | 2 | 18 |
| Desport et al [26] | 2 | 2 | 2 | 2 | 0 | 2 | 2 | 0 | 2 | 2 | 2 | 2 | 20 |
| El Chaarani et al [27] | 2 | 2 | 2 | 2 | 0 | 0 | 2 | 0 | 2 | 2 | 1 | 2 | 17 |
| Elliot et al [28] | 2 | 2 | 2 | 2 | 0 | 2 | 2 | 0 | 2 | 2 | 0 | 2 | 18 |
| Galaski et al [29] | 2 | 2 | 2 | 2 | 0 | 2 | 2 | 0 | 2 | 2 | 1 | 2 | 19 |
| Grant et al [30] | 2 | 2 | 2 | 2 | 0 | 2 | 2 | 0 | 2 | 2 | 1 | 2 | 19 |
| Hazratjee et al [31] | 2 | 2 | 2 | 2 | 0 | 2 | 2 | 0 | 2 | 2 | 1 | 2 | 19 |
| Kim et al [32] | 2 | 2 | 2 | 2 | 0 | 2 | 2 | 0 | 2 | 2 | 0 | 1 | 17 |
| Kohli et al [33] | 2 | 2 | 2 | 2 | 0 | 0 | 2 | 0 | 2 | 2 | 0 | 2 | 18 |
| Kohli et al (divyanshu) [34] | 2 | 2 | 2 | 2 | 0 | 2 | 2 | 0 | 2 | 2 | 0 | 2 | 18 |
| Kohli et al [35] | 2 | 2 | 2 | 2 | 0 | 2 | 2 | 0 | 2 | 2 | 2 | 2 | 20 |
| La Nauze et al [36] | 2 | 2 | 2 | 2 | 0 | 2 | 2 | 0 | 2 | 2 | 2 | 2 | 20 |
| Laasch et al [37] | 2 | 2 | 2 | 2 | 0 | 1 | 2 | 0 | 2 | 2 | 1 | 2 | 18 |
| Laskaratos et al [38] | 2 | 2 | 2 | 2 | 0 | 2 | 2 | 0 | 2 | 2 | 1 | 2 | 19 |
| Leeds et al [39] | 2 | 2 | 2 | 2 | 0 | 2 | 2 | 0 | 2 | 2 | 1 | 2 | 19 |
| Maasarani et al [40] | 2 | 2 | 2 | 2 | 0 | 2 | 2 | 0 | 2 | 2 | 2 | 2 | 20 |
| MacLean et al [41] | 2 | 2 | 2 | 2 | 0 | 1 | 2 | 0 | 2 | 2 | 0 | 2 | 17 |
| McAllister et al [42] | 2 | 2 | 2 | 2 | 0 | 2 | 2 | 0 | 2 | 2 | 0 | 2 | 18 |
| McDermott et al [43] | 2 | 2 | 2 | 2 | 0 | 2 | 2 | 0 | 2 | 2 | 1 | 2 | 18 |
| Moller et al [44] | 2 | 2 | 2 | 2 | 0 | 2 | 2 | 0 | 2 | 2 | 1 | 1 | 18 |
| Neeff et al [45] | 2 | 2 | 2 | 2 | 0 | 2 | 2 | 0 | 2 | 2 | 0 | 1 | 17 |
| Pannick et al [46] | 2 | 2 | 2 | 2 | 0 | 2 | 2 | 0 | 2 | 2 | 0 | 2 | 18 |
| Park et al [6] | 2 | 2 | 2 | 2 | 0 | 2 | 2 | 0 | 2 | 2 | 2 | 2 | 20 |
| Pinar-Gutierrez et al [48] | 2 | 2 | 2 | 2 | 0 | 1 | 2 | 0 | 2 | 2 | 0 | 2 | 17 |
| Abd Rahim et al [49] | 2 | 2 | 2 | 2 | 0 | 2 | 2 | 0 | 2 | 2 | 0 | 0 | 12 |
| Righetti et al [50] | 2 | 2 | 2 | 2 | 0 | 0 | 2 | 0 | 2 | 2 | 1 | 2 | 17 |
| Rio et al [51] | 2 | 2 | 2 | 2 | 0 | 2 | 2 | 0 | 2 | 2 | 2 | 2 | 20 |
| Rustom et al [52] | 2 | 2 | 2 | 2 | 0 | 2 | 2 | 0 | 2 | 2 | 0 | 0 | 16 |
| Silas et al [53] | 2 | 2 | 2 | 2 | 0 | 2 | 2 | 0 | 2 | 2 | 1 | 2 | 19 |
| Strijbos et al [54] | 2 | 2 | 2 | 2 | 0 | 2 | 2 | 0 | 2 | 2 | 1 | 2 | 19 |
| Tan et al [55] | 2 | 2 | 2 | 2 | 0 | 2 | 2 | 0 | 2 | 2 | 0 | 2 | 18 |
| Vashi et al [56] | 2 | 2 | 2 | 2 | 0 | 2 | 2 | 0 | 2 | 2 | 1 | 2 | 19 |
| Wollman et al [57] | 2 | 2 | 2 | 2 | 0 | 2 | 2 | 0 | 2 | 2 | 1 | 2 | 19 |
| Study | Random sequence generation (selection bias) | Allocation concealment (selection bias) | Blinding of participants and personal (performance bias) | Blinding of outcome assessment (detection bias) | Incomplete outcome data (attrition bias) | Selective reporting (reporting bias) | Other bias |
|---|---|---|---|---|---|---|---|
| RCTs: randomized controlled trials. | |||||||
| Hoffer et al [32] | Low | Low | Low | Low | Low | Low | Low |