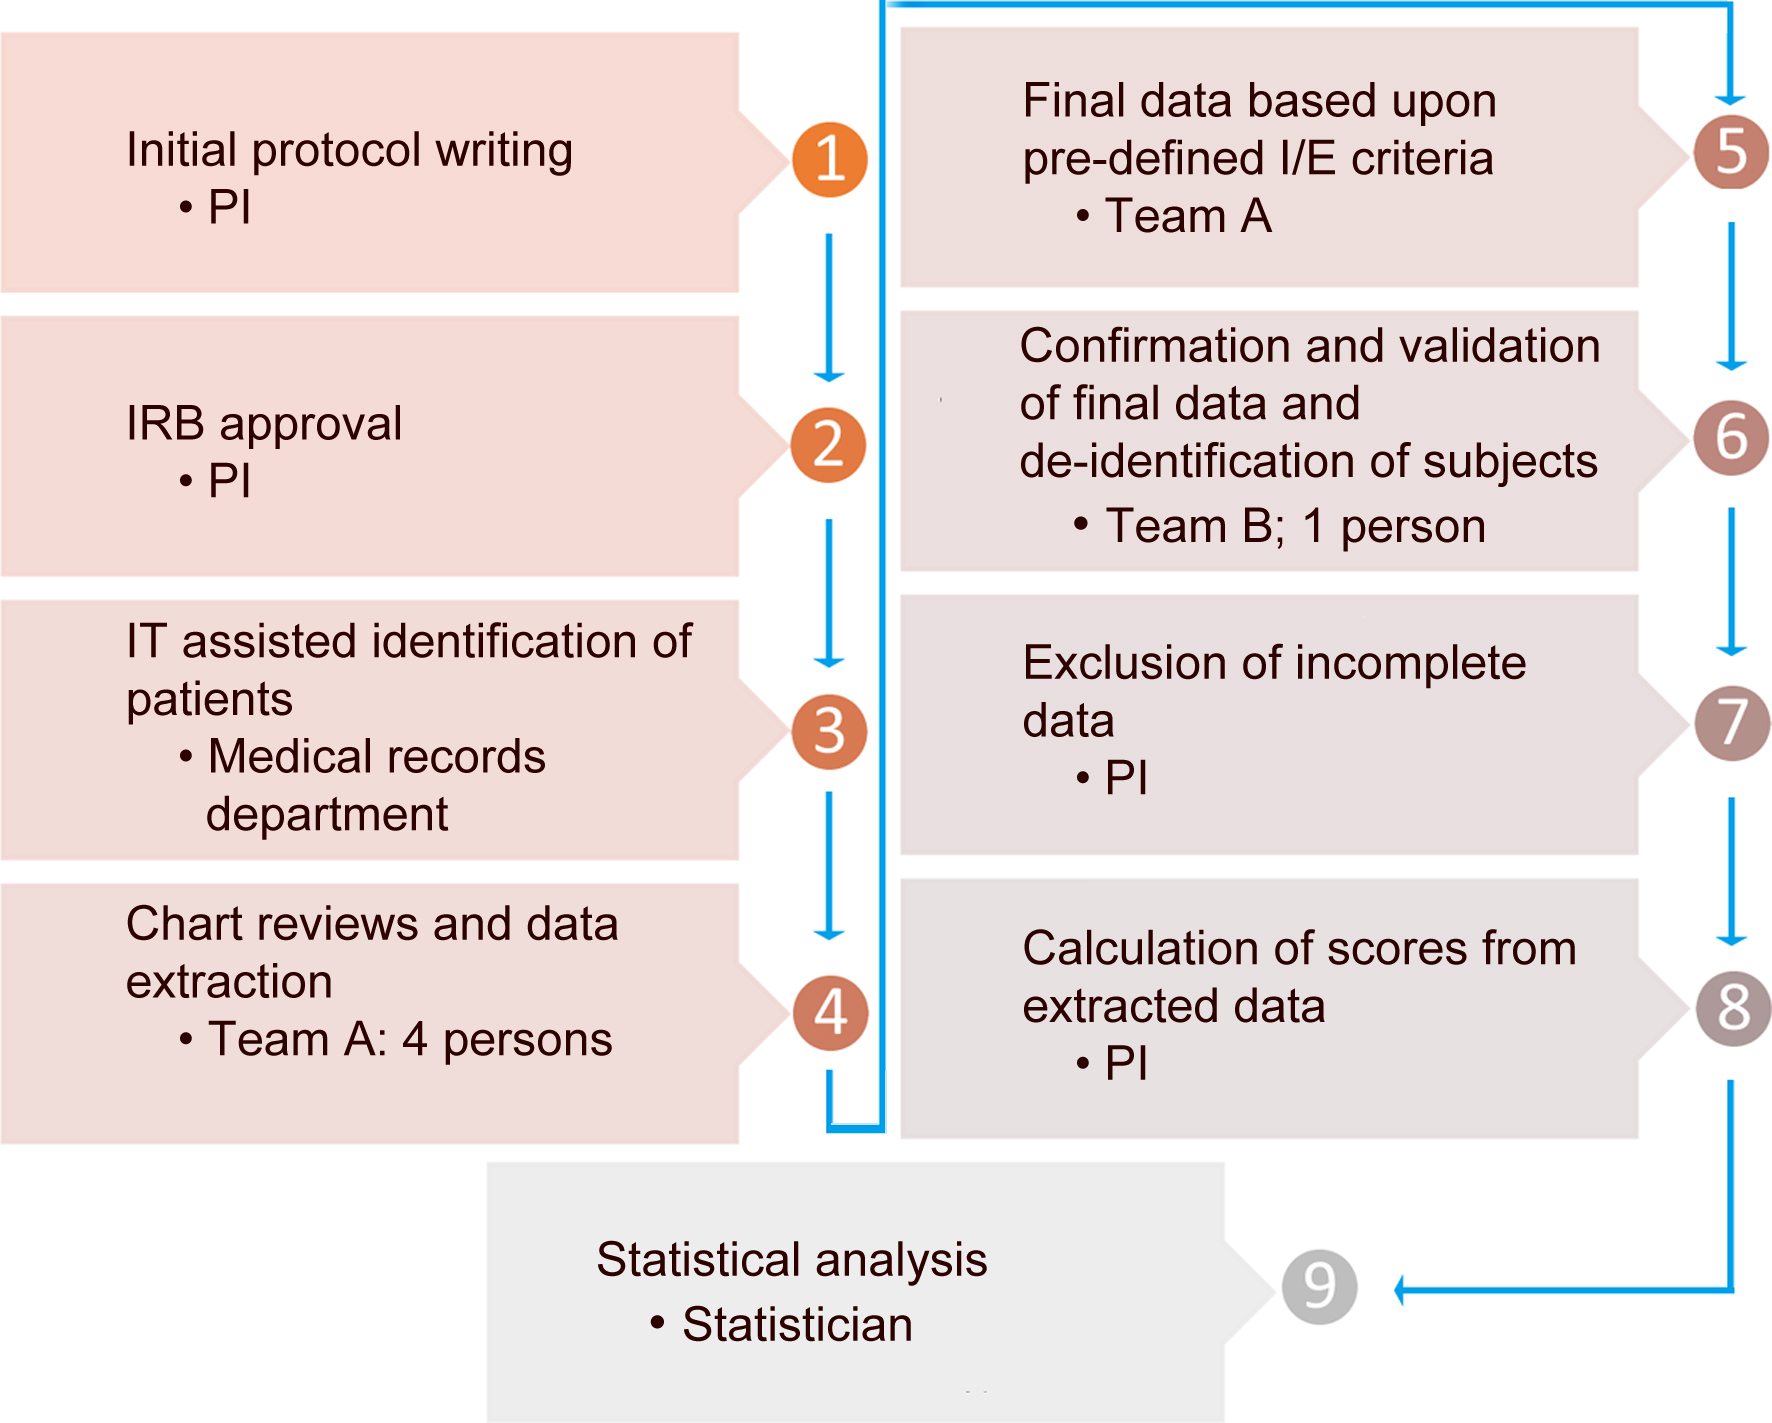
Figure 1. Data collection and analysis process.
| Gastroenterology Research, ISSN 1918-2805 print, 1918-2813 online, Open Access |
| Article copyright, the authors; Journal compilation copyright, Gastroenterol Res and Elmer Press Inc |
| Journal website https://www.gastrores.org |
Original Article
Volume 16, Number 1, February 2023, pages 25-36
The Impact of Metabolic Syndrome on the Prognosis of High-Risk Alcoholic Hepatitis Patients: Redefining Alcoholic Hepatitis
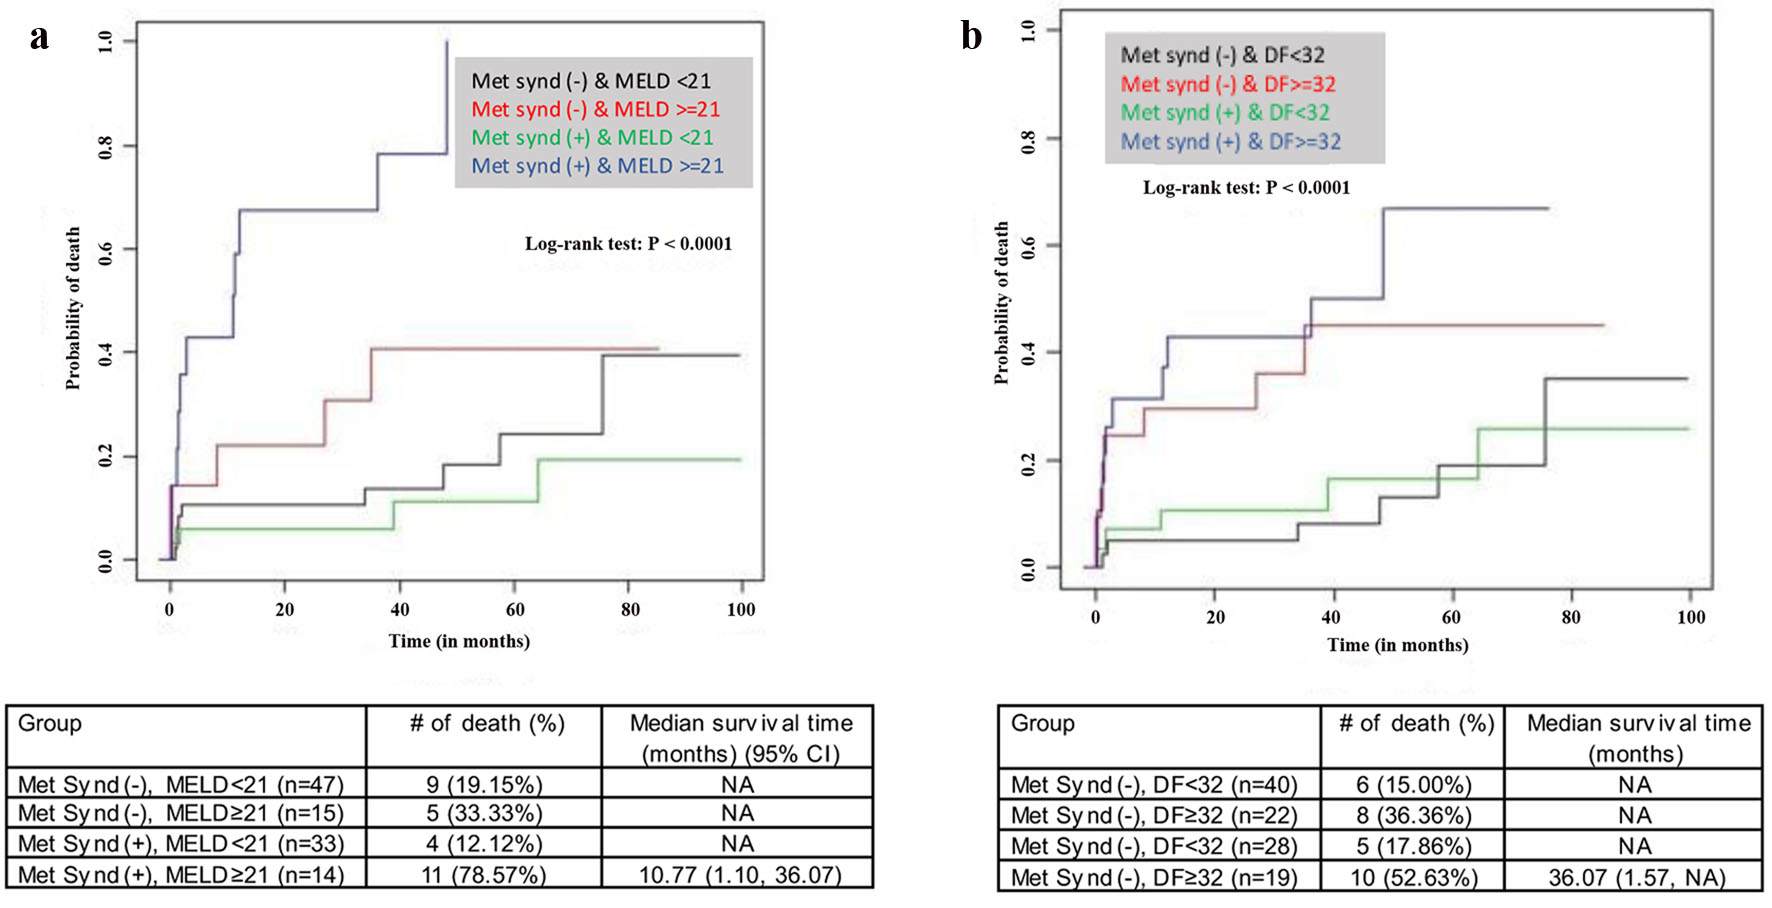
Figures
Tables
| Variable | Overall (N = 109) | Alcohol hepatitis (N = 62) | Alcohol hepatitis with metabolic syndrome (N = 47) | P-value* |
|---|---|---|---|---|
| Data are presented as mean ± SD or n (%). *Derived from Wilcoxon rank-sum test for continuous variables and Fisher’s exact test for categorical variables. BMI: body mass index; WBC: white blood cell; Hb: hemoglobin; Hct: hematocrit; MCV: mean corpuscular volume; INR: international normalized ratio; PT: prothrombin time; AST: aspartate aminotransferase; ALT: alanine aminotransferase; AP: alkaline phosphatase; T. bili: total bilirubin; Fib-4: fibrosis-4; APRI: aspartate aminotransferase to platelet ratio index; CTP: Child-Turcotte-Pugh; MELD: model for end-stage liver disease; DF: discriminant function; ANI: alcoholic liver disease/non-alcoholic fatty liver disease index. | ||||
| Age | 47.49 ± 12.72 | 47.50 ± 11.90 | 47.47 ± 13.87 | 0.67 |
| Female | 43.00 (39.45%) | 29.00 (46.77%) | 14.00 (29.79%) | 0.08 |
| Race | 0.38 | |||
| Caucasian | 72.00 (66.06%) | 43.00 (69.35%) | 29.00 (61.70%) | |
| Hispanic | 24.00 (22.02%) | 14.00 (22.58%) | 10.00 (21.28%) | |
| Others | 13.00 (11.93%) | 5.00 (8.06%) | 8.00 (17.02%) | |
| Diabetic | 12.00 (11.11%) | 0.00 (0.00%) | 12.00 (25.53%) | < 0.001 |
| BMI | 26.85 ± 7.12 | 23.57 ± 3.64 | 30.97 ± 8.24 | < 0.001 |
| WBC | 10.66 ± 5.97 | 10.57 ± 6.09 | 10.79 ± 5.86 | 0.67 |
| Hb | 12.04 ± 2.85 | 11.36 ± 2.40 | 12.94 ± 3.16 | < 0.01 |
| Hct | 34.96 ± 8.59 | 32.84 ± 7.78 | 37.77 ± 8.87 | < 0.01 |
| MCV | 97.20 ± 8.58 | 96.33 ± 9.16 | 98.34 ± 7.67 | 0.37 |
| Platelets | 185.06 ± 118.04 | 188.48 ± 130.47 | 180.53 ± 100.51 | 0.75 |
| Creatinine | 1.35 ± 1.38 | 1.17 ± 0.96 | 1.59 ± 1.77 | 0.06 |
| INR | 2.62 ± 4.63 | 2.26 ± 4.04 | 3.10 ± 5.32 | 0.76 |
| PT | 27.28 ± 33.98 | 23.87 ± 29.92 | 31.70 ± 38.52 | 0.32 |
| AST | 243.66 ± 552.55 | 194.19 ± 243.90 | 308.91 ± 793.91 | 0.46 |
| ALT | 141.52 ± 357.81 | 105.98 ± 133.78 | 188.40 ± 522.40 | 0.46 |
| AP | 158.62 ± 117.41 | 165.90 ± 128.99 | 148.63 ± 99.98 | 0.69 |
| Albumin | 2.91 ± 0.89 | 3.02 ± 0.92 | 2.76 ± 0.85 | 0.14 |
| < 3.5 | 64.00 (58.72%) | 34.00 (54.84%) | 30.00 (63.83%) | 0.43 |
| T. bili | 6.23 ± 8.52 | 6.57 ± 8.99 | 5.78 ± 7.93 | 0.88 |
| Na | 134.02 ± 6.87 | 133.42 ± 6.87 | 134.81 ± 6.88 | 0.58 |
| Lactate | 3.48 ± 3.25 | 3.05 ± 3.11 | 4.20 ± 4.04 | 0.45 |
| AST/ALT ratio | 2.25 ± 1.45 | 2.45 ± 1.59 | 2.00 ± 1.20 | 0.19 |
| AST/AP ratio | 1.86 ± 3.42 | 1.60 ± 2.66 | 2.23 ± 4.26 | 0.73 |
| ALT/AP ratio | 1.05 ± 2.64 | 0.86 ± 1.37 | 1.31 ± 3.76 | 0.47 |
| ALT/AP index | 2.76 ± 6.94 | 2.25 ± 3.59 | 3.45 ± 9.86 | 0.47 |
| AST/AP index | 4.88 ± 8.98 | 4.19 ± 6.99 | 5.84 ± 11.17 | 0.73 |
| NR-ALT/AP index | 5.80 ± 14.62 | 4.75 ± 7.55 | 7.25 ± 20.77 | 0.47 |
| NR-AST/AP index | 10.28 ± 18.91 | 8.82 ± 14.72 | 12.30 ± 23.52 | 0.73 |
| Fib-4 | 7.88 ± 12.93 | 7.70 ± 9.05 | 8.12 ± 16.85 | 0.46 |
| APRI | 5.47 ± 18.39 | 4.37 ± 8.16 | 6.91 ± 26.49 | 0.67 |
| HAI | 36.00 (33.03%) | 16.00 (25.81%) | 20.00 (42.55%) | 0.10 |
| Antimicrobial | 54.00 (49.54%) | 28.00 (45.16%) | 26.00 (55.32%) | 0.34 |
| CTP | 8.32 ± 2.65 | 8.29 ± 2.83 | 8.35 ± 2.46 | 0.80 |
| MELD | 16.48 ± 14.23 | 14.90 ± 13.83 | 18.56 ± 14.64 | 0.14 |
| ≥ 21 | 29.00 (26.61%) | 15.00 (24.19%) | 14.00 (29.79%) | 0.52 |
| ≥ 18 | 37.00 (33.94%) | 19.00 (30.65%) | 18.00 (38.30%) | 0.42 |
| DF | 75.34 ± 157.87 | 59.39 ± 140.28 | 96.39 ± 177.83 | 0.22 |
| ≥ 32 | 41.00 (37.61%) | 22.00 (35.48%) | 19.00 (40.43%) | 0.69 |
| ANI | 1.63 ± 9.16 | 3.34 ± 9.44 | -0.62 ± 8.34 | 0.02 |
| ≥ 2.2 | 73.00 (66.97%) | 43.00 (69.35%) | 30.00 (63.83%) | 0.68 |
| Variable | Unadjusteda | Adjustedb | ||
|---|---|---|---|---|
| OR (95% CI)a | P value | OR (95% CI) | P value | |
| aDerived from logistic regression. bStepwise selection with an entry P-value of 0.05 and a removal P-value of 0.05 was performed to select variables, in which lactate was excluded due to an extremely high missing rate > 90%. BMI: body mass index; WBC: white blood cell; Hb: hemoglobin; Hct: hematocrit; MCV: mean corpuscular volume; Cr: creatinine; INR: international normalized ratio; PT: prothrombin time; AST: aspartate aminotransferase; ALT: alanine aminotransferase; AP: alkaline phosphatase; AAPI1: ALT/AP index; AAPI2: AST/AP index; Fib-4: fibrosis-4; APRI: aspartate aminotransferase to platelet ratio index; CTP: Child-Turcotte-Pugh; DF: discriminant function; ANI: alcoholic liver disease/non-alcoholic fatty liver disease index; OR: odds ratio; CI: confidence interval. | ||||
| Age | 1.00 (0.97 - 1.03) | 0.99 | ||
| Female | 0.48 (0.22 - 1.07) | 0.07 | ||
| Race (vs. Caucasian) | 0.37 | |||
| Hispanic | 1.06 (0.41 - 2.71) | 0.90 | ||
| Others | 2.37 (0.71 - 7.98) | 0.16 | ||
| BMI (n = 106) | 1.26 (1.14 - 1.39) | < 0.0001 | 1.34 (1.17 - 1.54) | < 0.0001 |
| WBC | 1.01 (0.94 - 1.07) | 0.85 | ||
| Hb | 1.23 (1.06 - 1.43) | < 0.01 | ||
| Hct | 1.08 (1.02 - 1.14) | < 0.01 | ||
| MCV | 1.03 (0.98 - 1.08) | 0.23 | ||
| Platelets | 0.999 (0.996 - 1.003) | 0.73 | ||
| Cr | 1.28 (0.92 - 1.77) | 0.14 | ||
| INR | 1.04 (0.96 - 1.13) | 0.36 | ||
| PT (n = 107) | 1.01 (0.995 - 1.019) | 0.25 | ||
| AST | 1.000 (1.000 - 1.001) | 0.33 | ||
| ALT | 1.001 (0.999 - 1.003) | 0.32 | ||
| AP (n = 102) | 0.999 (0.995 - 1.002) | 0.46 | ||
| Albumin | 0.71 (0.46 - 1.10) | 0.12 | ||
| < 3.5 | 1.39 (0.62 - 3.13) | 0.43 | ||
| Total bilirubin | 0.99 (0.98 - 1.04) | 0.63 | ||
| Na | 1.03 (0.97 - 1.09) | 0.30 | ||
| Lactate (n = 8) | 1.13 (0.71 - 1.80) | 0.61 | ||
| AST/ALT ratio | 0.79 (0.59 - 1.06) | 0.11 | ||
| ALT/AP ratio (n = 102) | 1.07 (0.90 - 1.28) | 0.43 | ||
| AST/AP ratio (n = 102) | 1.06 (0.94 - 1.19) | 0.37 | ||
| AAPI1 (n = 102) | 1.03 (0.96 - 1.10) | 0.43 | ||
| AAPI2 (n = 102) | 1.02 (0.98 - 1.07) | 0.37 | ||
| NR ALT/AP (n = 102) | 1.01 (0.98 - 1.05) | 0.43 | ||
| NR AST/AP (n = 102) | 1.01 (0.99 - 1.03) | 0.37 | ||
| Fib-4 | 1.00 (0.97 - 1.03) | 0.86 | ||
| APRI | 1.01 (0.99 - 1.03) | 0.50 | ||
| CTP (n = 88) | 1.01 (0.86 - 1.18) | 0.92 | ||
| Infection | 2.13 (0.95 - 4.79) | 0.05 | ||
| Antibiotics use | 1.50 (0.70 - 3.22) | 0.29 | ||
| MELD | 1.02 (0.99 - 1.05) | 0.19 | ||
| ≥ 21 | 1.33 (0.57 - 3.12) | 0.51 | ||
| ≥ 18 | 1.41 (0.63 - 3.12) | 0.40 | ||
| DF | 1.002 (0.999 - 1.004) | 0.24 | ||
| ≥ 32 | 1.23 (0.57 - 2.69) | 0.60 | ||
| ANI | 0.95 (0.91 - 0.995) | 0.03 | ||
| ≥ 2.2 | 0.78 (0.35 - 1.74) | 0.54 | ||
| Variable | Unadjusted (n = 108) | Adjusteda (n = 105) | Adjustedb (n = 105) | |||
|---|---|---|---|---|---|---|
| HR (95% CI)a | P value | HR (95% CI) | P value | HR (95% CI) | P value | |
| Derived from Cox regression. Stepwise selection with an entry P-value of 0.05 and a removal P-value of 0.05 was performed to select variables, in which lactate was not included due to an extremely high missing rate > 90%. aAdjusted for age, BMI, WBC, albumin, Na, MELD, and IR. bAdjusted for age, BMI, WBC, albumin, Na, DF, and IR. Note: One patient had a survival time < 0 so this patient was excluded from survival analysis. BMI: body mass index; WBC: white blood cell; Hb: hemoglobin; Hct: hematocrit; MCV: mean corpuscular volume; Cr: creatinine; INR: international normalized ratio; PT: prothrombin time; AST: aspartate aminotransferase; ALT: alanine aminotransferase; AP: alkaline phosphatase; AAPI1: ALT/AP index; AAPI2: AST/AP index; Fib-4: fibrosis-4; APRI: aspartate aminotransferase to platelet ratio index; CTP: Child-Turcotte-Pugh; DF: discriminant function; ANI: alcoholic liver disease/non-alcoholic fatty liver disease index; HR: hazard ratio; CI: confidence interval. | ||||||
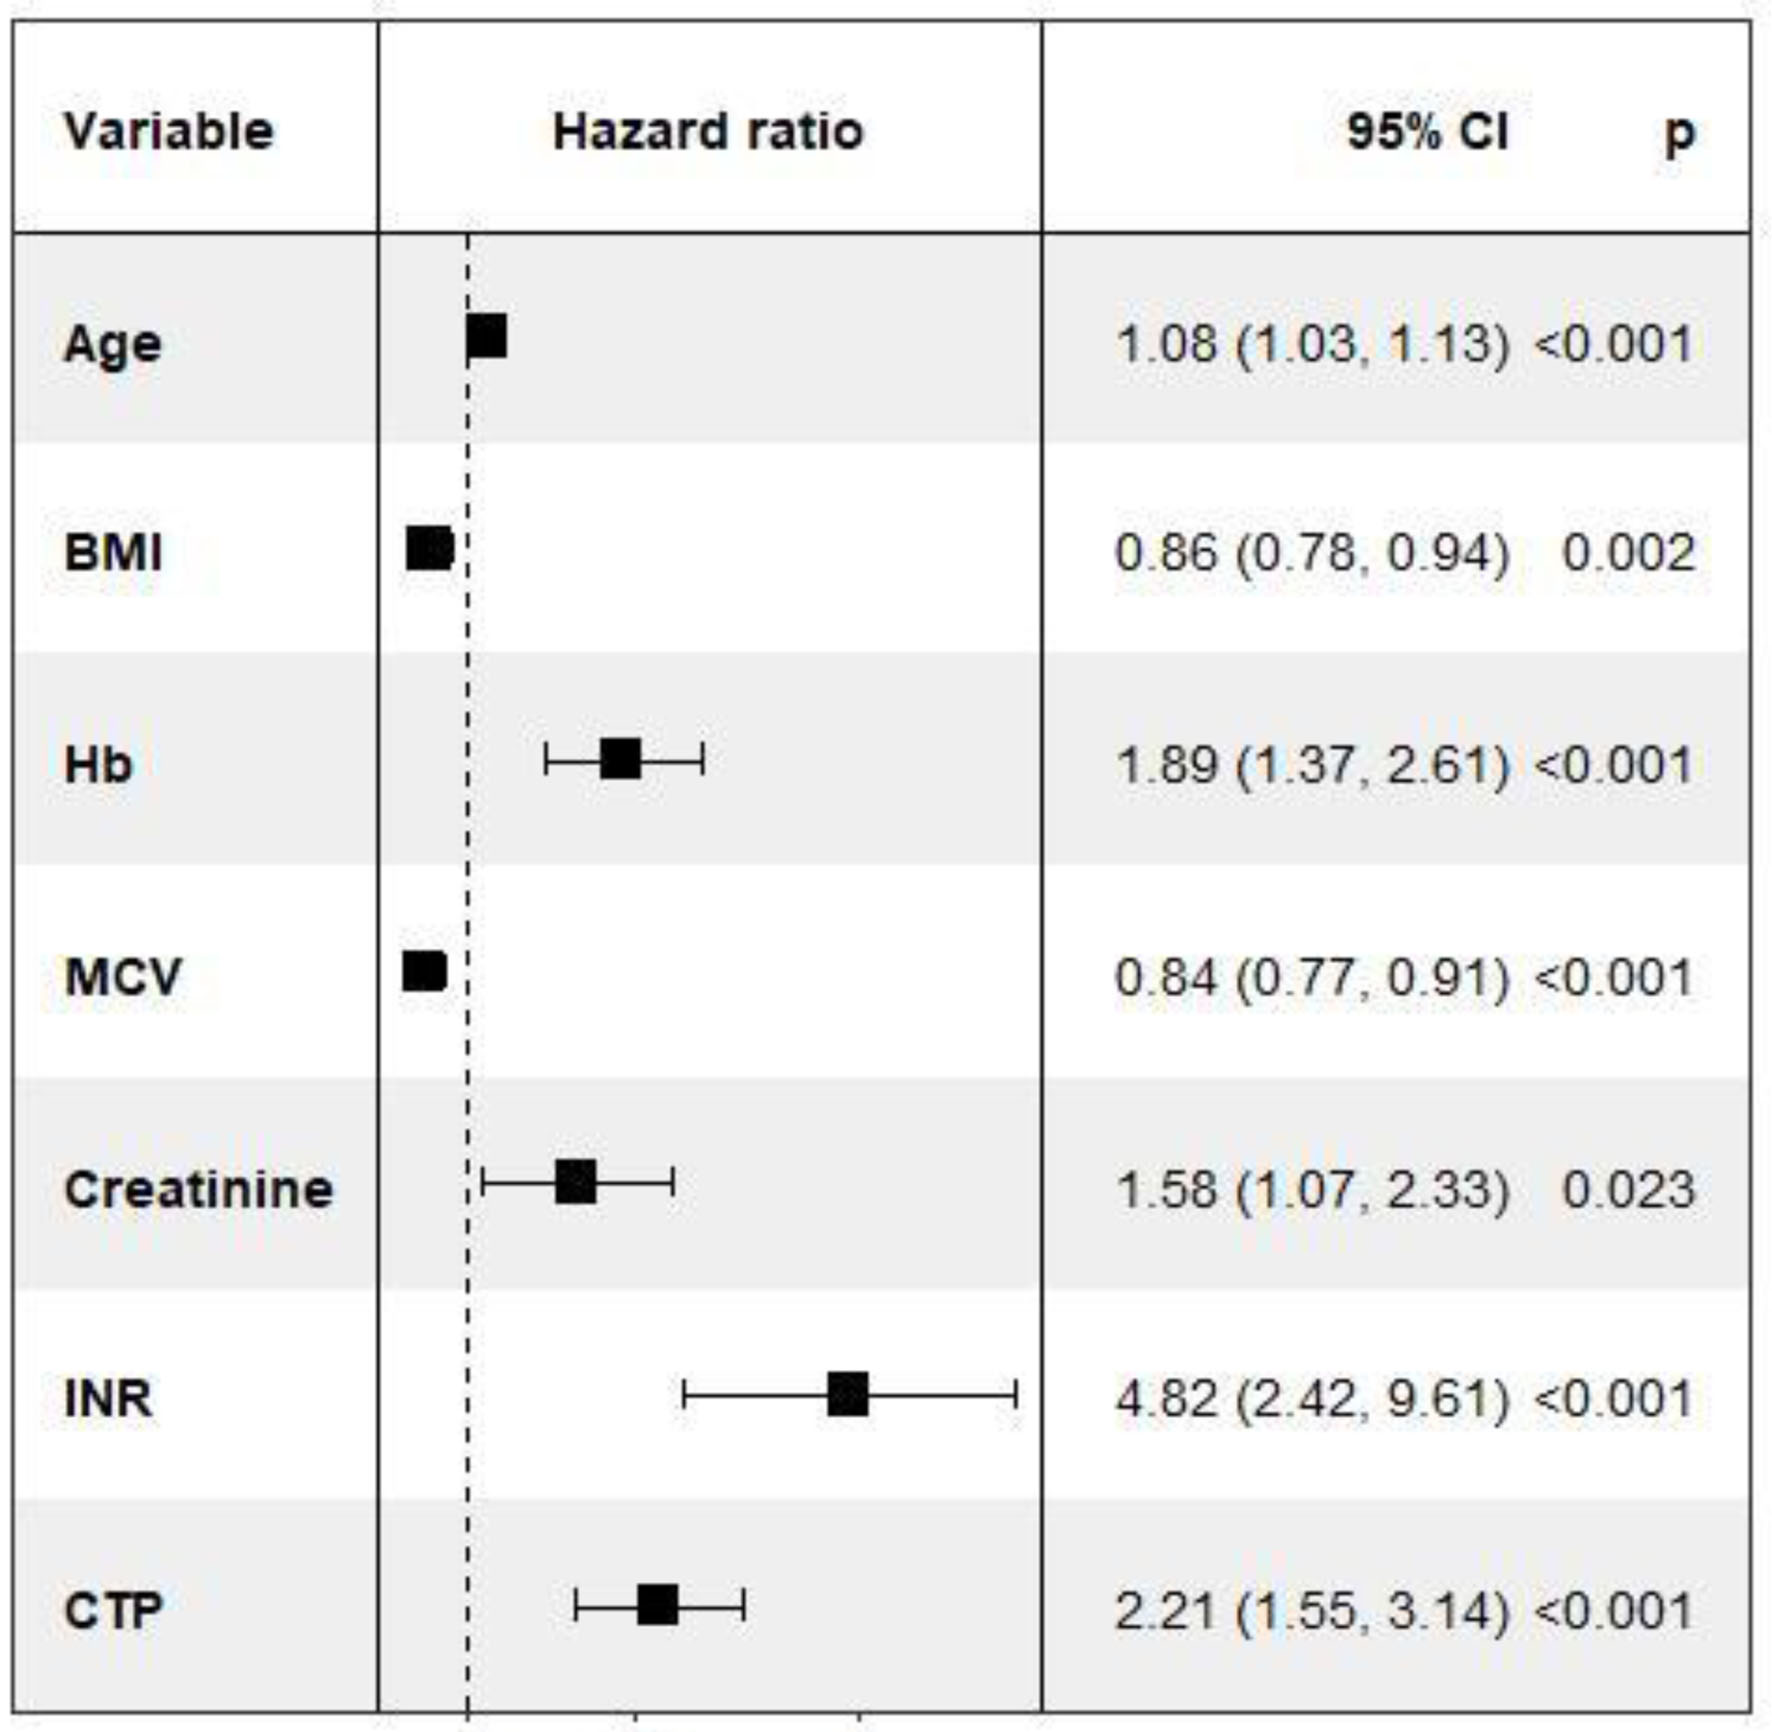
| Age | 1.05 (1.02 - 1.08) | < 0.001 | 1.05 (1.01 - 1.08) | < 0.01 | 1.05 (1.02 - 1.09) | < 0.01 |
| Female | 1.21 (0.58 - 2.54) | 0.62 | ||||
| Race (vs. Caucasian) | 0.26 | |||||
| Hispanic | 1.67 (0.75 - 3.73) | 0.21 | ||||
| Others | 0.54 (0.13 - 2.35) | 0.41 | ||||
| BMI (n = 105) | 0.98 (0.93 - 1.04) | 0.47 | 0.91 (0.84 - 0.98) | 0.02 | 0.92 (0.86 - 0.98) | 0.01 |
| WBC | 1.09 (1.03 - 1.14) | < 0.01 | 1.04 (0.97 - 1.12) | 0.28 | 1.07 (0.99 - 1.16) | 0.08 |
| Hb | 0.89 (0.77 - 1.02) | 0.08 | ||||
| Hct | 0.98 (0.94 - 1.02) | 0.25 | ||||
| MCV | 1.01 (0.96 - 1.06) | 0.72 | ||||
| Platelet | 1.001 (0.998 - 1.004) | 0.41 | ||||
| Cr | 1.57 (1.32 -1.87) | < 0.0001 | ||||
| INR | 1.07 (1.01 - 1.13) | 0.02 | ||||
| PT (n = 107) | 1.013 (1.005 - 1.020) | < 0.01 | ||||
| AST | 1.000 (0.999 - 1.001) | 0.63 | ||||
| ALT | 1.000 (0.999 - 1.001) | 0.92 | ||||
| AP (n = 102) | 1.001 (0.998 - 1.004) | 0.56 | ||||
| Albumin | 0.38 (0.24 - 0.62) | < 0.0001 | 0.63 (0.34 - 1.15) | 0.13 | 0.53 (0.30 - 0.96) | 0.03 |
| < 3.5 | 9.47 (2.24 - 39.96) | < 0.01 | ||||
| Total bilirubin | 1.04 (1.01 - 1.08) | < 0.01 | ||||
| Na | 0.92 (0.88 - 0.97) | < 0.01 | 0.95 (0.89 - 1.02) | 0.14 | 0.94 (0.88 - 0.996) | 0.04 |
| Lactate (n = 8) | 1.19 (0.79 - 1.78) | 0.41 | ||||
| AST/ALT | 1.08 (0.83 - 1.42) | 0.56 | ||||
| ALT/AP (n = 102) | 0.98 (0.80 - 1.21) | 0.85 | ||||
| AST/AP (n = 102) | 1.01 (0.89 - 1.13) | 0.94 | ||||
| AAPI1 (n = 102) | 0.99 (0.92 - 1.07) | 0.85 | ||||
| AAPI2 (n = 102) | 1.00 (0.96 - 1.05) | 0.94 | ||||
| NR ALT/AP (n = 102) | 1.00 (0.96 - 1.04) | 0.85 | ||||
| NR AST/AP (n = 102) | 1.00 (0.98 - 1.02) | 0.94 | ||||
| FIB 4 | 1.01 (0.98 - 1.03) | 0.59 | ||||
| APRI | 1.00 (0.98 - 1.02) | 0.89 | ||||
| CTP (n = 87) | 1.44 (1.21 - 1.71) | < 0.0001 | ||||
| Infection | 1.95 (0.93 - 4.07) | 0.08 | ||||
| Antibiotics use (Y/N) | 2.05 (0.96 - 4.38) | 0.06 | ||||
| MELD | 1.06 (1.03 - 1.08) | < 0.0001 | 1.04 (1.01 - 1.08) | < 0.01 | ||
| ≥ 21 | 5.81 (2.74 - 12.30) | < 0.0001 | ||||
| ≥18 | 5.30 (2.46 - 11.40) | < 0.0001 | ||||
| DF | 1.003 (1.001 - 1.004) | < 0.001 | 1.003 (1.001 - 1.005) | < 0.01 | ||
| ≥ 32 | 4.62 (2.14 - 9.99) | 0.0001 | ||||
| ANI | 1.02 (0.98 - 1.07) | 0.24 | ||||
| ≥ 2.2 | 1.17 (0.52 - 2.65) | 0.71 | ||||
| IR | 1.37 (0.66 - 2.84) | 0.40 | 2.63 (1.08 - 6.40) | 0.03 | 2.84 (1.13 - 7.13) | 0.03 |
| Model | Formula | Uno’s C-statistic |
|---|---|---|
| Based on the comparisons in the difference of Uno’s C-statistic between all of the models, MELD ≥ 21 and DF ≥ 32 alone was significantly worse than model 1 - 14 with a P-value < 0.05. In contrast, the differences in Uno’s C-statistic between all the 14 models were not significantly different with a P-value > 0.05. MELD: model for end-stage liver disease; DF: discriminant function; IR: insulin resistance. | ||
| MELD ≥ 21 | NA | 0.65 |
| DF ≥ 32 | NA | 0.64 |
| Model 1 | h(t) = h0(t)exp(0.034 × Age + 1.474 × MELD ≥ 21) | 0.78 |
| Model 2 | h(t) = h0(t)exp(0.037 × Age + 1.243 × DF ≥ 32) | 0.75 |
| Model 3 | h(t) = h0(t)exp(1.337 × MELD ≥ 21 + 2.025 × Albumin < 3.5) | 0.76 |
| Model 4 | h(t) = h0(t)exp(1.082 × DF ≥ 32 + 1.857 × Albumin < 3.5) | 0.74 |
| Model 5 | h(t) = h0(t)exp(0.028 × Age + 1.154 × MELD ≥ 21 + 1.704 × Albumin < 3.5) | 0.82 |
| Model 6 | h(t) = h0(t)exp(0.032 × Age + 0.907 × DF ≥ 32 + 1.737 × Albumin < 3.5) | 0.79 |
| Model 7 | h(t) = h0(t)exp(0.034 × Age + 1.506 × MELD ≥ 21 + 0.412 × IR) | 0.73 |
| Model 8 | h(t) = h0(t)exp(0.037 × Age + 1.223 × DF ≥ 32 + 0.210 × IR) | 0.73 |
| Model 9 | h(t) = h0(t)exp(0.033 × Age + 1.445 × MELD ≥ 21 + 0.147 × Infection) | 0.78 |
| Model 10 | h(t) = h0(t)exp(0.036 × Age + 1.208 × DF ≥ 32 + 0.204 × Infection) | 0.75 |
| Model 11 | h(t) = h0(t)exp(0.034 × Age + 1.491 × MELD ≥ 21 + 0.401 × IR + 0.084 × Infection) | 0.73 |
| Model 12 | h(t) = h0(t)exp(0.036 × Age + 1.197 × DF ≥ 32 + 0.186 × IR + 0.175 × Infection) | 0.73 |
| Model 13 | h(t) = h0(t)exp(0.027 × Age + 1.191 × MELD ≥ 21 + 1.665 × Albumin < 3.5 + 0.315 × IR + 0.087 × Infection) | 0.79 |
| Model 14 | h(t) = h0(t)exp(0.031 × Age + 0.885 × DF ≥ 32 + 1.718 × Albumin < 3.5 + 0.118 × IR + 0.099 × Infection) | 0.80 |