Gastroenterology Research, ISSN 1918-2805 print, 1918-2813 online, Open Access
Article copyright, the authors; Journal compilation copyright, Gastroenterol Res and Elmer Press Inc
Journal website https://www.gastrores.org

Original Article

Volume 15, Number 4, August 2022, pages 207-216


Trends of Alcohol Withdrawal Delirium in the Last Decade: Analysis of the Nationwide Inpatient Sample

Figures

Figure 1.
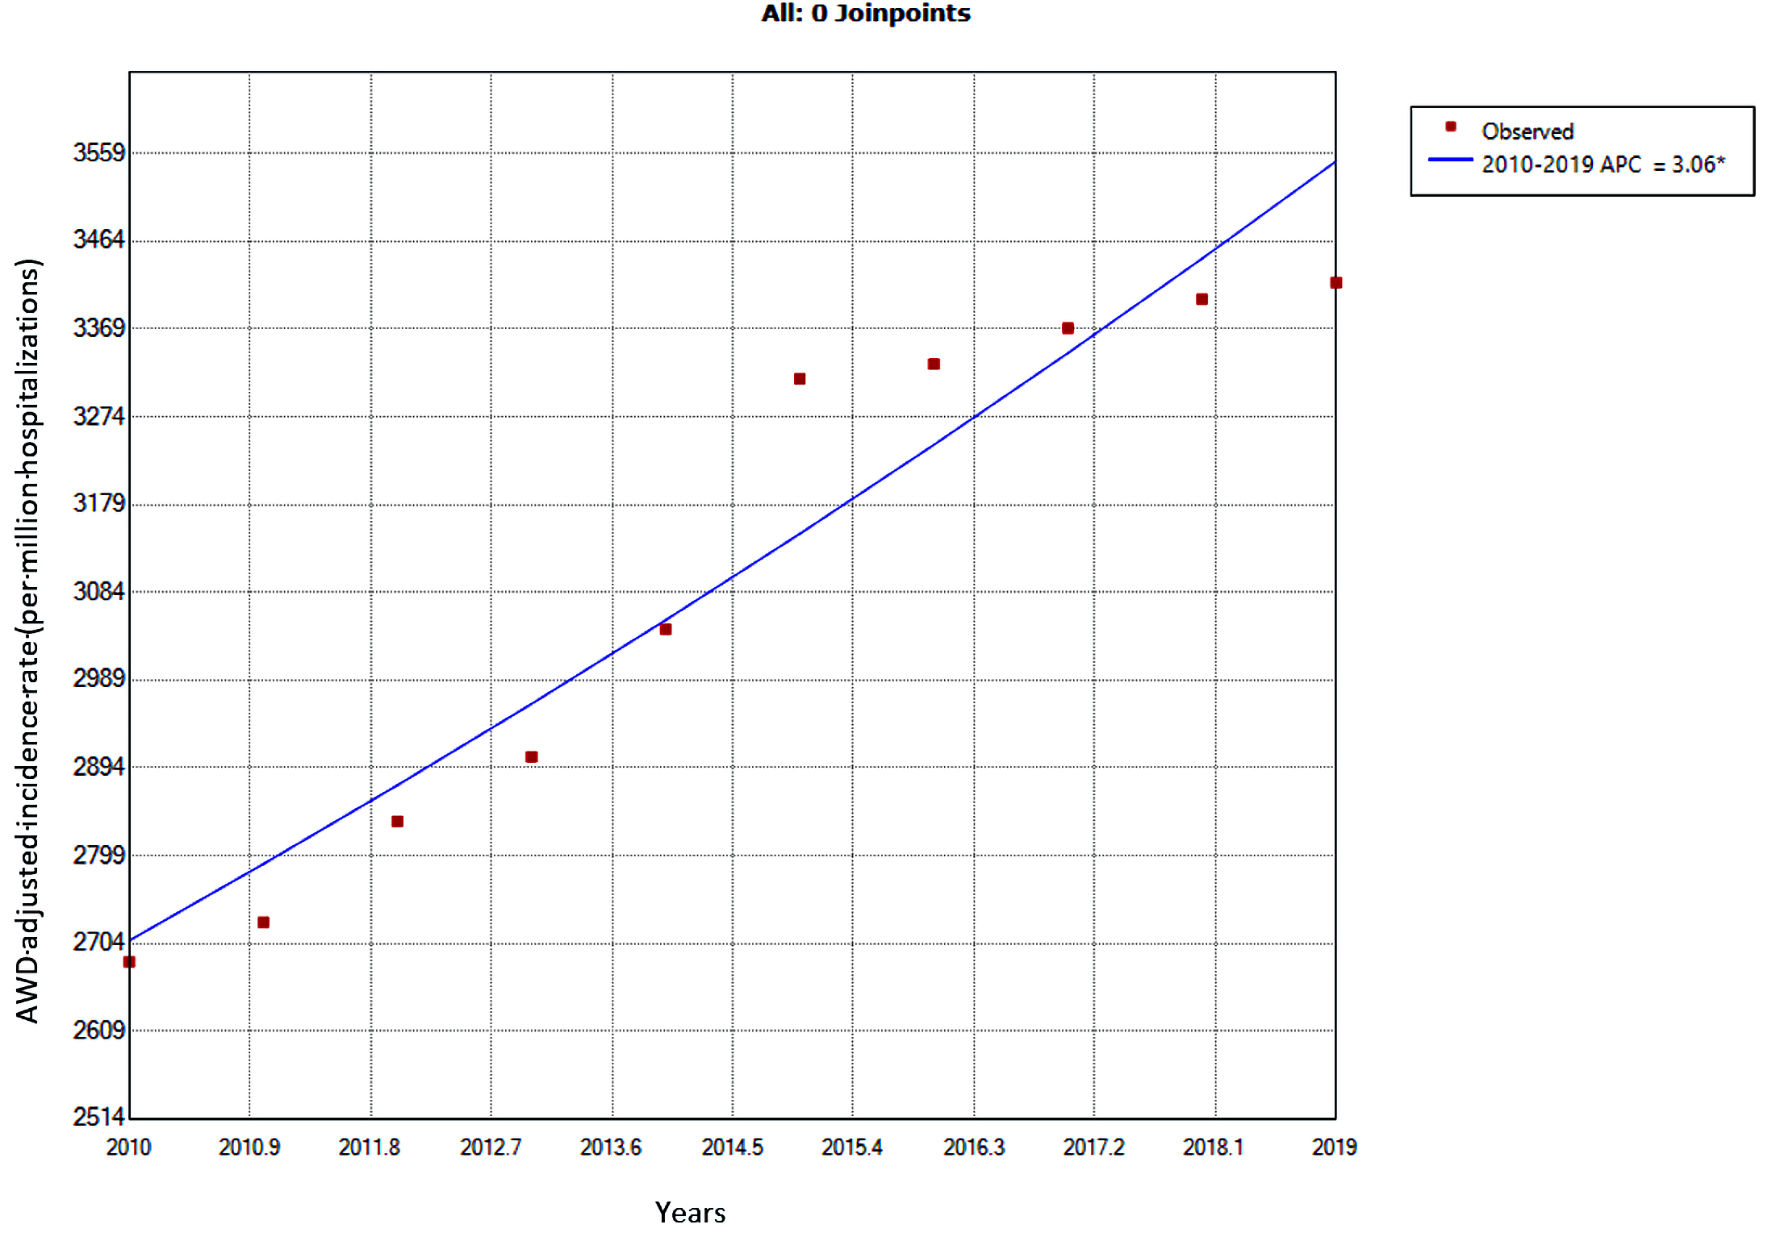
Figure 1. Trends in the adjusted incidence of alcohol withdrawal delirium among all hospitalizations from 2010 to 2019. *Statistically significant. APC = 3.1%, CI: 2.2 - 4.0, P < 0.001. APC: annual percentage change; AWD: alcohol withdrawal delirium.
Figure 2.
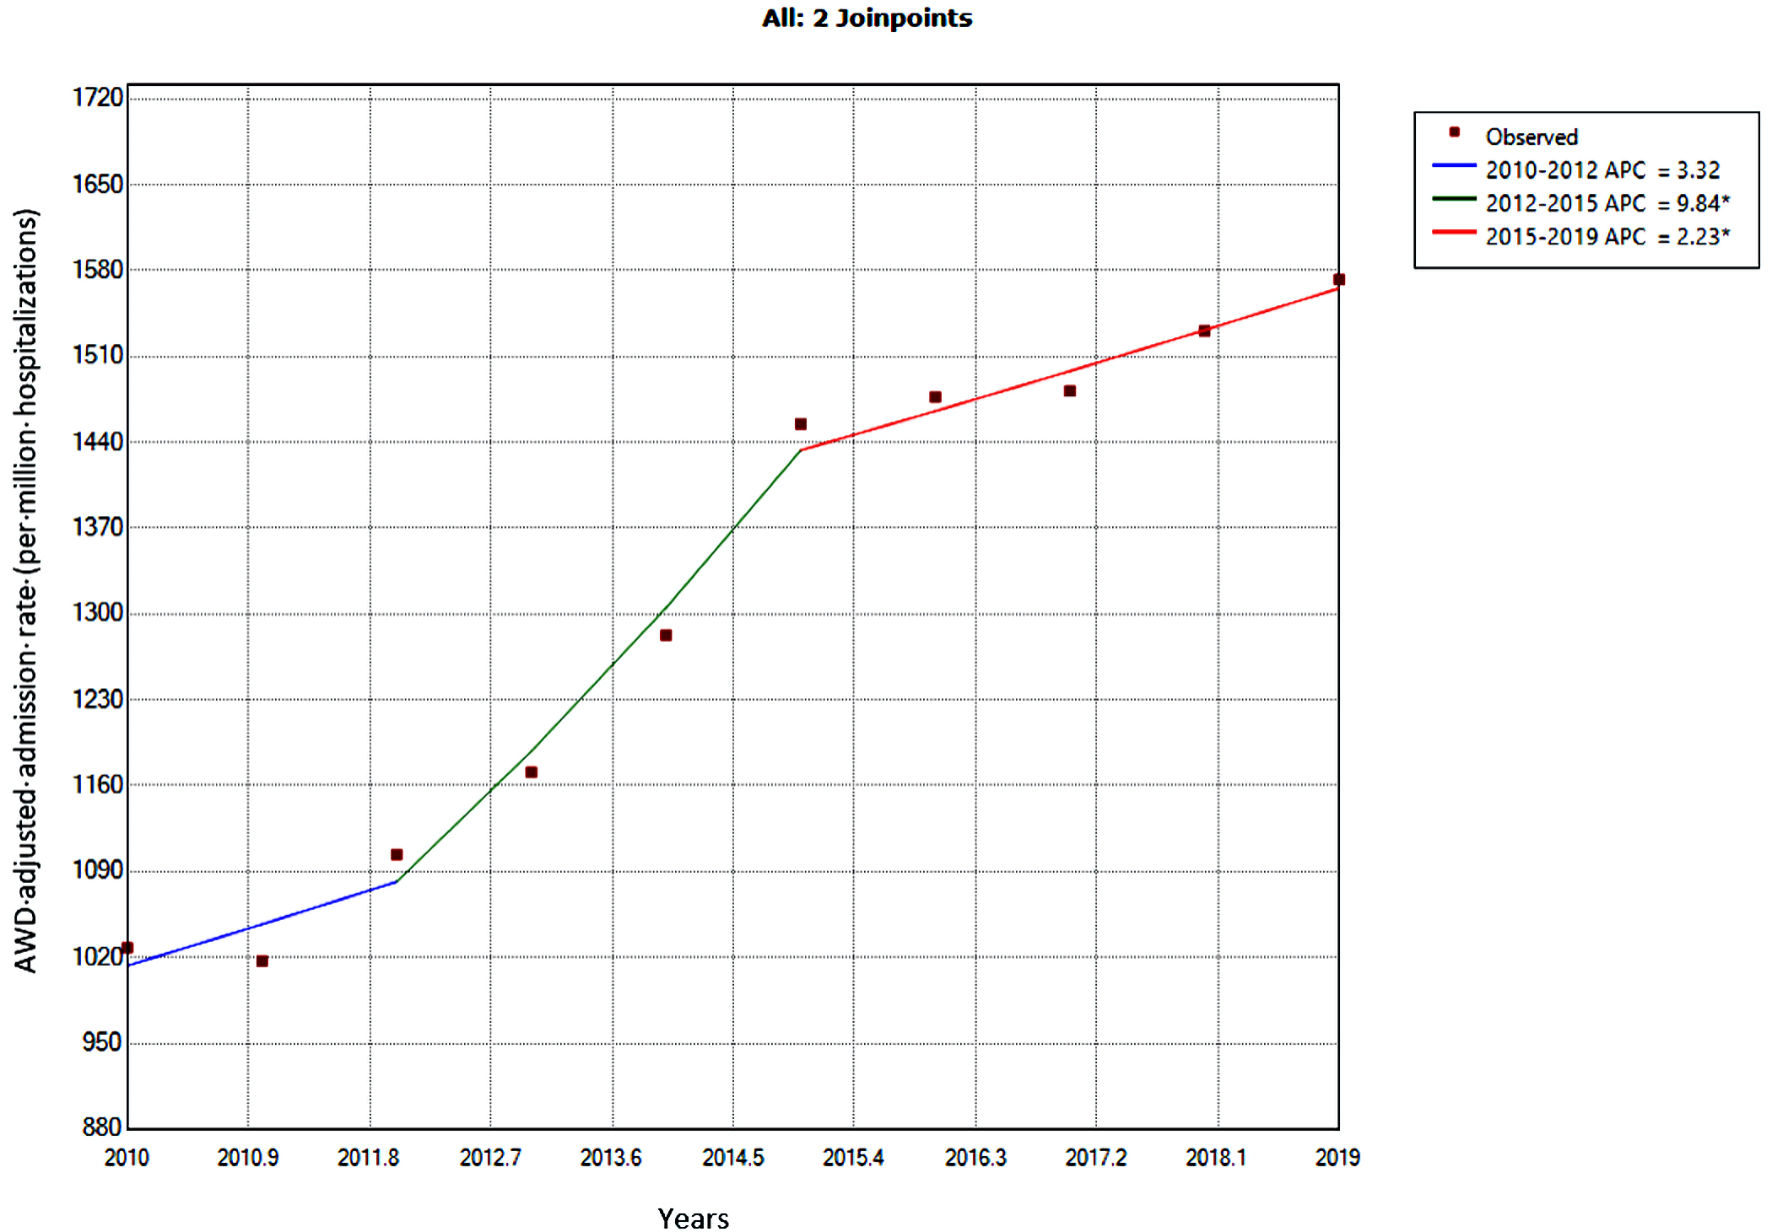
Figure 2. Trends in adjusted alcohol withdrawal delirium admission rate from 2010 to 2019. *Statistically significant. (2010 - 2012) APC = 3.3%, CI: 5.9 - 13.4, P = 0.271; (2012 - 2015) APC = 9.8%, CI: 4.3 - 15.7, P = 0.016; (2015 - 2019) APC = 2.2%, CI: 0.2 - 4.3, P = 0.041; (2010 - 2019) average APC = 5.0%, CI: 3.6 - 6.3, P < 0.001. APC: annual percentage change; AWD: alcohol withdrawal delirium; CI: CI: confidence interval.

Tables

Table 1. Demographics of All Hospitalizations Complicated by Alcohol Withdrawal Delirium (AWD)
 
Year2010201120122013201420152016201720182019P value
CCI: Charlson comorbidity index; SD: standard deviation.
Total hospitalizations (million)31.431.530.73029.830.230.230.430.330.2
Hospitalizations complicated by AWD83,89384,81987,33087,26591,055100,160101,365102,570102,855102,850
Incidence of AWD per million hospitalizations2,671.82,692.72,844.62,908.83,055.53,316.63,356.53,3743,394.63,405.6
Mean age (years) ± SD52.4 ± 12.552.5 ± 12.852.4 ± 12.552.5 ± 12.552.5 ± 12.652.5 ± 12.552.5 ± 12.852.6 ± 12.952.4 ± 13.052.1 ± 13.10.183
Age categories (%)< 0.001
  Young adult24.624.124.824.825.325.626.326.727.729.5
  Middle aged59.059.558.458.658.058.056.955.754.953.1
  Elderly16.516.416.716.716.616.316.817.717.417.4
Female (%)18.720.219.719.720.120.219.919.820.520.70.014
Race (%)< 0.001
  White66.669.272.372.972.972.072.973.273.673.8
  Black10.69.210.19.59.410.29.910.09.59.4
  Hispanic8.37.98.38.58.28.68.69.39.89.7
  Other14.513.79.49.19.59.28.67.57.07.1
Median household income for zip code (%)0.093
  Low income31.230.132.230.031.533.432.431.729.931.1
  Middle income25.925.124.726.527.423.924.826.126.125.5
  Upper middle income22.624.123.924.322.923.623.423.925.124.8
  High income20.320.719.319.318.319.219.418.418.918.7
CCI (%)< 0.001
  049.847.747.648.247.647.033.232.632.131.7
  124.024.224.823.924.324.331.331.431.732.1
  29.69.810.010.110.010.414.113.913.914.0
  ≥ 316.618.317.617.818.118.321.422.122.322.3
Primary payer (%)< 0.001
  Medicare28.229.029.729.728.528.027.827.426.5
  Medicaid21.222.022.423.232.034.236.036.937.8
  Private insurance26.726.024.625.124.124.624.022.922.8
  Self-pay23.823.023.322.015.413.112.312.812.9


Table 2. Outcomes of All Hospitalizations Complicated by Alcohol Withdrawal Delirium
 
2010201120122013201420152016201720182019P trend
THC: total hospital charges; LOS: length of stay.
Mortality (%)2.42.42.42.62.32.52.62.82.52.40.044
THC ($)71,10174,03174,54777,00680,54583,27388,22489,80689,89291,642< 0.001
LOS (days)8.58.48.58.48.68.68.88.78.68.50.006


Table 3. Demographics of Hospitalizations With Alcohol Withdrawal Delirium (AWD) as the Principal Diagnosis
 
Year2010201120122013201420152016201720182019P value
CCI: Charlson comorbidity index; SD: standard deviation.
Hospitalization with AWD as principal diagnosis32,35231,69134,13035,25038,46043,97044,95044,94546,10046,990
AWD admission rate per million hospitalizations1,030.31,006.11,111.71,1751,290.61,4561,488.41,478.51,521.51,556
Mean age (years) ± SD48.9 ± 11.349.1 ± 11.749.0 ± 11.649.1 ± 11.649.1 ± 11.749.4 ± 11.949.1 ± 12.149.3 ± 12.249.2 ± 12.448.9 ± 12.40.439
Age categories (%)< 0.001
  Young adult32.832.233.233.233.633.634.735.235.637.5
  Middle aged58.659.157.758.057.456.855.854.253.752.2
  Elderly8.68.79.18.89.09.69.610.610.710.3
Female (%)18.420.419.319.320.219.819.019.219.420.00.231
Race (%)< 0.001
  White66.369.071.973.372.371.471.972.572.672.7
  Black9.68.38.98.08.28.99.28.88.68.6
  Hispanic10.39.49.89.59.49.910.211.111.411.4
  Other13.813.39.59.210.19.88.77.67.37.4
Median household income for zip code (%)0.031
  Low income30.127.030.327.829.331.230.029.126.629.1
  Middle income24.423.623.426.126.323.024.525.126.124.6
  Upper middle income23.425.624.624.924.024.124.624.826.426.0
  High income22.123.821.721.320.421.821.021.020.920.3
CCI (%)< 0.001
  066.966.464.064.764.859.444.143.842.241.7
  120.821.023.121.021.024.835.035.335.336.1
  25.55.35.66.36.07.110.510.211.411.2
  ≥ 36.77.37.38.18.38.710.410.811.111.1
Primary payer (%)< 0.001
  Medicare19.020.620.420.820.920.720.120.019.718.7
  Medicaid21.922.223.324.535.338.140.341.341.542.2
  Private insurance27.327.425.926.924.625.424.424.423.223.8
  Self-pay31.839.930.427.819.215.815.214.315.615.3


Table 4. Outcomes of Hospitalizations With Alcohol Withdrawal Delirium as the Principal Diagnosis
 
2010201120122013201420152016201720182019P trend
THC: total hospital charges; LOS: length of stay.
Mortality (%)0.50.50.40.50.40.50.50.40.40.50.797
THC ($)37,09338,30639,49741,18544,00546,29348,05949,54651,07551,543< 0.001
LOS (days)5.85.85.85.96.16.16.26.26.26.0< 0.001