Gastroenterology Research, ISSN 1918-2805 print, 1918-2813 online, Open Access
Article copyright, the authors; Journal compilation copyright, Gastroenterol Res and Elmer Press Inc
Journal website https://www.gastrores.org

Original Article

Volume 15, Number 6, December 2022, pages 314-324


Expanding the Use of Endoscopic Retrograde Cholangiopancreatography in Pediatrics: A National Database Analysis of Demographics and Complication Rates

Figures

Figure 1.
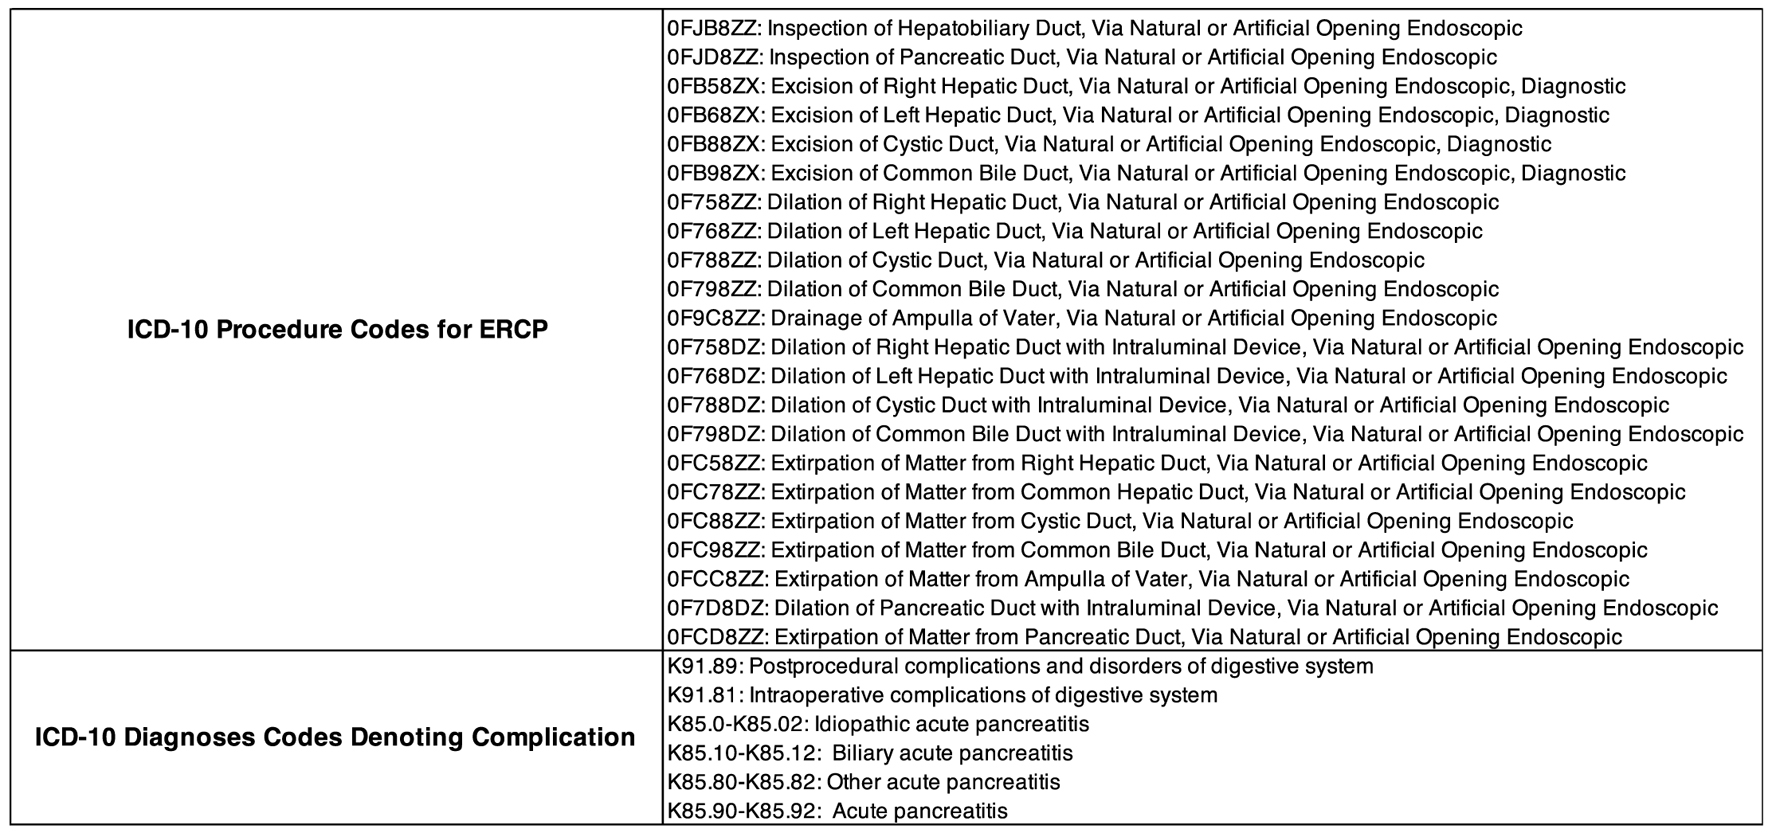
Figure 1. ICD10 procedure codes used to identify an ERCP during a hospitalization. Presenting diagnoses are provided by the KID for each individual hospitalization. Also shown are the codes used to define complication associated with performed ERCP. *A diagnosis code for pancreatitis was captured as a complication if the diagnosis code was entered within 24 h of the documented ERCP. ERCP: endoscopic retrograde cholangiopancreatography; KID: Kids’ Inpatient Database.
Figure 2.
Figure 2. Differences in admission primary diagnosis between genders. Females had statistically higher rates of calculus of the gallbladder/bile duct (P = 0.03) and chronic cholecystitis (P = 0.02). Males had higher rates of traumatic injury (P < 0.001), obstruction of the bile duct (P < 0.001), cholangitis (P = 0.002), and primary sclerosing cholangitis (P = 0.02).

Tables

Table 1. Overall Clinical and Demographic Characteristics of Patients From the 2016 Kids’ Inpatient Database
 
CharacteristicsValues
Over 6 million hospitalizations were included in the overall sample, and we restricted the query to live births with at least one ERCP, giving n = 4,484 for ages 0 to 20 and n = 1,934 for ages 0 to 17. A large percentage of the captured patients came from the older age groups, indicating that this is an uncommon procedure in patients age ≤ 10. ERCP: endoscopic retrograde cholangiopancreatography.
Total admissions4,484
Gender
  Male1,006 (22.47%)
  Female3,478 (77.53%)
Complication rate242 (5.41%)
Median length of stay (days)
  Male4
  Female3
In-hospital mortality0.20%
Age
  0 - 5183 (4.09%)
  6 - 10197 (4.40%)
  11 - 15740 (16.51%)
  16 - 203,364 (75.00%)
  Total4,484
Race
  White1,792 (39.97%)
  Black559 (12.49%)
  Hispanic1,483 (33.09%)
  Asian/Pacific Islander81 (1.82%)
  Native American68 (1.53%)
  Other232 (5.19%)
Region
  Northeast649 (14.48%)
  Midwest779 (17.39%)
  South1,826 (40.73%)
  West1,228 (27.39%)
Presenting diagnosis frequency
  Traumatic injury or organ laceration89 (2.00%)
  Sepsis60 (1.35%)
  Acute pancreatitis487 (10.86%)
  Chronic pancreatitis59 (1.33%)
  Obstruction of bile duct99 (2.23%)
  Cholangitis166 (3.71%)
  Calculus of gallbladder/bile duct1,015 (22.64%)
  Chronic cholecystitis346 (7.72%)
  Acute cholecystitis1,223 (27.29%)
  Primary sclerosing cholangitis91 (2.03%)
  Malignancy/tumor56 (1.26%)
  Retained stones after cholecystectomy102 (2.28%)
  Procedural complication108 (2.43%)
ERCP number
  13,137 (69.97%)
  21,172 (26.15%)
  3139 (3.11%)
  425 (0.56%)
  > 5≤ 10


Table 2. ERCP Age Group Comparison
 
CharacteristicsAge (frequency (%))P-value
0 - 5 (n = 183)6 - 10 (n = 197)11 - 15 (n = 740)16 - 20 (n = 3,363)
The common primary diagnoses for age ≤ 5 were acute pancreatitis, obstruction of the bile duct, cholangitis, and malignancy/tumor. This contrasts with the older age groups which had higher rates of acute cholecystitis and calculus of the gallbladder. Patients ≤ 5 were more frequently White or Black, and age > 10 were more often Hispanic. There was no statistical difference in rates of repeat procedure or complication between age groups. ERCP: endoscopic retrograde cholangiopancreatography.
Routine discharge161 (89.6%)181 (92.3%)705 (95.5%)3,223 (95.9%)< 0.001
Facility transfer, home health, AMA, in-hospital mortality17 (9.3%)14 (6.6%)32 (4.3%)137 (4.1%)
Median length of stay6543< 0.001
Procedural complications14 (7.9%)≤ 1036 (5%)181 (5.4%)0.68
Race
  White86 (51.5%)72 (41.8%)276 (41%)1,356 (42.4%)
  Black31 (19%)29 (16.7%)102 (15.2%)396 (12.4%)
  Hispanic29 (17.7%)50 (29.1%)225 (33.4%)1,178 (36.8%)
  Asian/Pacific Islander≤ 1012 (7%)≤ 1052 (1.6%)
  Native American≤ 10≤ 1018 (2.8%)47 (1.5%)
  Other≤ 10≤ 1042 (6.3%)171 (5.3%)
Diagnosis
  Traumatic injury or organ laceration≤ 1015 (7.8%)18 (2.6%)47 (1.4%)< 0.001
  Sepsis≤ 10≤ 10≤ 1052 (1.6%)0.1
  Acute pancreatitis30 (16.8%)29 (14.8%)96 (13%)330 (9.8%)0.001
  Chronic pancreatitis≤ 10≤ 1028 (3.8%)16 (0.5%)< 0.001
  Obstruction of bile duct18 (10.1%)11 (5.7%)15 (2.1%)55 (1.6%)< 0.001
  Cholangitis12 (6.8%)≤ 1041 (5.6%)103 (3.1%)0.003
  Calculus of gallbladder/bile duct27 (14.8%)47 (24%)205 (27.8%)734 (21.9%)0.27
  Chronic cholecystitis≤ 1015 (7.8%)58 (7.8%)270 (8%)0.19
  Acute cholecystitis≤ 1013 (7.1%)153 (20.8%)1,047 (31.1%)< 0.001
  Primary sclerosing cholangitis≤ 10≤ 1026 (3.6%)53 (1.6%)0.01
  Malignancy/tumor15 (8.3%)≤ 1013 (1.9%)23 (0.7%)< 0.001
  Retained stones after cholecystectomy≤ 10≤ 1014 (2%)86 (2.6%)0.05
  Procedural complication≤ 10≤ 1017 (2.4%)82 (2.5%)0.83
Repeat ERCP
  No118 (64.9%)142 (72.1%)505 (68.2%)2,371 (70.5%)0.27
  Yes64 (35.1%)55 (27.9%)235 (31.8%)992 (29.5%)


Table 3. Gender Comparison
 
CharacteristicsGender (frequency (%))Odds ratio95% CIP-value
Female (n = 3,478)Male (n = 1,002)
Over three-fourths of the ERCPs performed in this dataset occurred in females. Here we see the increased rates of complication and decreased rate of home discharge seen in the male population which was proportionally younger than the female population. Males were also seen to have extended lengths of stay and increased frequency of multiple ERCPs during hospitalization. Presenting diagnoses differed dramatically between genders. ERCP: endoscopic retrograde cholangiopancreatography.
Postprocedural complications173 (5%)68 (6.9%)0.71(0.514, 0.988)0.04
Median length of stay (days)34< 0.001
Repeat ERCP rate1,019 (29.3%)324 (32.4%)0.098
Routine home discharge3,350 (96.5%)920 (91.9%)0.001
Facility transfer, home health, AMA, in-hospital mortality128 (3.5%)82 (8.1%)
Diagnosis
  Traumatic injury or organ laceration29 (0.9%)59 (6%)0.14(0.077, 0.2)< 0.001
  Sepsis30 (0.9%)30 (3.1%)0.28(0.144, 0.5)< 0.001
  Acute pancreatitis365 (10.5%)121 (12.1%)0.85(0.654, 1.1)0.23
  Chronic pancreatitis34 (1%)24 (2.5%)0.39(0.187, 0.8)0.01
  Obstruction of bile duct51 (1.5%)48 (4.9%)0.29(0.196, 0.4)< 0.001
  Cholangitis76 (2.2%)89 (9%)0.23(0.151, 0.3)< 0.001
  Calculus of gallbladder/bile duct842 (24.2%)173 (17.3%)1.53(1.213, 1.9)< 0.001
  Chronic cholecystitis292 (8.4%)53 (5.4%)1.62(1.145, 2.3)0.006
  Acute cholecystitis1,017 (29.3%)205 (20.5%)1.6(1.311, 2)< 0.001
  Primary sclerosing cholangitis34 (1%)56 (5.6%)0.17(0.095, 0.3)< 0.001
  Malignancy/tumor35 (1%)19 (1.9%)0.54(0.232, 1.2)0.15
  Retained stones after cholecystectomy83 (2.4%)19 (1.9%)1.25(0.698, 2.2)0.46
  Procedural complication78 (2.3%)30 (3%)0.75(0.463, 1.2)0.23
ERCP number
  12,459 (70.7%)678 (67.6%)0.004
  2904 (26%)265 (26.4%)
  398 (2.8%)41 (4.1%)
  413 (0.4%)11 (1.1%)
  5≤ 10≤ 10
  6≤ 10≤ 10


Table 4. Hispanic vs. White Race Comparison
 
CharacteristicsRace (frequency (%))Odds ratio95% CIP-value
Hispanic (n = 1,483)Non-Hispanic White (n = 1,792)
Differences between the two largest patient racial demographics, Hispanics and non-Hispanic whites (NHW) are depicted. The lower rate of complication observed in the Hispanic population can be attributed to the increased rate of acute cholecystitis, a diagnosis associated with low rates of complication. Though not statistically significant, a trend can be seen between non-Hispanic whites and repeat ERCP. Rates of interfacility transfer, home health discharge, discharge against medical advice, and in-hospital mortality also appeared to be higher in this group. ERCP: endoscopic retrograde cholangiopancreatography.
Postprocedural complications65 (4.4%)126 (7.1%)0.61(0.425, 0.881)0.008
Median length of stay (days)430.23
Repeat ERCP rate412 (27.8%)556 (31%)0.096
Routine home discharge1,428 (96.3%)1,702 (95.0%)
Facility transfer, home health, AMA, in-hospital mortality55 (3.7%)90 (5.0%)
Diagnosis
  Traumatic injury or organ laceration13 (0.9%)48 (2.7%)0.34(0.168, 0.7)0.002
  Sepsis17 (1.2%)25 (1.4%)0.85(0.403, 1.8)0.66
  Acute pancreatitis150 (10.1%)209 (11.7%)0.86(0.644, 1.1)0.28
  Chronic pancreatitis20 (1.4%)22 (1.2%)1.11(0.596, 2.1)0.74
  Obstruction of bile duct23 (1.6%)33 (1.9%)0.84(0.438, 1.6)0.59
  Cholangitis27 (1.8%)72 (4%)0.44(0.242, 0.8)0.008
  Calculus of gallbladder/bile duct317 (21.4%)394 (22%)0.96(0.781, 1.2)0.74
  Chronic cholecystitis122 (8.3%)136 (7.6%)1.09(0.818, 1.5)0.55
  Acute cholecystitis503 (33.9%)443 (24.8%)1.56(1.289, 1.9)< 0.001
  Primary sclerosing cholangitis≤ 1040 (2.2%)0.27(0.11, 0.7)0.005
  Malignancy/tumor15 (1%)29 (1.6%)0.62(0.28, 1.4)0.24
  Retained stones after cholecystectomy28 (1.9%)45 (2.5%)0.75(0.424, 1.3)0.34
  Procedural complication22 (1.5%)62 (3.5%)0.41(0.232, 0.7)0.003
ERCP number
  01,071 (72.2%)1,236 (69%)0.054
  1367 (24.7%)484 (27%)
  236 (2.5%)56 (3.1%)
  3≤ 1011 (0.6%)
  4≤ 10≤ 10


Table 5. Region Comparison
 
CharacteristicsRegion (frequency (%))P value
Northeast (n = 649)Midwest (n = 779)South (n = 1,826West (n = 1,228)MSW
Regional differences are depicted. Northeast and Midwest regions were similar in that they exhibited higher rates of post-procedure complication and repeat ERCP. There was little difference in presenting diagnosis between these two regions. The South and West, which had proportionally higher numbers of Hispanic patients, exhibited lower rates of cholangitis and procedure complication as a presenting diagnosis. ERCP: endoscopic retrograde cholangiopancreatography.
Postprocedural complications49 (7.7%)48 (6.2%)89 (4.9%)55 (4.5%)0.40.050.03
Median length of stay (days)43440.050.890.21
Repeat ERCP rate227 (35.0%)269 (34.5%)520 (28.4%)329 (26.8%)0.810.010.002
Routine home discharge599 (92.3%)734 (94.9%)1,748 (95.7%)1,189 (96.9%)0.001
Facility transfer, home health, AMA, in-hospital mortality50 (7.7%)45 (5.1%)78 (4.3%)39 (3.1%)
Diagnosis
  Traumatic injury or organ laceration10 (1.6%)22 (2.9%)42 (2.4%)13 (1.1%)0.190.340.42
  Sepsis≤ 10≤ 1028 (1.6%)14 (1.2%)0.660.430.81
  Acute pancreatitis59 (9.2%)95 (12.3%)183 (10%)148 (12.1%)0.130.630.13
  Chronic pancreatitis≤ 10≤ 1020 (1.1%)29 (2.4%)0.160.960.35
  Obstruction of bile duct19 (2.9%)12 (1.7%)41 (2.3%)26 (2.2%)0.20.570.45
  Cholangitis38 (5.9%)45 (5.8%)49 (2.7%)33 (2.8%)0.960.020.08
  Calculus of gallbladder/bile duct168 (25.9%)165 (21.3%)414 (22.7%)266 (21.7%)0.090.20.14
  Chronic cholecystitis40 (6.2%)49 (6.4%)147 (8.1%)108 (8.8%)0.910.160.09
  Acute cholecystitis153 (23.6%)204 (26.2%)537 (29.4%)328 (26.8%)0.460.060.36
  Primary Sclerosing cholangitis19 (3%)24 (3.1%)27 (1.5%)20 (1.6%)0.910.180.4
  Malignancy/tumor≤ 10≤ 1016 (0.9%)23 (1.9%)0.770.60.47
  Retained stones after cholecystectomy12 (1.9%)24 (3.2%)41 (2.3%)23 (1.9%)0.230.660.98
  Procedural complication26 (4.1%)21 (2.7%)35 (1.9%)25 (2.1%)0.220.020.04
ERCP number
  1420 (64.8%)510 (65.5%)1,306 (71.5%)899 (73.2%)0.001
  2203 (31.4%)228 (29.4%)448 (24.6%)291 (23.7%)
  319 (3%)33 (4.3%)57 (3.1%)29 (2.4%)
  4≤ 10≤ 10≤ 10≤ 10
  5≤ 10≤ 10≤ 10≤ 10