Figures
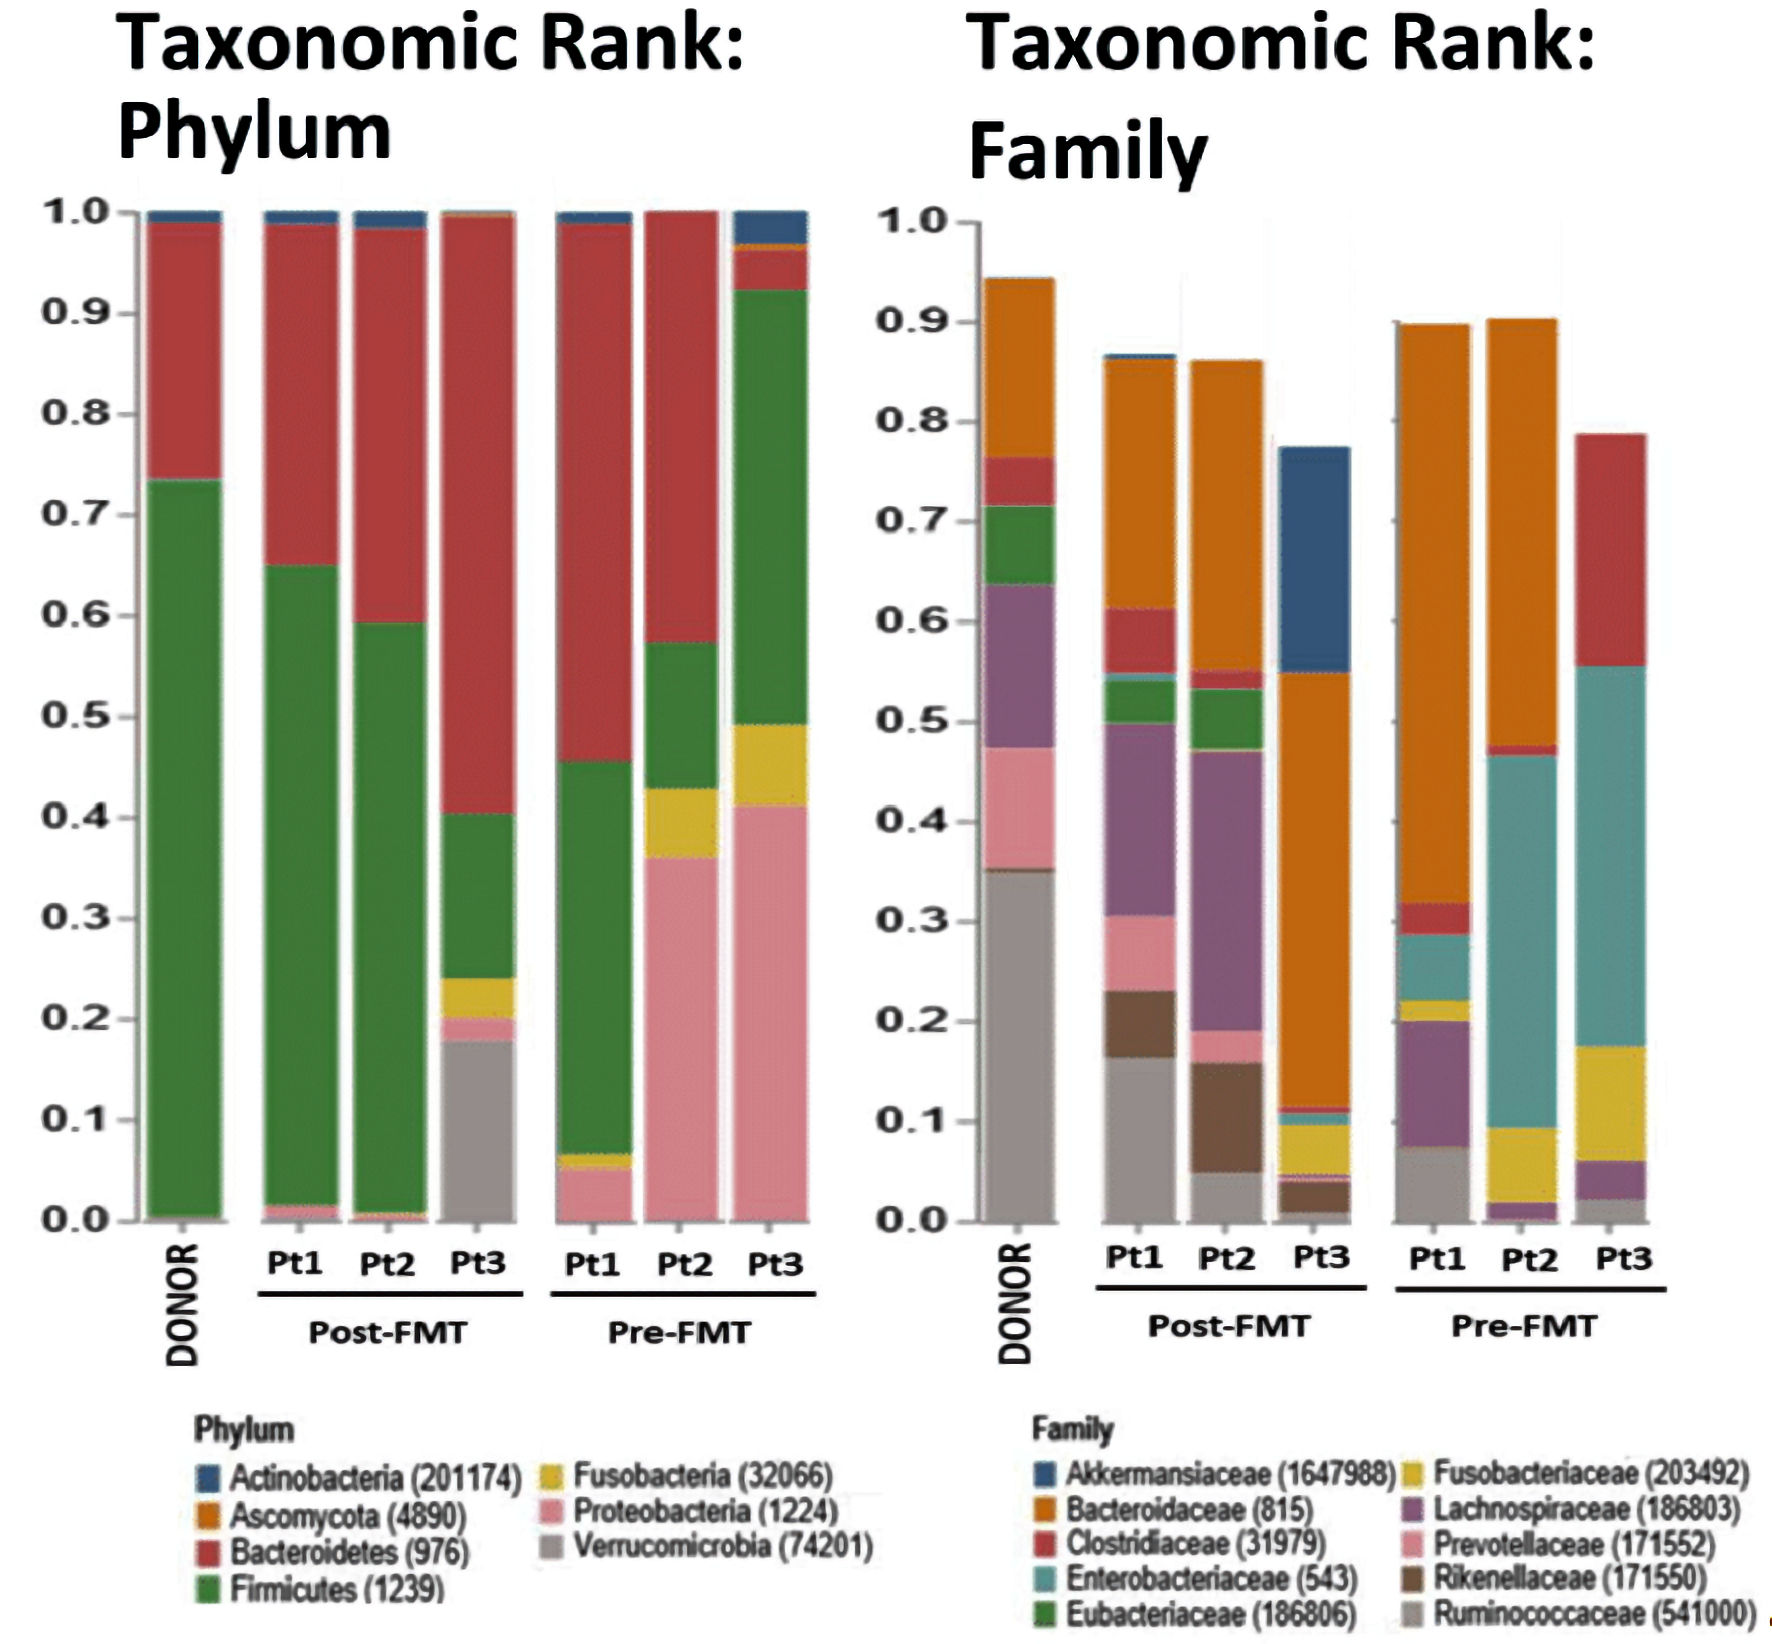
Figure 1. Relative abundances (RAs, %) of bacteria in stool samples of donor, post-FMT and pre-FMT samples. Columns represent individual patients with colored bars capturing their respective RAs (%) at the phylum and family levels. The RAs of phylum Firmicutes in the donor, patient (Pt.) 1, Pt. 2, and Pt. 3 post-FMT were 73%, 63%, 60%, and 16%, respectively; as compared to the patients matched pre-FMT of 51%, 15%, and 43%. The relative abundance of family Lachnospiraceae in the donor, Pt. 1, Pt. 2, and Pt. 3 post-FMT were 15%, 19%, 27%, and 0.36%, respectively; as compared to the patients matched pre-FMT RAs of 34%, 1.7%, and 23%, respectively.
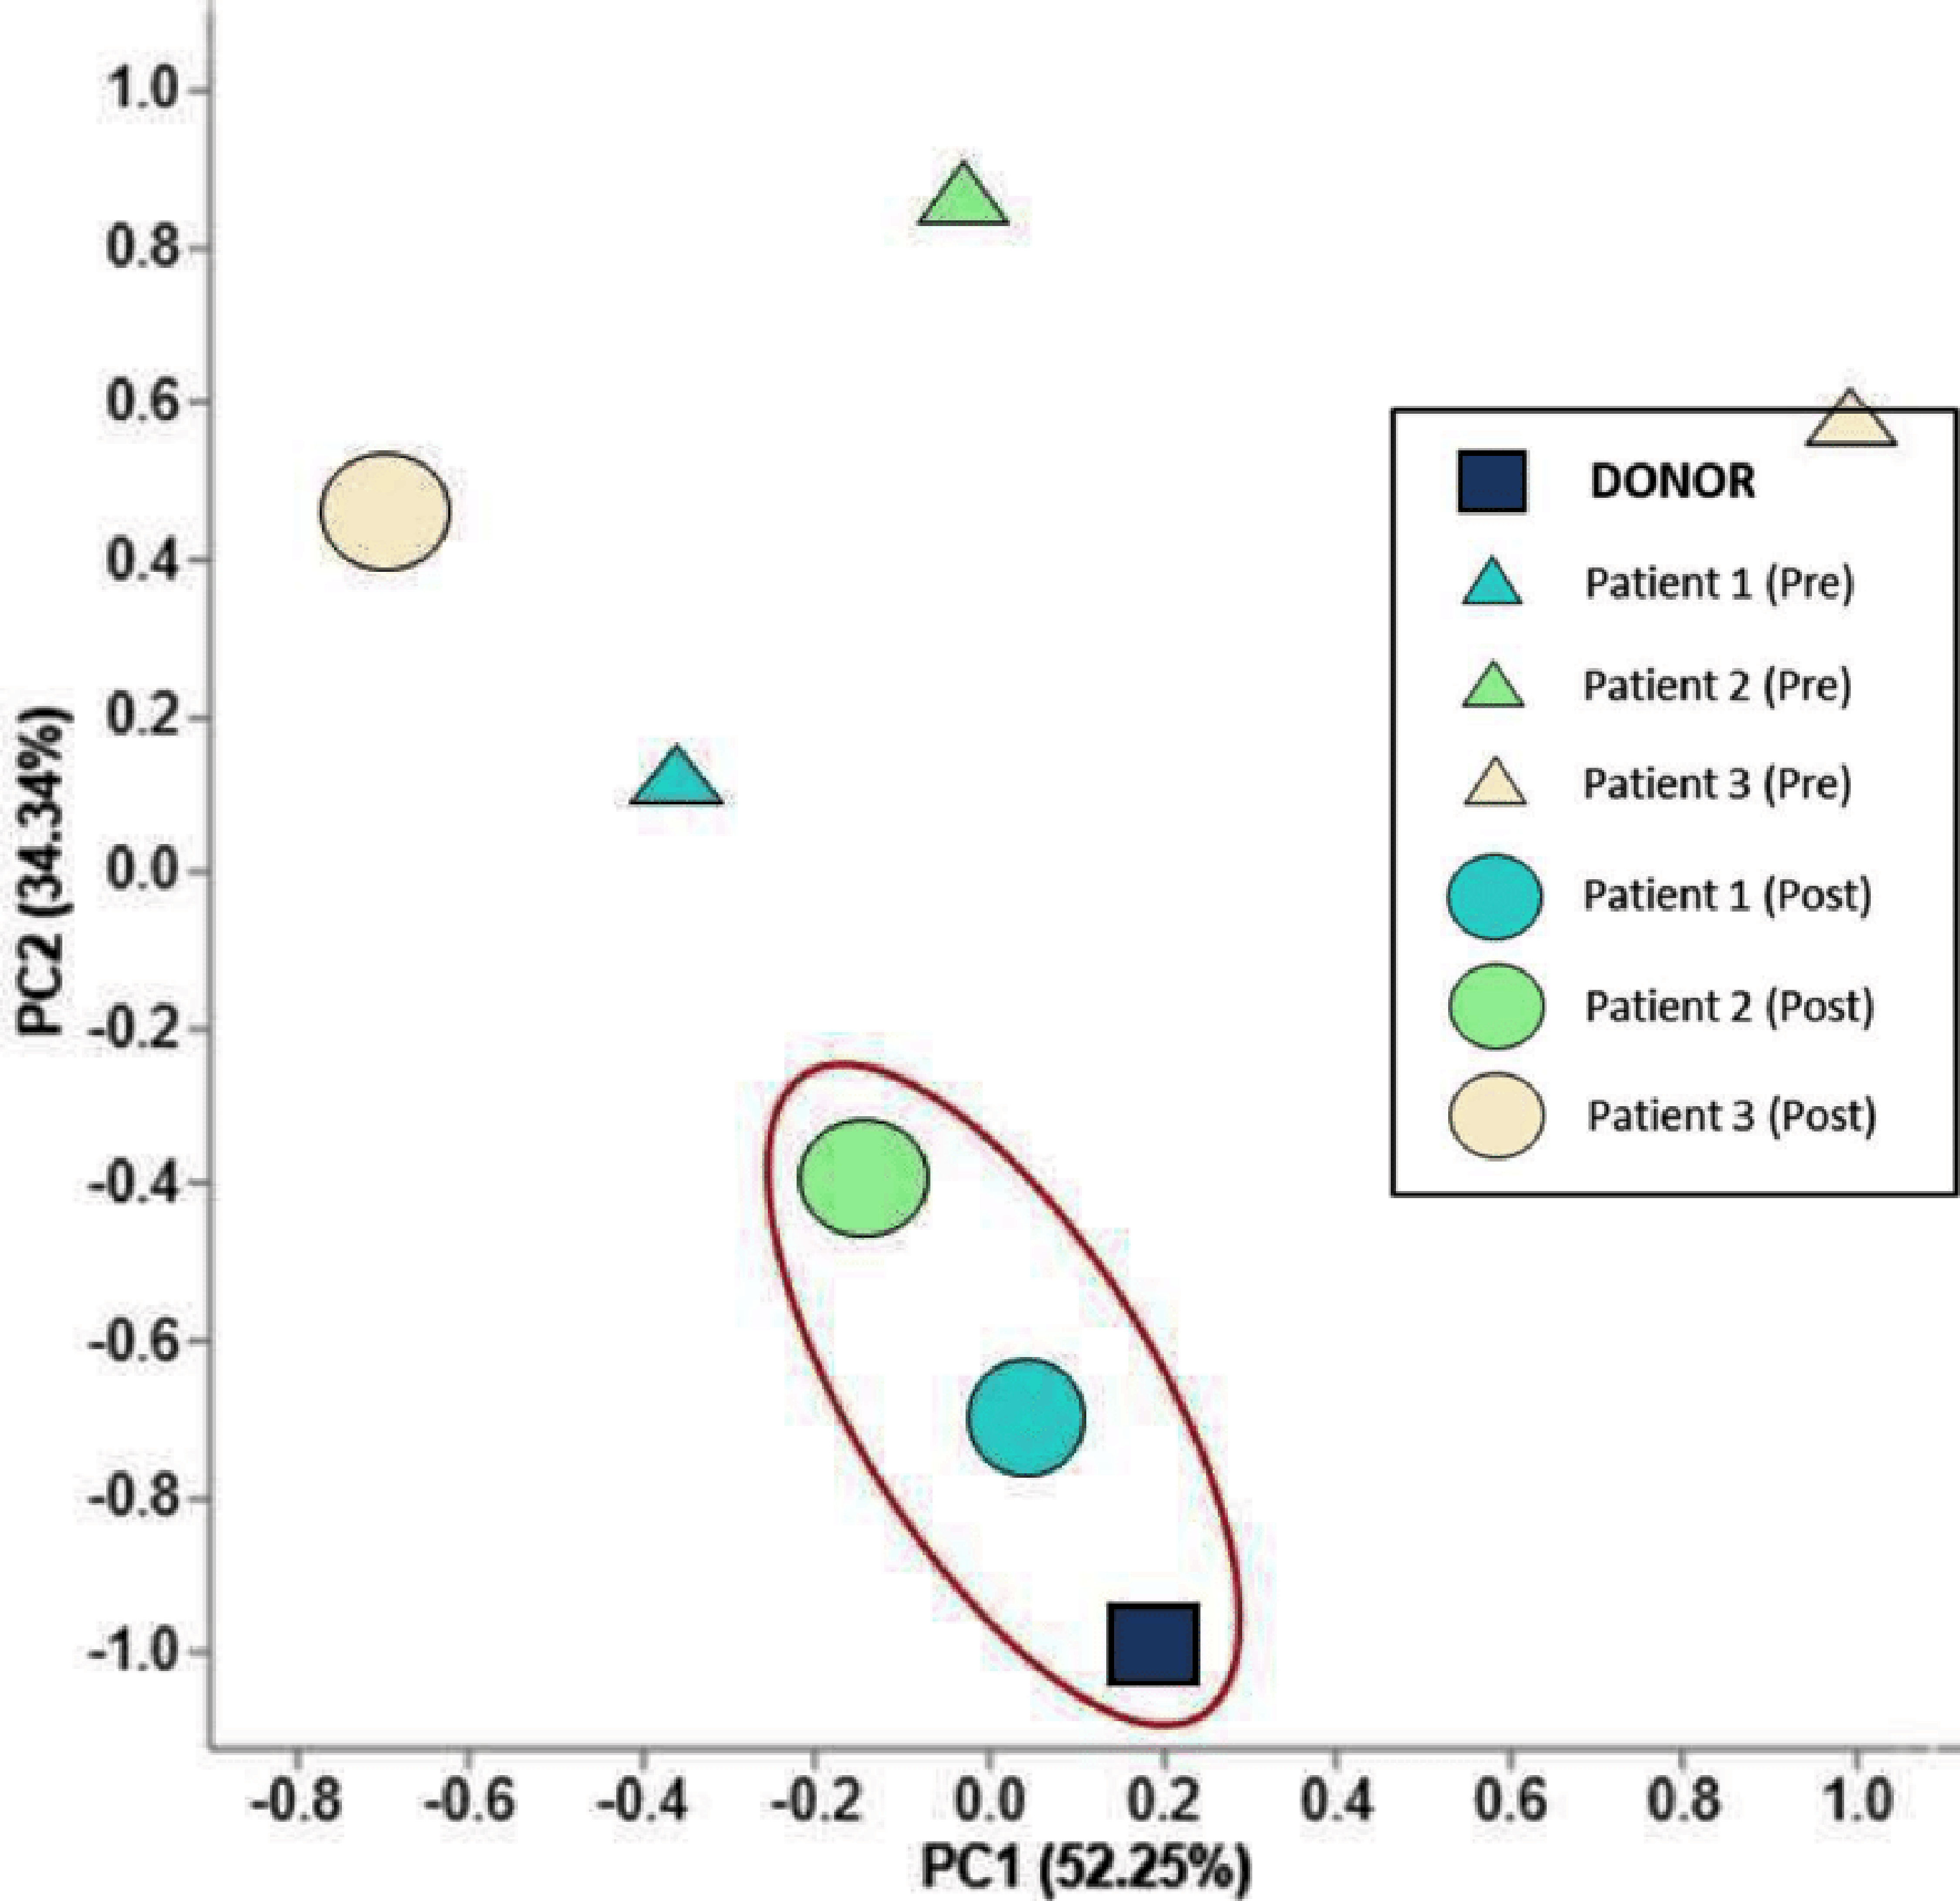
Figure 2. Principal component analysis (PCA) of the microbiota from the donor, pre-FMT patients, and post-FMT patients. Axes are labeled with the percent of variance they explain. Triangles represent pre-FMT, circles represent post-FMT, and the square represents FMT donor. PC1 captures 52.25% of the variation and elucidates the shift of the two successful FMTs compared to their microbiota prior to engraftment. Samples circled in red highlight the patient similarity following successful FMTs with that of donor stool.
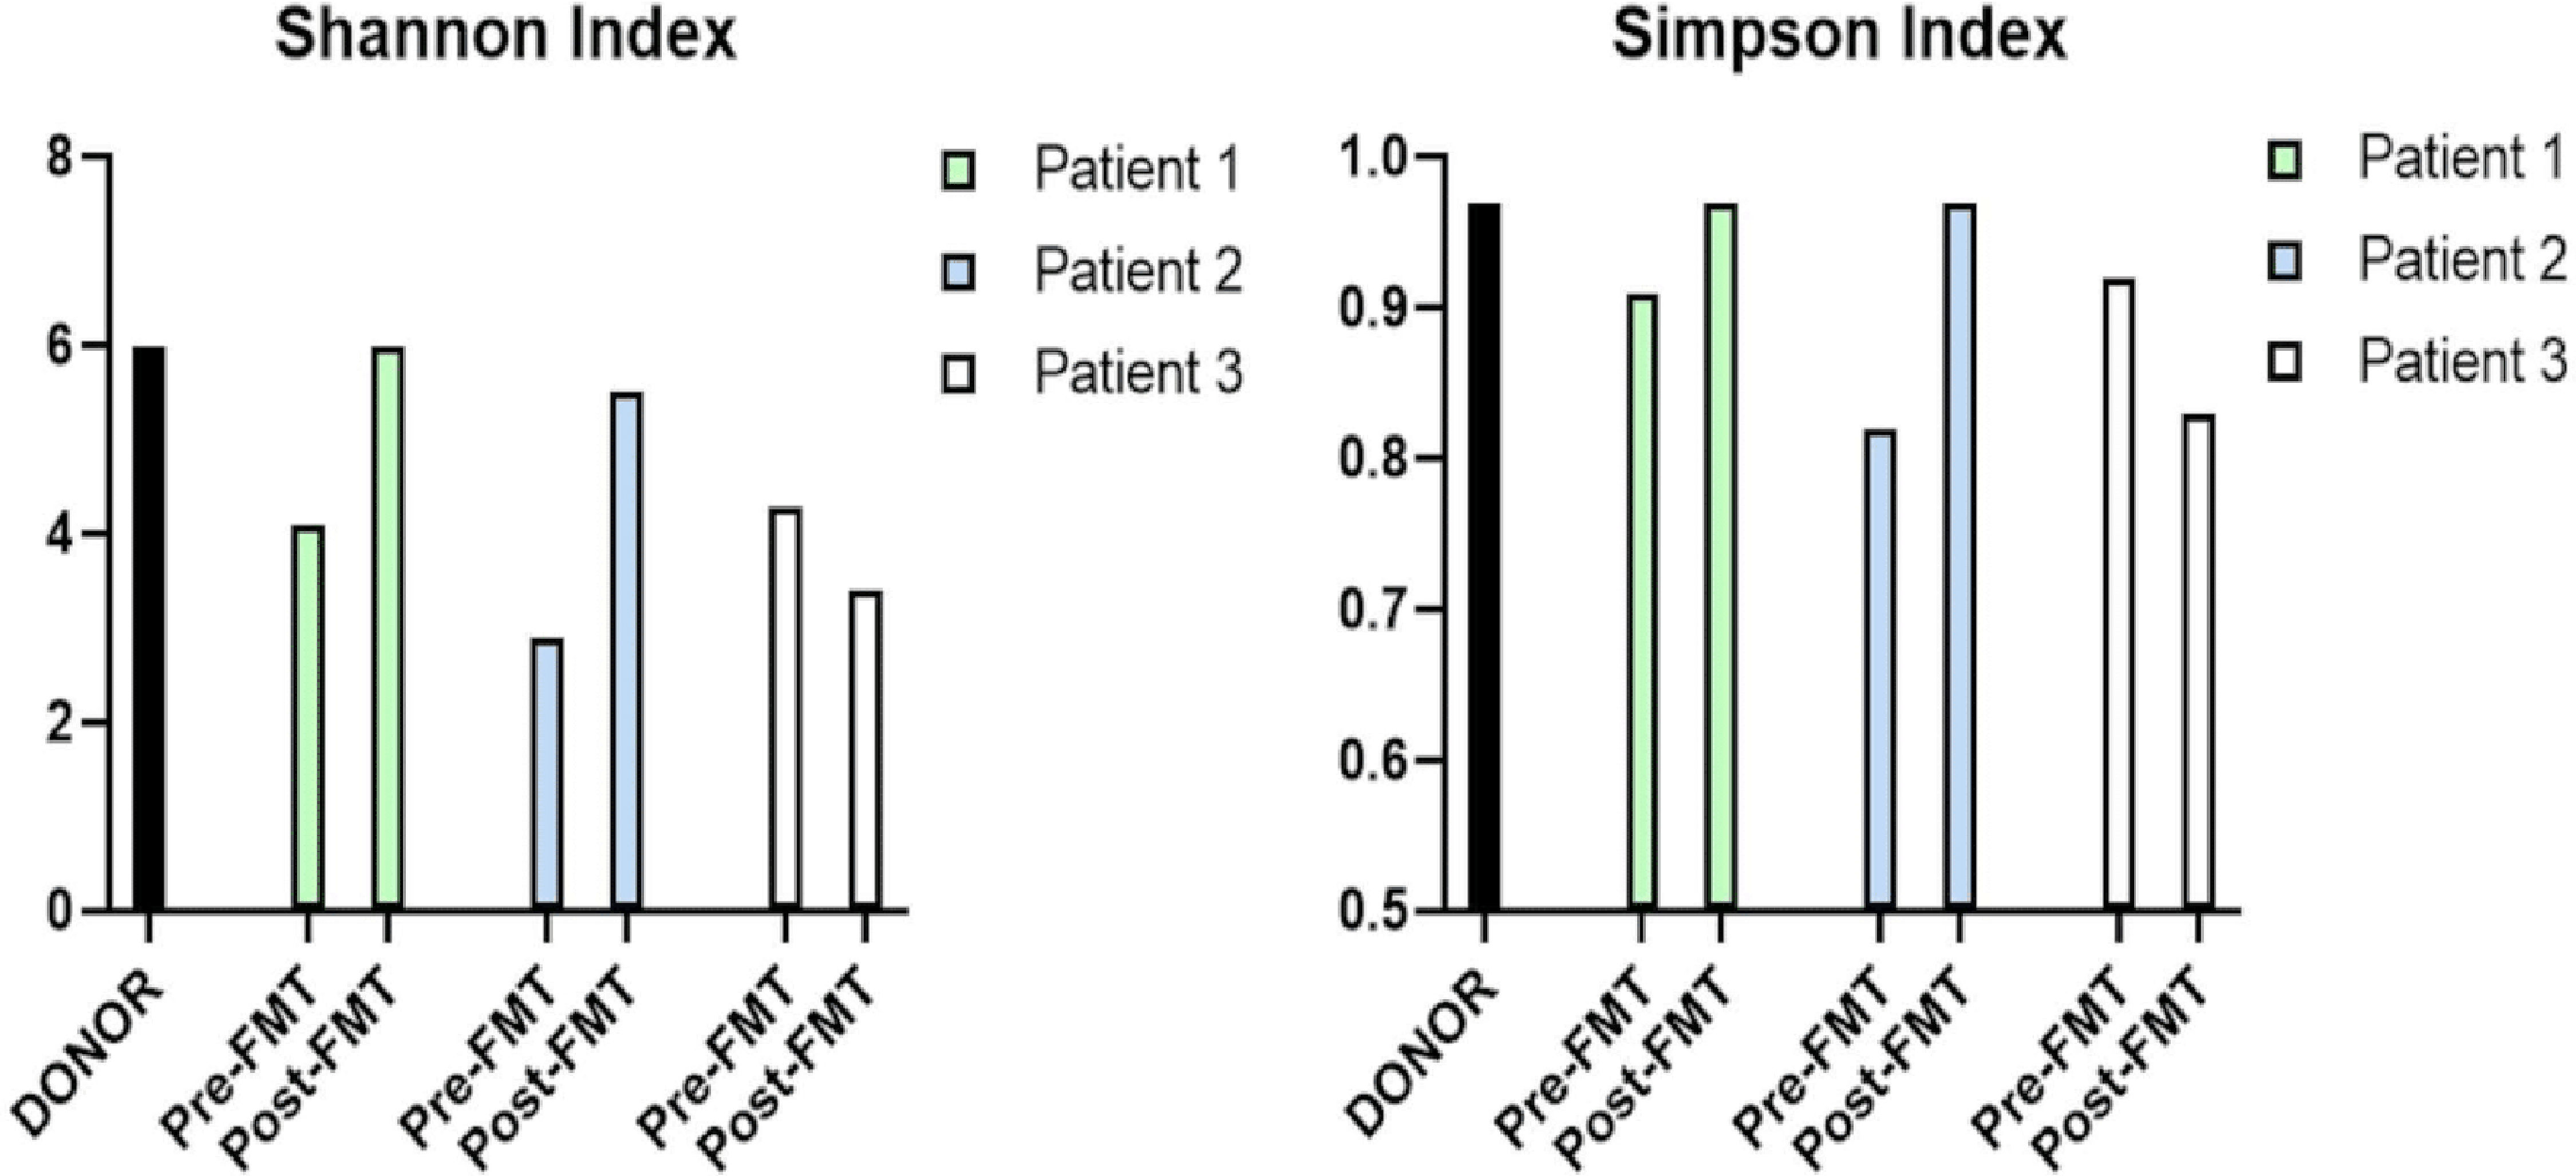
Figure 3. Alpha diversity of the microbiota from the donor, pre-FMT and post-FMT samples for the Shannon and Simpson indexes. Both indexes for patients (Pts.) 1 and 2 match their donor’s, whereas Pt. 3 does not, indicative of an unsuccessful engraftment. The Shannon index of the donor, Pt. 1, Pt. 2, and Pt. 3 following FMT were 6.0, 6.0, 5.5, and 3.4, respectively. The patients matched pre-FMTs Shannon indexes were 4.1, 2.9, and 4.3, respectively. The Simpson index of the donor, Pt. 1, Pt. 2, and Pt. 3 post-FMT were 0.89, 0.89, 0.84, and 0.72, respectively. The patients matched pre-FMTs Simpson indexes were 0.91, 0.82, and 0.92. FMT: fecal microbiota transplantation.
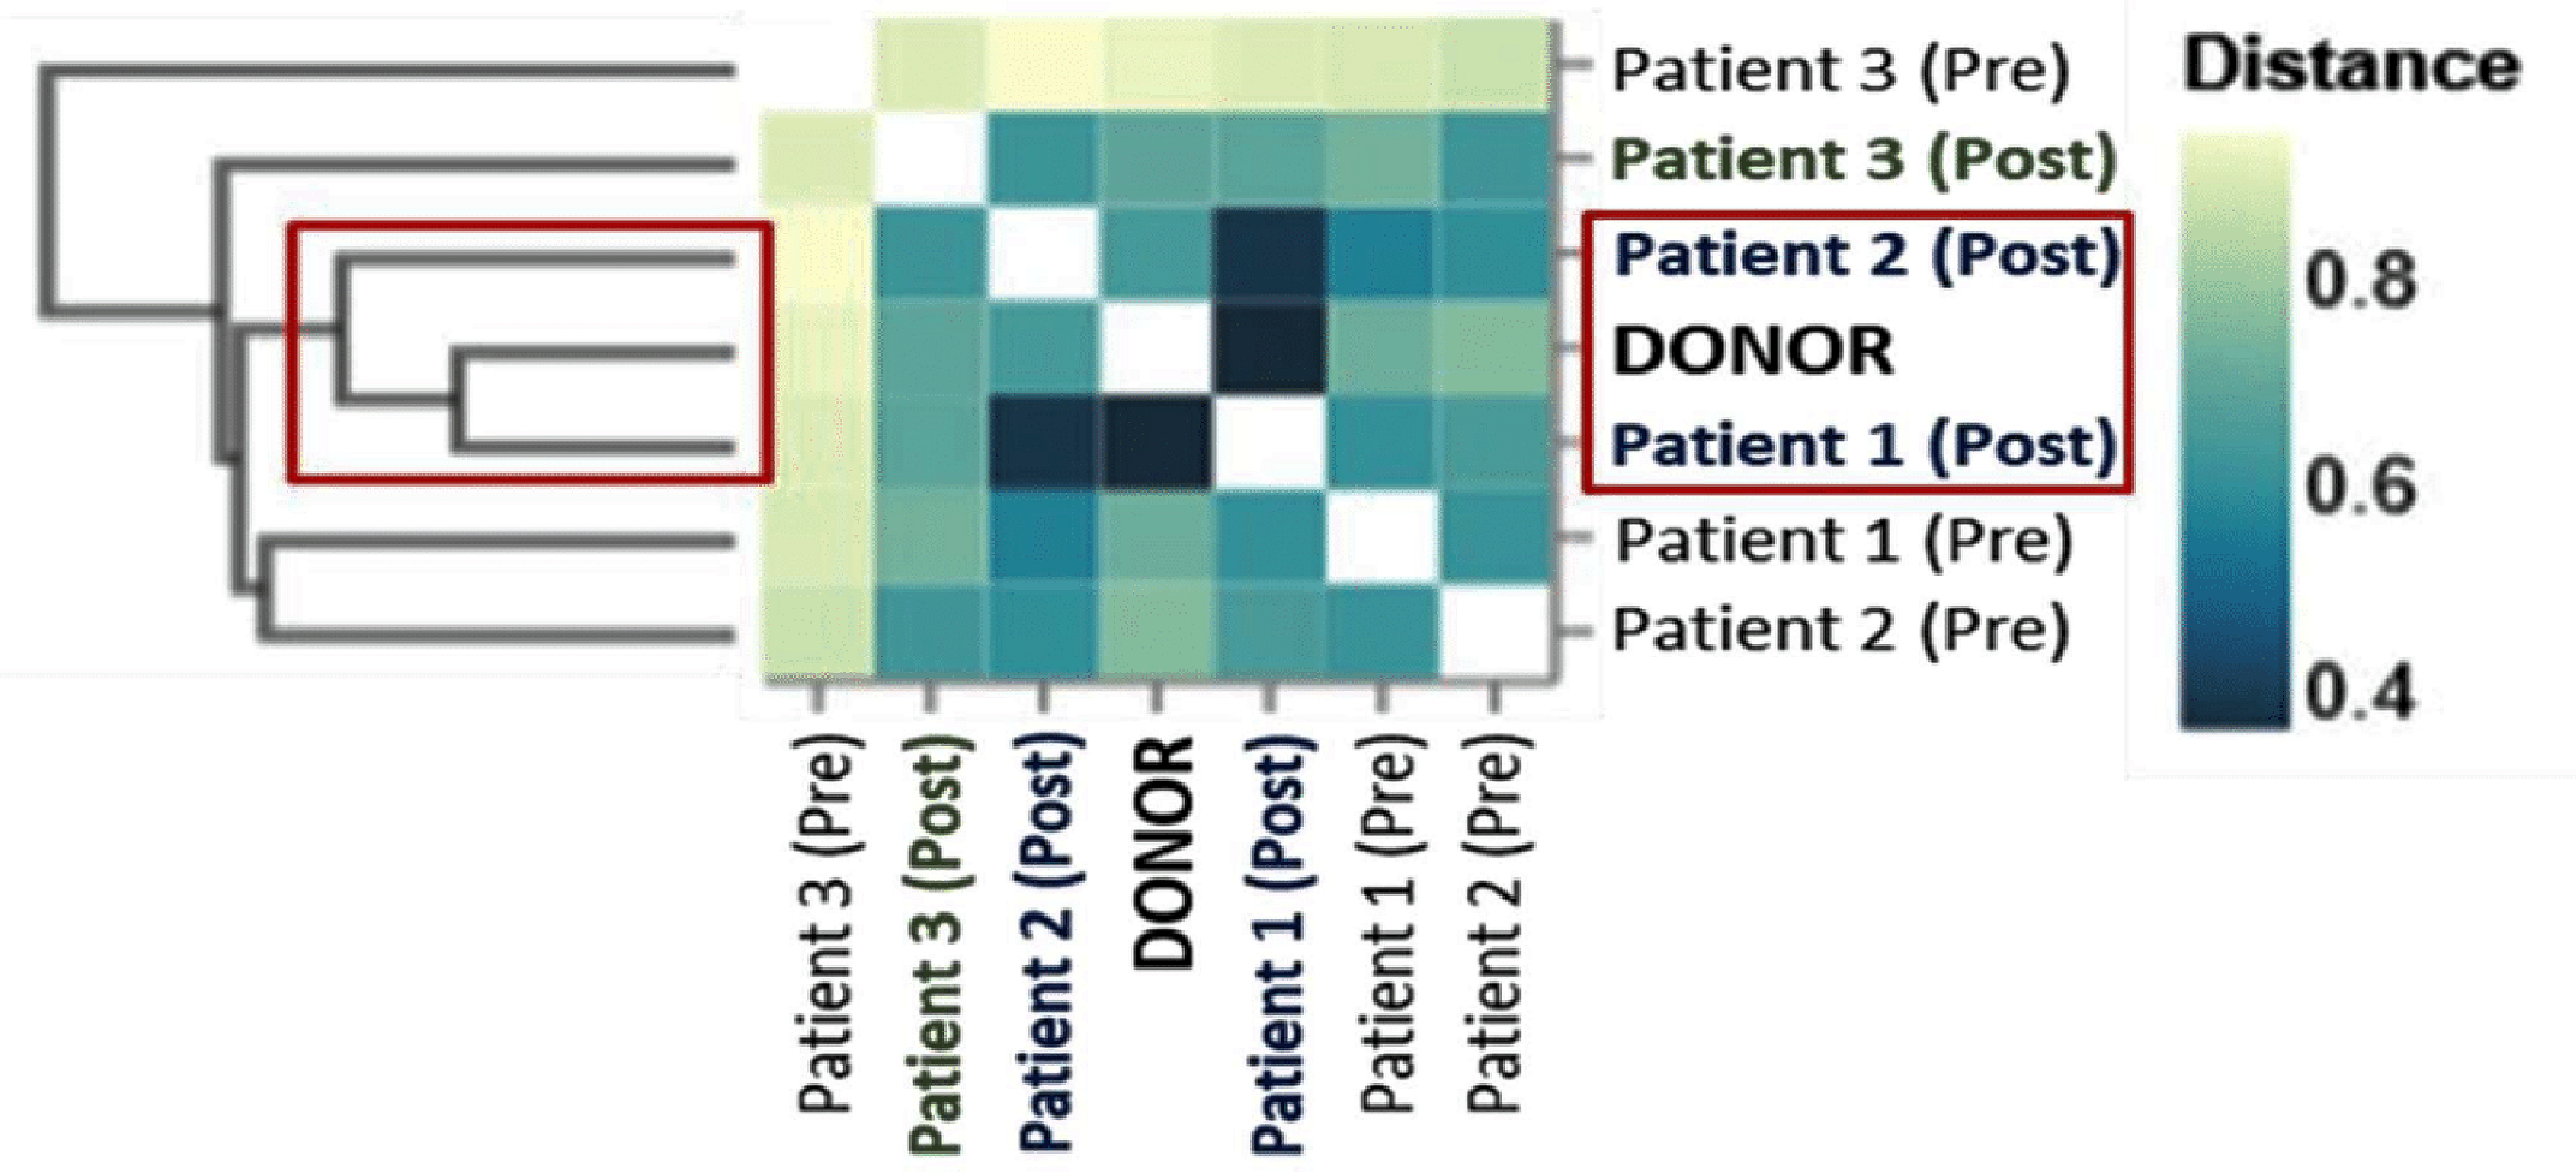
Figure 4. Bray-Curtis distance matrix of the microbiota from donor, pre-FMT and post-FMT samples. The ordination plots are based on the bacterial profiles for each. The Bray-Curtis matrix identifies the similarity of patients (Pts.) 1 and 2 after fecal microbiota transplantation (FMT) with that of the donor (dark blue squares), clustering in distinct coordinates of the matrix. It also identifies that Pt. 3’s ordination is the most dissimilar of the three post-FMT samples. This provides insight that Pt. 3 may have had an unsuccessful FMT, whereas Pts. 1 and 2 are more likely to have had successful engraftments.