Gastroenterology Research, ISSN 1918-2805 print, 1918-2813 online, Open Access
Article copyright, the authors; Journal compilation copyright, Gastroenterol Res and Elmer Press Inc
Journal website https://www.gastrores.org

Original Article

Volume 14, Number 4, August 2021, pages 220-226


Usefulness of the Eosinophilic Esophagitis Histologic Scoring System in Distinguishing Active Eosinophilic Esophagitis From Remission and Gastroesophageal Reflux Disease

Figures

Figure 1.
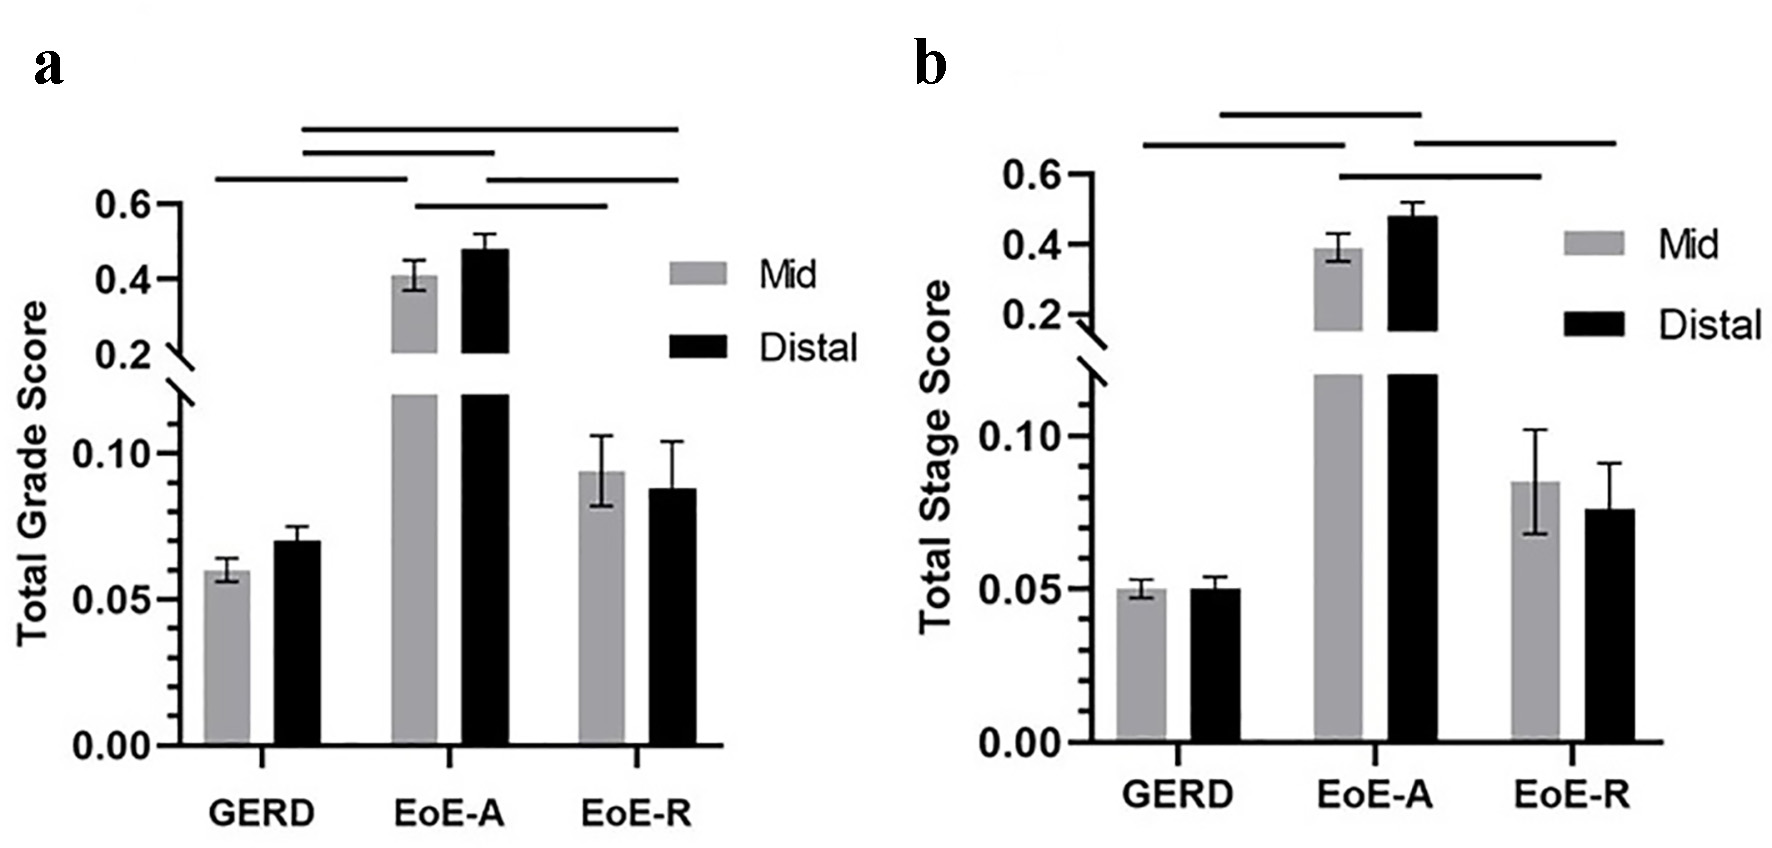
Figure 1. Total grade scores (a) and total stage scores (b) in patients with gastroesophageal reflux disease (GERD), active eosinophilic esophagitis (EoE-A) and eosinophilic esophagitis in remission (EoE-R) in distal and mid esophagus. Horizontal lines above the bars show the groups that were compared and had a significant difference (P < 0.05).
Figure 2.
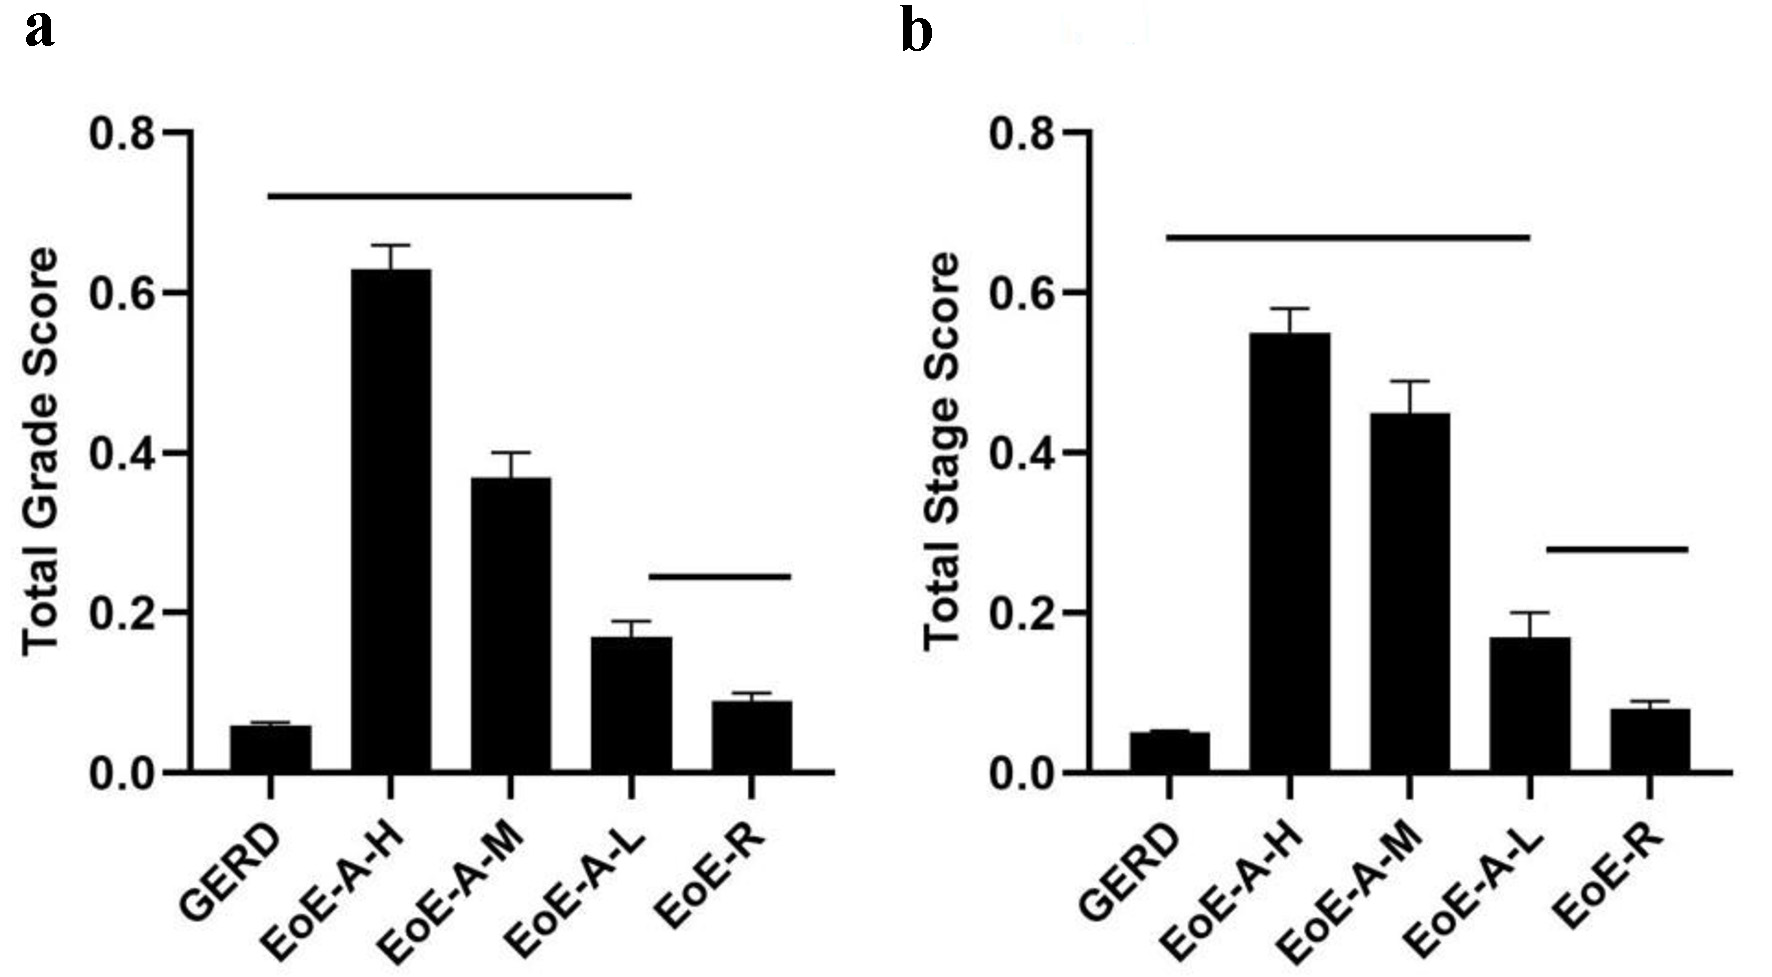
Figure 2. Total grade scores (a) and total stage scores (b) in patients with gastroesophageal reflux disease (GERD), active eosinophilic esophagitis (EoE-A) relative to PEC (high (EoE-A-H), moderate (EoE-A-M), low (EoE-A-L)) and eosinophilic esophagitis in remission (EoE-R). Horizontal lines above the bars show the groups that were compared and had a significant difference (P < 0.05).
Figure 3.
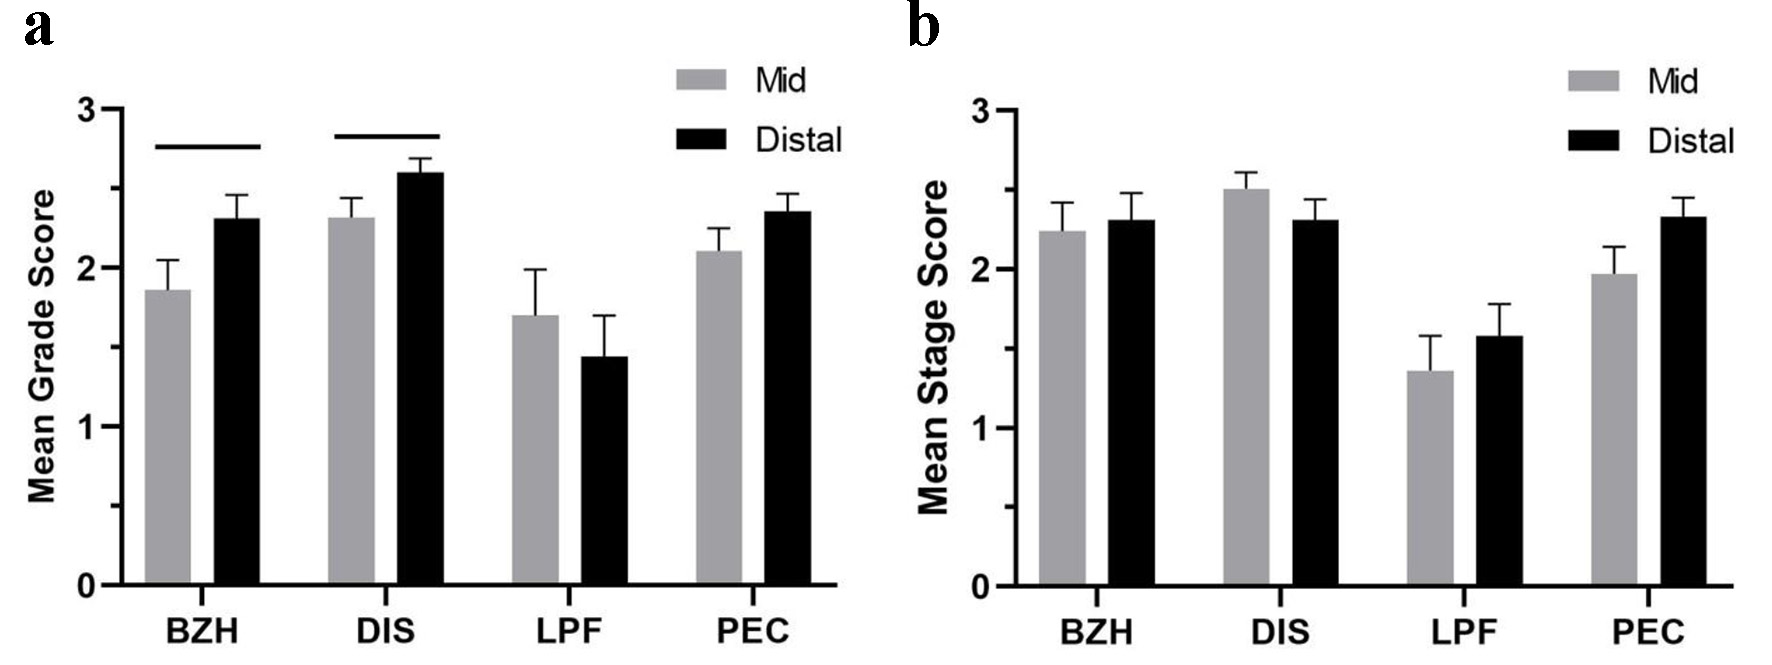
Figure 3. Mean grade scores (a) and mean stage scores (b) of basal zone hyperplasia (BZH), dilated intercellular space (DIS), lamina propria fibrosis (LPF) and peak eosinophil count (PEC) in mid and distal esophagus of patients with EoE-A. Horizontal lines above the bars show the groups that were compared and had a significant difference (P < 0.05).

Tables

Table 1. Characteristics of Patients With GERD, EoE-A and EoE-R
 
Patient groups
GERD (n = 37)EoE-A (n = 36)EoE-R (n = 12)
hpf: high-power field; PEC: peak eosinophil count; SEM: standard error of mean; GERD: gastroesophageal reflux disease; EoE-A: active eosinophilic esophagitis; EoE-R: eosinophilic esophagitis in remission.
Age, median (range), years11 (1 - 21)9.5 (1 - 20)10.5 (2 - 21)
Gender
  Male212910
  Female1672
PEC/hpf, mean ± 1 SEM0.5 ± 0.2466 ± 6.71.5 ± 0.7


Table 2. Mean Grade and Stage Scores of Histologic Features of Patients With GERD, EoE-A and EoE-R
 
Histologic featurePatient groups
GERD (n = 37)EoE-A (n = 36)EoE-R (n = 12)
GradeStageGradeStageGradeStage
Data are expressed as mean ± 1 SEM. hpf: high-power field; SEM: standard error of mean; GERD: gastroesophageal reflux disease; EoE-A: active eosinophilic esophagitis; EoE-R: eosinophilic esophagitis in remission.
Peak eosinophil count/hpf1 ± 002.2 ± 0.092.2 ± 0.111 ± 00
Basal zone hyperplasia0.0 ± 0.030.1 ± 0.032.1 ± 0.122.3 ± 0.130.25 ± 0.090.5 ± 0.18
Eosinophil abscesses000.8 ± 0.130.8 ± 0.1200
Eosinophil surface layering000.8 ± 0.130.8 ± 0.1200
Dilated intercellular spaces1.1 ± 0.041 ± 02.5 ± 0.072.4 ± 0.081.3 ± 0.091.1 ± 0.06
Surface epithelial alteration000.8 ± 0.140.8 ± 0.1300
Dyskeratotic epithelial cells000.1 ± 0.040.04 ± 0.0200
Lamina propria fibrosis0.1 ± 0.040.2 ± 0.121.6 ± 0.161.5 ± 0.150.5 ± 0.11 ± 0.58


Table 3. Grade and Stage Scores of Histologic Features for Mid and Distal Esophageal Regions in EoE-A Patients
 
Distal = MidDistal > MidDistal < Mid
Data are expressed as n (%). EoE-A: active eosinophilic esophagitis.
Grade score18 (50%)12 (33.3%)6 (16.7%)
Stage score16 (44.4%)12 (33.3%)8 (22.2%)