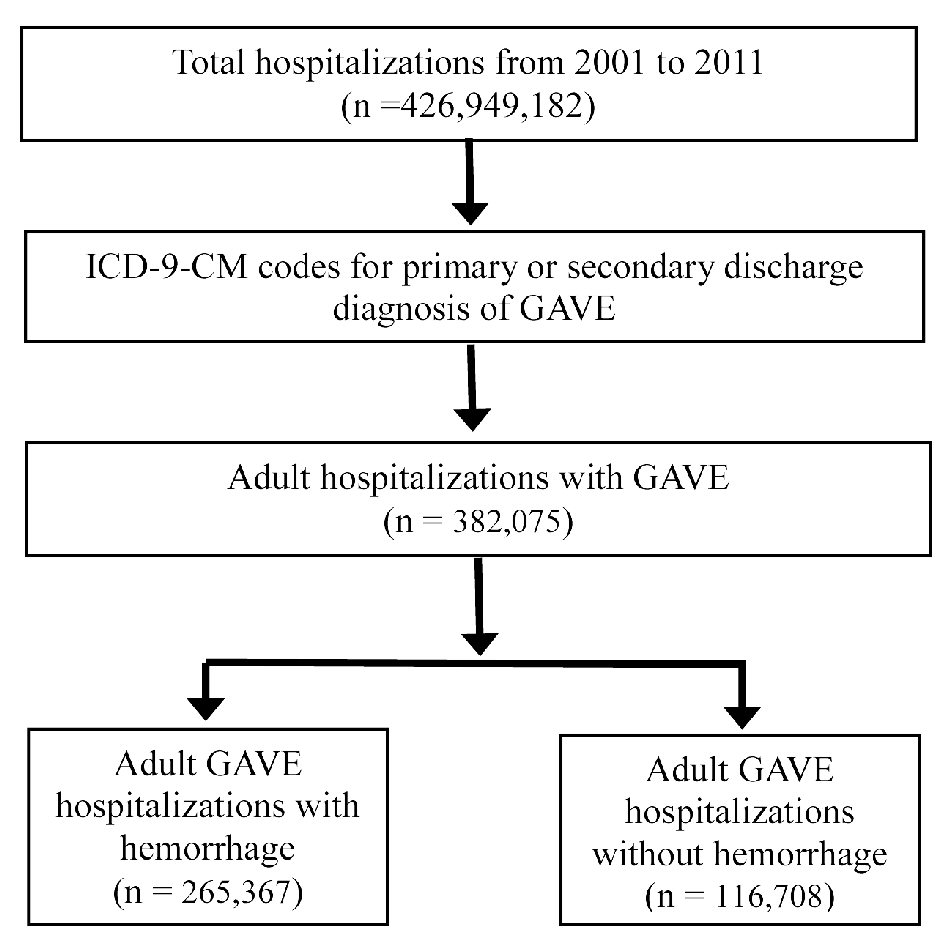
Figure 1. Sequential derivation of the study population for GAVE hospitalizations from 2001 to 2011. GAVE: gastric antral vascular ectasia; ICD-9-CM: International Classification of Diseases, Ninth Revision, Clinical Modification.
| Gastroenterology Research, ISSN 1918-2805 print, 1918-2813 online, Open Access |
| Article copyright, the authors; Journal compilation copyright, Gastroenterol Res and Elmer Press Inc |
| Journal website https://www.gastrores.org |
Original Article
Volume 14, Number 2, April 2021, pages 104-111
Gastric Antral Vascular Ectasia: Trends of Hospitalizations, Biodemographic Characteristics, and Outcomes With Watermelon Stomach
Figures
Tables
| 2001 | 2002 | 2003 | 2004 | 2005 | 2006 | 2007 | 2008 | 2009 | 2010 | 2011 | P value | |
|---|---|---|---|---|---|---|---|---|---|---|---|---|
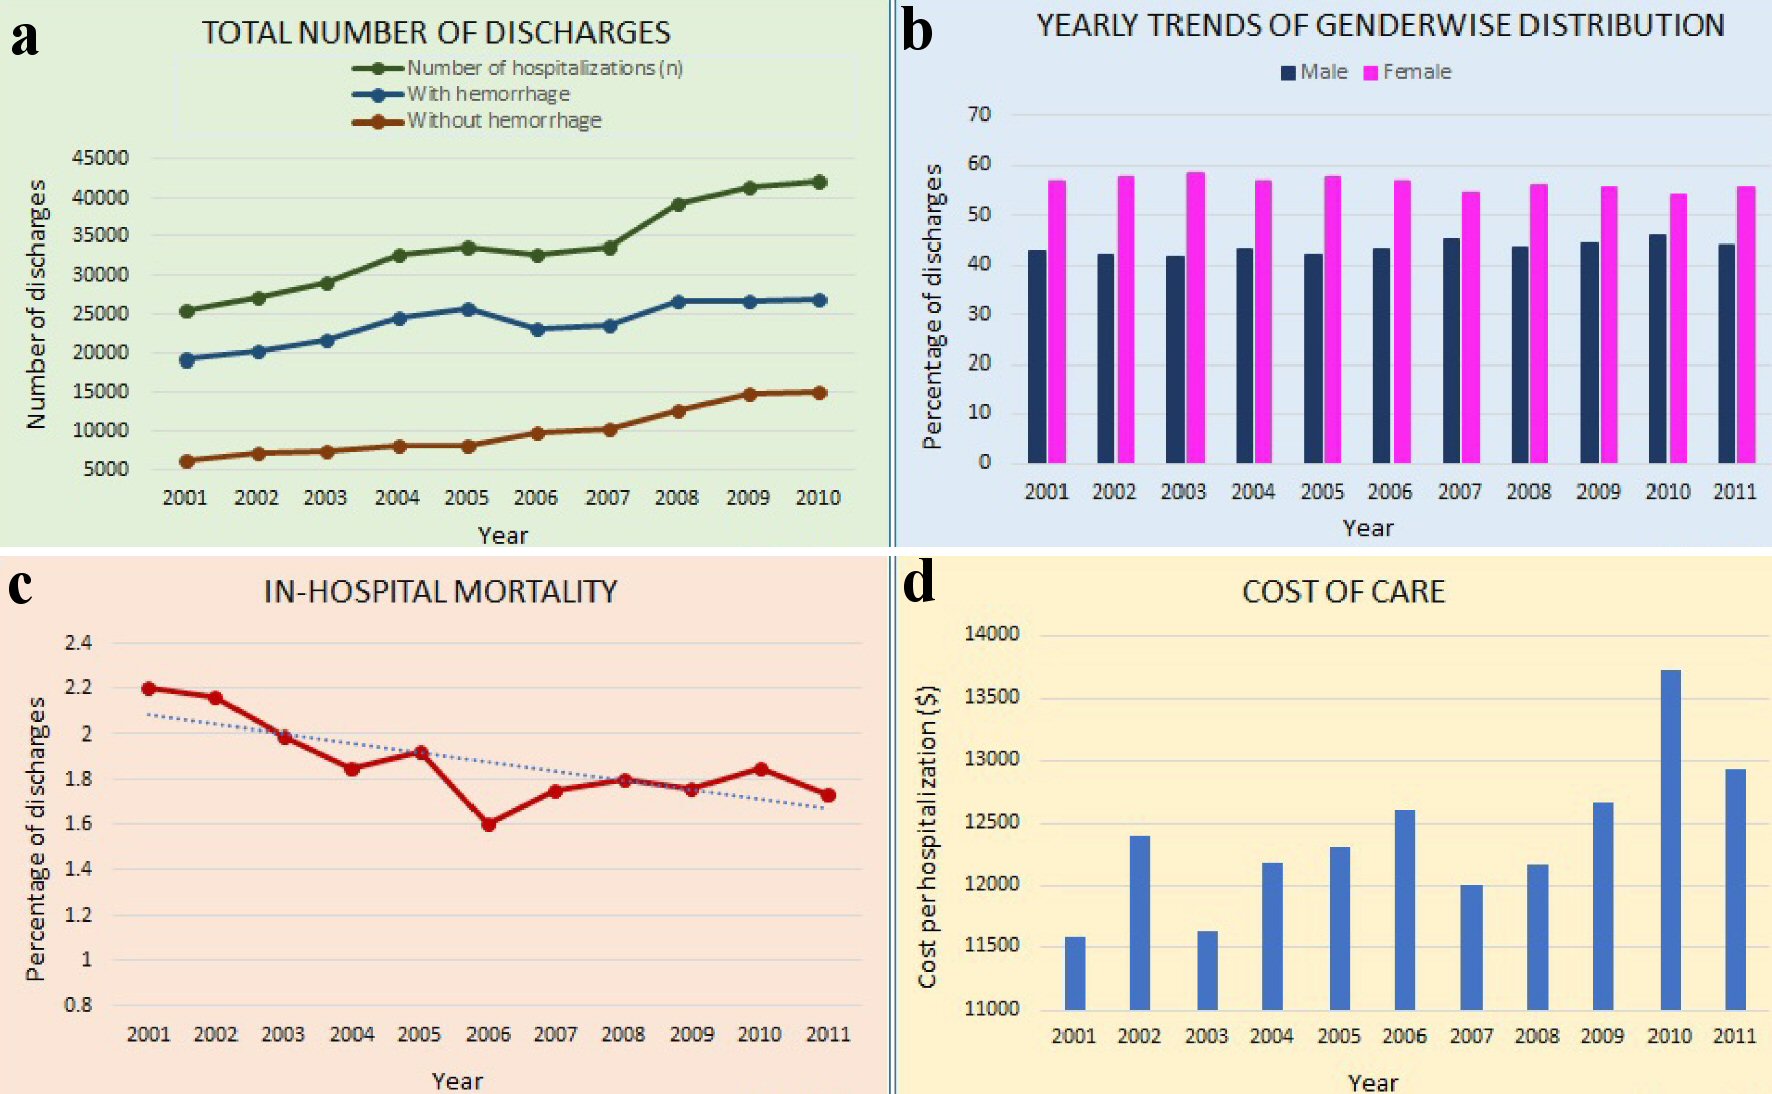
| Number of hospitalizations | 25,423 | 27,218 | 28,978 | 32,799 | 33,724 | 32,773 | 33,669 | 39,278 | 41,390 | 42,036 | 44,787 | < 0.0001 |
| With hemorrhage | 19,168 | 20,115 | 21,594 | 24,616 | 25,619 | 23,032 | 23,505 | 26,587 | 26,581 | 26,872 | 27,679 | < 0.0001 |
| Without hemorrhage | 6,255 | 7,103 | 7,384 | 8,183 | 8,105 | 9,742 | 10,165 | 12,690 | 14,809 | 15,164 | 17,108 | < 0.0001 |
| Age in years (%) | ||||||||||||
| 18 - 34 | 0.54 | 0.59 | 0.5 | 0.5 | 0.49 | 0.51 | 0.5 | 0.67 | 0.57 | 0.66 | 0.72 | < 0.0001 |
| 35 - 49 | 3.08 | 3.33 | 2.81 | 3.34 | 2.94 | 3.4 | 3.01 | 2.98 | 3.47 | 3.3 | 3.18 | 0.035 |
| 50 - 64 | 11.19 | 12.28 | 12.78 | 12.78 | 14.03 | 14.05 | 14.58 | 15.8 | 16.11 | 18.24 | 17.64 | < 0.0001 |
| 65 - 79 | 44.99 | 46.23 | 47.01 | 45.69 | 44.89 | 44.14 | 44.08 | 42.33 | 43.29 | 42.3 | 41.7 | < 0.0001 |
| ≥ 80 | 40.03 | 37.52 | 36.83 | 37.66 | 37.56 | 37.85 | 37.8 | 38.17 | 36.49 | 35.45 | 36.71 | < 0.0001 |
| Gender (%) | ||||||||||||
| Male | 43.1 | 42.22 | 41.68 | 43.17 | 42.21 | 43.19 | 45.14 | 43.75 | 44.35 | 45.8 | 44 | < 0.0001 |
| Female | 56.9 | 57.78 | 58.32 | 56.82 | 57.78 | 56.81 | 54.83 | 56.25 | 55.64 | 54.18 | 55.99 | |
| Race (%) | ||||||||||||
| White | 58.19 | 54.46 | 54.31 | 56.7 | 58.81 | 57.67 | 52.88 | 59.97 | 62.66 | 64.57 | 65.92 | < 0.0001 |
| Black | 10.86 | 11.67 | 13.21 | 12.72 | 9.65 | 11.7 | 12.61 | 12.57 | 12.8 | 15.41 | 14.47 | < 0.0001 |
| Hispanic | 5.38 | 5.9 | 6.52 | 4.71 | 4.67 | 6.62 | 5.4 | 5.86 | 7.1 | 7.36 | 7.58 | < 0.0001 |
| Others | 1.98 | 2.47 | 2.32 | 2.14 | 2.32 | 2.77 | 2.54 | 3.08 | 3.31 | 3 | 2.92 | < 0.0001 |
| Hospital region (%) | ||||||||||||
| Northeast | 21.55 | 22.55 | 21.34 | 21.62 | 21.88 | 22.29 | 18.95 | 20.38 | 21.1 | 20.64 | 20.11 | < 0.0001 |
| Midwest | 23.14 | 22.18 | 25.86 | 23.75 | 22.75 | 24.27 | 26.98 | 24.46 | 25.33 | 25.61 | 25.35 | < 0.0001 |
| South | 40.95 | 37.37 | 38.35 | 40.14 | 39.39 | 36.97 | 39.47 | 40.83 | 39.1 | 39.51 | 40.12 | 0.0002 |
| West | 14.36 | 17.89 | 14.45 | 14.49 | 15.98 | 16.47 | 14.61 | 14.33 | 14.48 | 14.24 | 14.42 | < 0.0001 |
| Hospital location (%) | ||||||||||||
| Rural | 9.99 | 10.74 | 12.13 | 7.93 | 8.63 | 7.33 | 8.77 | 7.97 | 7.39 | 8.59 | 7.07 | < 0.0001 |
| Urban nonteaching | 48.94 | 49.47 | 45.97 | 51.83 | 55.34 | 49.7 | 49.34 | 49.9 | 47.75 | 47.68 | 46.01 | < 0.0001 |
| Urban teaching | 41.06 | 39.79 | 41.87 | 40.23 | 36.03 | 42.6 | 41.52 | 42.13 | 43.63 | 42.96 | 46.24 | < 0.0001 |
| Median household income (%) | ||||||||||||
| Quartile 1 | 7.72 | 5.05 | 28.17 | 26.95 | 26.25 | 25.98 | 28.29 | 27.03 | 27.28 | 28 | 29.1 | < 0.0001 |
| Quartile 2 | 23.74 | 19.6 | 26.08 | 26.14 | 25.13 | 24.83 | 24.96 | 28.71 | 25.8 | 26.29 | 23.74 | < 0.0001 |
| Quartile 3 | 27 | 24.42 | 24.68 | 22.62 | 25.79 | 23.99 | 23.56 | 21.89 | 24.26 | 23.66 | 25.67 | < 0.0001 |
| Quartile 4 | 40.47 | 48.64 | 19.1 | 22.59 | 21.31 | 23.42 | 21.37 | 20.94 | 20.75 | 20.02 | 19.9 | < 0.0001 |
| Mode of payment (%) | ||||||||||||
| Medicare | 81.85 | 81.19 | 82.88 | 81.3 | 81.72 | 81.43 | 80.74 | 77.62 | 77.65 | 77.56 | 79.09 | < 0.0001 |
| Medicaid | 3.44 | 4.1 | 4.04 | 3.71 | 3.7 | 3.91 | 3.46 | 4.11 | 4.76 | 5.33 | 4.65 | < 0.0001 |
| Private insurance | 12.25 | 12.58 | 10.66 | 12.68 | 12.15 | 11.85 | 13.33 | 15.31 | 14.27 | 14.01 | 13.07 | < 0.0001 |
| Others (includes self-pay) | 2.37 | 2.09 | 2.28 | 2.24 | 2.4 | 2.64 | 2.4 | 2.92 | 3.09 | 2.97 | 2.87 | < 0.0001 |
| Admission day (%) | 0.002 | |||||||||||
| Weekday | 81.38 | 80.44 | 81.07 | 81.14 | 80.38 | 81.23 | 80.6 | 80.18 | 80.62 | 81.11 | 80.15 | |
| Weekend | 18.62 | 19.56 | 18.93 | 18.86 | 19.62 | 18.77 | 19.4 | 19.82 | 19.38 | 18.89 | 19.85 | |
| Inpatient mortality (%) | 2.2 | 2.16 | 1.99 | 1.85 | 1.92 | 1.6 | 1.75 | 1.8 | 1.76 | 1.85 | 1.73 | < 0.0001 |
| Cost of care ($) | 11,590 | 12,394 | 11,636 | 12,190 | 12,313 | 12,609 | 12,012 | 12,179 | 12,659 | 13,724 | 12,930 | < 0.0001 |
| AHRQ comorbidity measures (%) | 2002 | 2003 | 2004 | 2005 | 2006 | 2007 | 2008 | 2009 | 2010 | 2011 | P value |
|---|---|---|---|---|---|---|---|---|---|---|---|
| AHRQ: Agency for Healthcare Research and Quality. | |||||||||||
| Obesity | 2.03 | 2.45 | 2.83 | 3.42 | 3.75 | 4.59 | 5.5 | 7.08 | 7.76 | 9.44 | < 0.0001 |
| Hypertension | 39.6 | 49.33 | 54.58 | 53.61 | 59.96 | 61.69 | 61.86 | 65.38 | 66.76 | 69.6 | < 0.0001 |
| Diabetes mellitus | 26.73 | 27.68 | 27.36 | 29.12 | 31.08 | 32.48 | 33.3 | 34.22 | 35.38 | 36.63 | < 0.0001 |
| Congestive heart failure | 21.76 | 22.8 | 24.29 | 25.46 | 24.85 | 25.54 | 23.35 | 24.38 | 24.35 | 25.44 | 0.0002 |
| Chronic obstructive pulmonary disease | 26.64 | 28.03 | 29.4 | 30.06 | 32.1 | 31.75 | 28.17 | 29.67 | 30.27 | 30.68 | < 0.0001 |
| Peripheral vascular disease | 8.23 | 8.68 | 9.47 | 9.85 | 10.17 | 11.93 | 13.1 | 13.27 | 14.11 | 14.74 | < 0.0001 |
| Renal failure | 24.31 | 26.16 | 28.97 | 31.9 | 38.97 | 42.36 | 42 | 46.32 | 47.88 | 50.87 | < 0.0001 |
| Neurological disorders | 7.02 | 6.08 | 7.16 | 6.36 | 7.32 | 8.18 | 9.07 | 9.34 | 9.21 | 10.38 | < 0.0001 |
| Anemia | 24.9 | 26.4 | 26.92 | 28.78 | 30.66 | 30.94 | 34.18 | 35.75 | 36.42 | 38.96 | < 0.0001 |
| Solid tumor without metastasis | 9.63 | 2.04 | 2.2 | 1.94 | 2.13 | 2.65 | 2.35 | 2.63 | 2.72 | 3.05 | < 0.0001 |
| Weight loss | 2.33 | 2.36 | 2.94 | 3.42 | 4.27 | 3.68 | 4.92 | 5.35 | 7.17 | 7.96 | < 0.0001 |
| Rheumatic disorders | 2.66 | 2.64 | 3.39 | 3.41 | 3.84 | 4.2 | 3.89 | 4.64 | 4.31 | 4.62 | < 0.0001 |
| Psychiatric disorders | 6.24 | 6.6 | 7.07 | 8.3 | 9.95 | 9.75 | 11.69 | 12.17 | 13.21 | 15.74 | < 0.0001 |
| Liver disease | 6.2 | 6.7 | 7.04 | 7.19 | 7.35 | 8.03 | 9.5 | 10.72 | 12.04 | 13.37 | < 0.0001 |
| Characteristics | Odds ratio | 95% confidence interval | P value |
|---|---|---|---|
| HMO: Health Maintenance Organization. | |||
| Hemorrhage | 1.27 | 1.10 - 1.46 | 0.001 |
| Elixhauser comorbidity index (every 1-point increase) | 1.18 | 1.14 - 1. 22 | < 0.0001 |
| Age (years) | |||
| 18 - 44 | Reference | ||
| 45 - 64 | 1.05 | 0.62 - 1.78 | 0.84 |
| 65 - 84 | 1.17 | 0.69 - 1.97 | 0.57 |
| ≥ 85 | 1.46 | 0.85 - 2.50 | 0.17 |
| Gender | |||
| Male | Reference | ||
| Female | 0.841 | 0.745 - 0.951 | 0.0055 |
| Race | |||
| White | Reference | ||
| Black | 0.88 | 0.73 - 1.06 | 0.17 |
| Hispanic | 1.25 | 1.01 - 1.55 | 0.04 |
| Others | 1.30 | 0.96 - 1.75 | 0.09 |
| Hospital bed size | |||
| Small | 0.92 | 0.75 - 1.13 | 0.44 |
| Medium | 0.93 | 0.81 - 1.08 | 0.35 |
| Large | Reference | ||
| Hospital region | |||
| Northeast | Reference | ||
| Midwest | 0.89 | 0.73 - 1.08 | 0.22 |
| South | 0.99 | 0.84 - 1.16 | 0.91 |
| West | 1.06 | 0.88 - 1.28 | 0.55 |
| Hospital type (%) | |||
| Rural | 0.82 | 0.62 - 1.07 | 0.15 |
| Urban nonteaching | 0.89 | 0.78 - 1.01 | 0.07 |
| Teaching | Reference | ||
| Primary insurance (%) | |||
| Medicare/Medicaid | Reference | ||
| Private including HMO | 0.92 | 0.74 - 1.16 | 0.49 |
| Uninsured/self-pay | 0.93 | 0.60 - 1.46 | 0.76 |