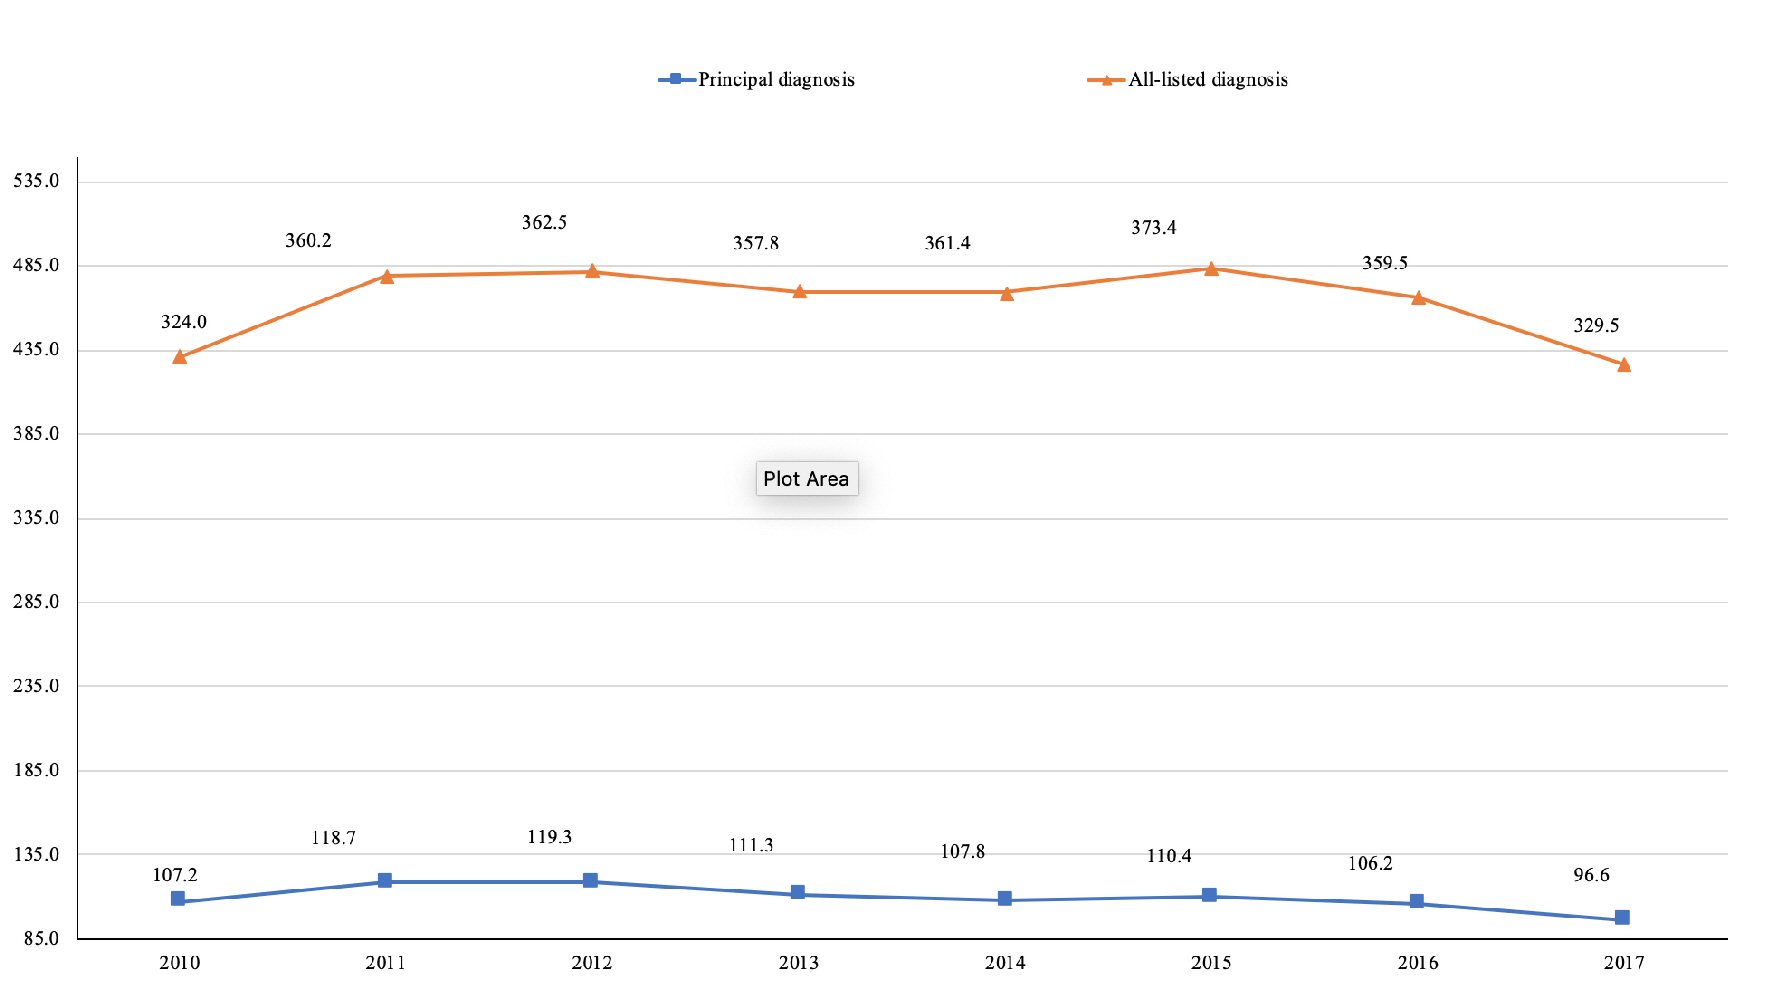
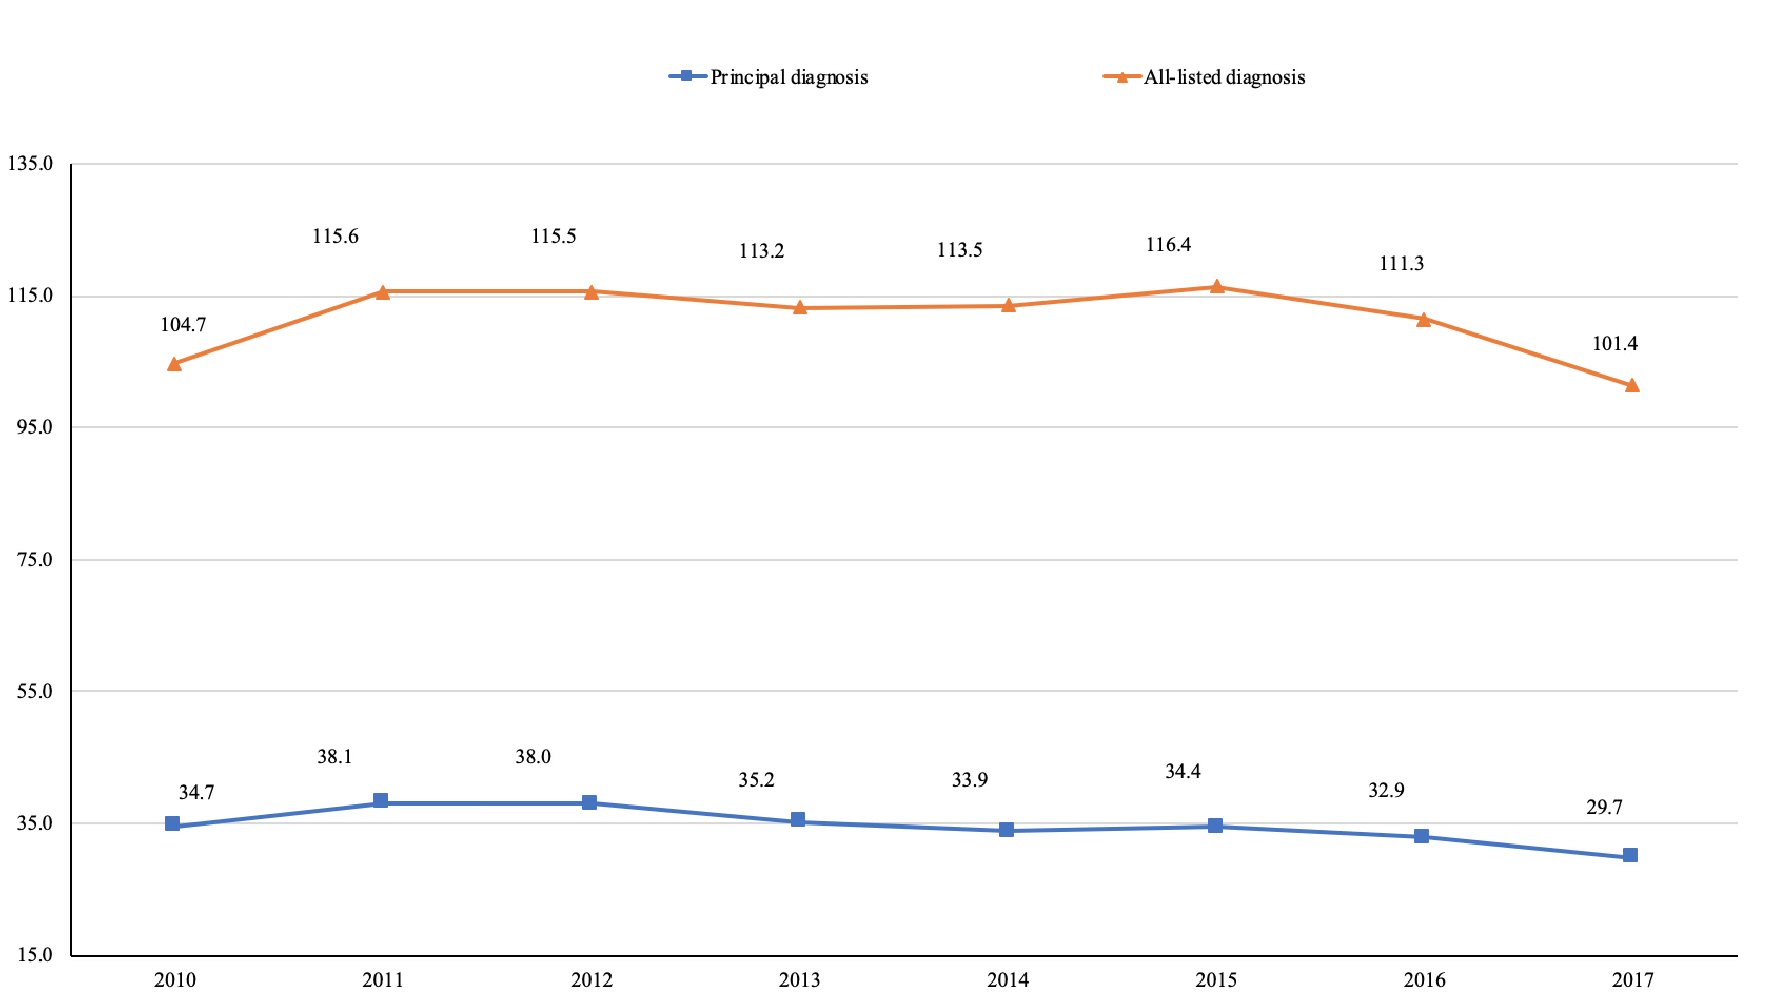
Figure 1. CDI hospitalization trends, 2010 - 2017. The number of hospitalizations with CDI as a principal or secondary diagnosis is depicted in the figure. CDI: Clostridium difficile infection.
| Gastroenterology Research, ISSN 1918-2805 print, 1918-2813 online, Open Access |
| Article copyright, the authors; Journal compilation copyright, Gastroenterol Res and Elmer Press Inc |
| Journal website https://www.gastrores.org |
Original Article
Volume 14, Number 2, April 2021, pages 87-95
Clostridium difficile Infection Hospitalizations in the United States: Insights From the 2017 National Inpatient Sample
Figures
Tables
| All CDI | Principal CDI | Secondary CDI | All other hospitalizations | |
|---|---|---|---|---|
| The rates of hospitalizations with CDI as the principal diagnosis, secondary diagnosis, and all (principal plus secondary) diagnosis are compared with hospitalizations rates for hospitalizations due to all other causes. CDI: Clostridium difficile infection. | ||||
| Number of hospitalizations | 329,460 (0.9% of all stays) | 96,585 (29.3% of all CDI stays) | 232,875 (70.7% of all CDI stays) | 35,470,000 |
| Mean age (years) | 64.7 | 64.4 | 64.8 | 49.4 |
| Female patients (%) | 57.1 | 63.7 | 54.4 | 56.4 |
| Insurance status (%) | ||||
| Medicare | 65.6 | 65.1 | 65.8 | 41.7 |
| Medicaid | 13.3 | 12.1 | 13.8 | 24.0 |
| Private insurance | 19.0 | 20.5 | 18.3 | 30.3 |
| Uninsured | 2.1 | 2.4 | 2.0 | 4.1 |
| Severity of illness | ||||
| APR-DG severity of illness, mean score | 3.1 | 2.5 | 3.4 | 2.1 |
| Percentage with APR-DG severity illness score: major or extreme loss of function (%) | 79.8 | 51.0 | 91.7 | 33.2 |
| APR-DG risk of mortality, mean score | 2.7 | 2.1 | 2.9 | 1.8 |
| Percentage with APR-DG risk of mortality score: major or extreme likelihood of dying (%) | 60.0 | 37.7 | 69.2 | 24.9 |
| Mortality rate (%) | 6.1 | 1.3 | 8.1 | 1.9 |
| Mean length of stay (days) | 9.9 | 5.4 | 11.8 | 4.6 |
| Diagnoses | Principal CDIa | Secondary CDIb | All CDI | |||
|---|---|---|---|---|---|---|
| N | Percentage of stays affected | N | Percentage of stays affected | N | Percentage of stays affected | |
| aFor hospitalizations with CDI as the principal diagnosis, comorbidities were considered as secondary diagnoses. bFor hospitalizations with CDI as a secondary diagnosis, comorbidities were considered either as principal diagnosis or as other secondary diagnoses. CDI: Clostridium difficile infection. | ||||||
| Fluid and electrolyte disturbance | 62,680 | 64.9% | 145,735 | 62.6% | 208,415 | 63.3% |
| Renal failure | 22,605 | 23.4% | 87,325 | 37.5% | 109,930 | 33.4% |
| Septicemia | 1,750 | 1.8% | 99,230 | 42.6% | 100,980 | 30.7% |
| Septic shock | 550 | 0.6% | 32,035 | 13.8% | 32,585 | 9.9% |
| Ileus | 1,995 | 2.1% | 9,610 | 4.1% | 11,605 | 3.5% |
| Ascites | 2,190 | 2.3% | 9,160 | 3.9% | 11,350 | 3.5% |
| Hypoalbuminemia | 1,885 | 2.0% | 6,060 | 2.6% | 7,945 | 2.4% |
| Peritonitis | 450 | 0.5% | 6,285 | 2.7% | 6,735 | 2.0% |
| Perforation of intestine | 150 | 0.2% | 1,480 | 0.6% | 1,630 | 0.5% |
| Toxic megacolon | 355 | 0.4% | 845 | 0.4% | 1,200 | 0.4% |