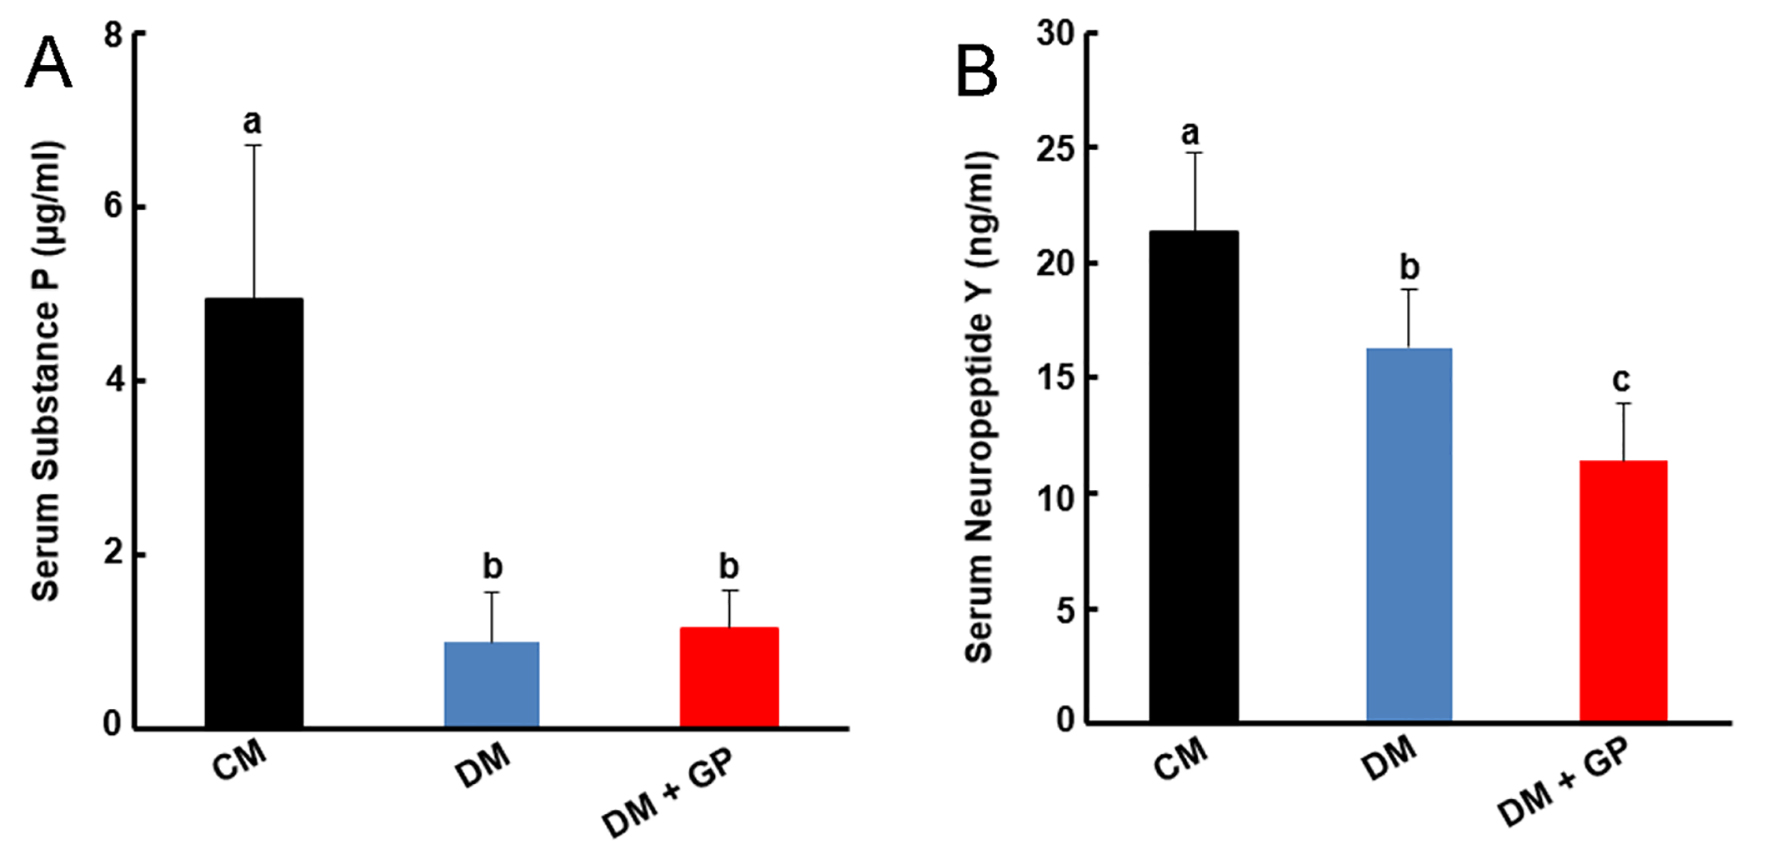
Figure 1. (A) Serum substance P (SP). SP levels were decreased significantly in diabetic (DM, (0.92 ± 0.67 ng/mL) and diabetic gastroparesis (DM + GP, 1.11 ± 0.42 ng/mL) compared to the control (CM) group (4.94 ± 1.77 ng/mL) (overall analysis of variance (ANOVA), P = 0.001, Newman Keuls (NK) post hoc comparisons at α = 0.05), with no significant difference between DM and DM + GP. (B) Neuropeptide Y (NPY) levels in CM, DM and DM + GP rats. NPY serum levels were decreased significantly in DM (16.32 ± 2.56 ng/mL) and in DM + GP (11.4 ± 2.50 ng/mL), as compared to CM group (21.32 ± 3.41 ng/mL), with DM + GP significantly more decreased compared to DM (ANOVA, P = 0.0005, NK post hoc comparisons at α = 0.05). “b” indicates significant statistical difference compared to control “a”. “c” indicates significant statistical difference compared to both “a” and “b.” Data are expressed as the mean ± standard deviation of five rats per group.
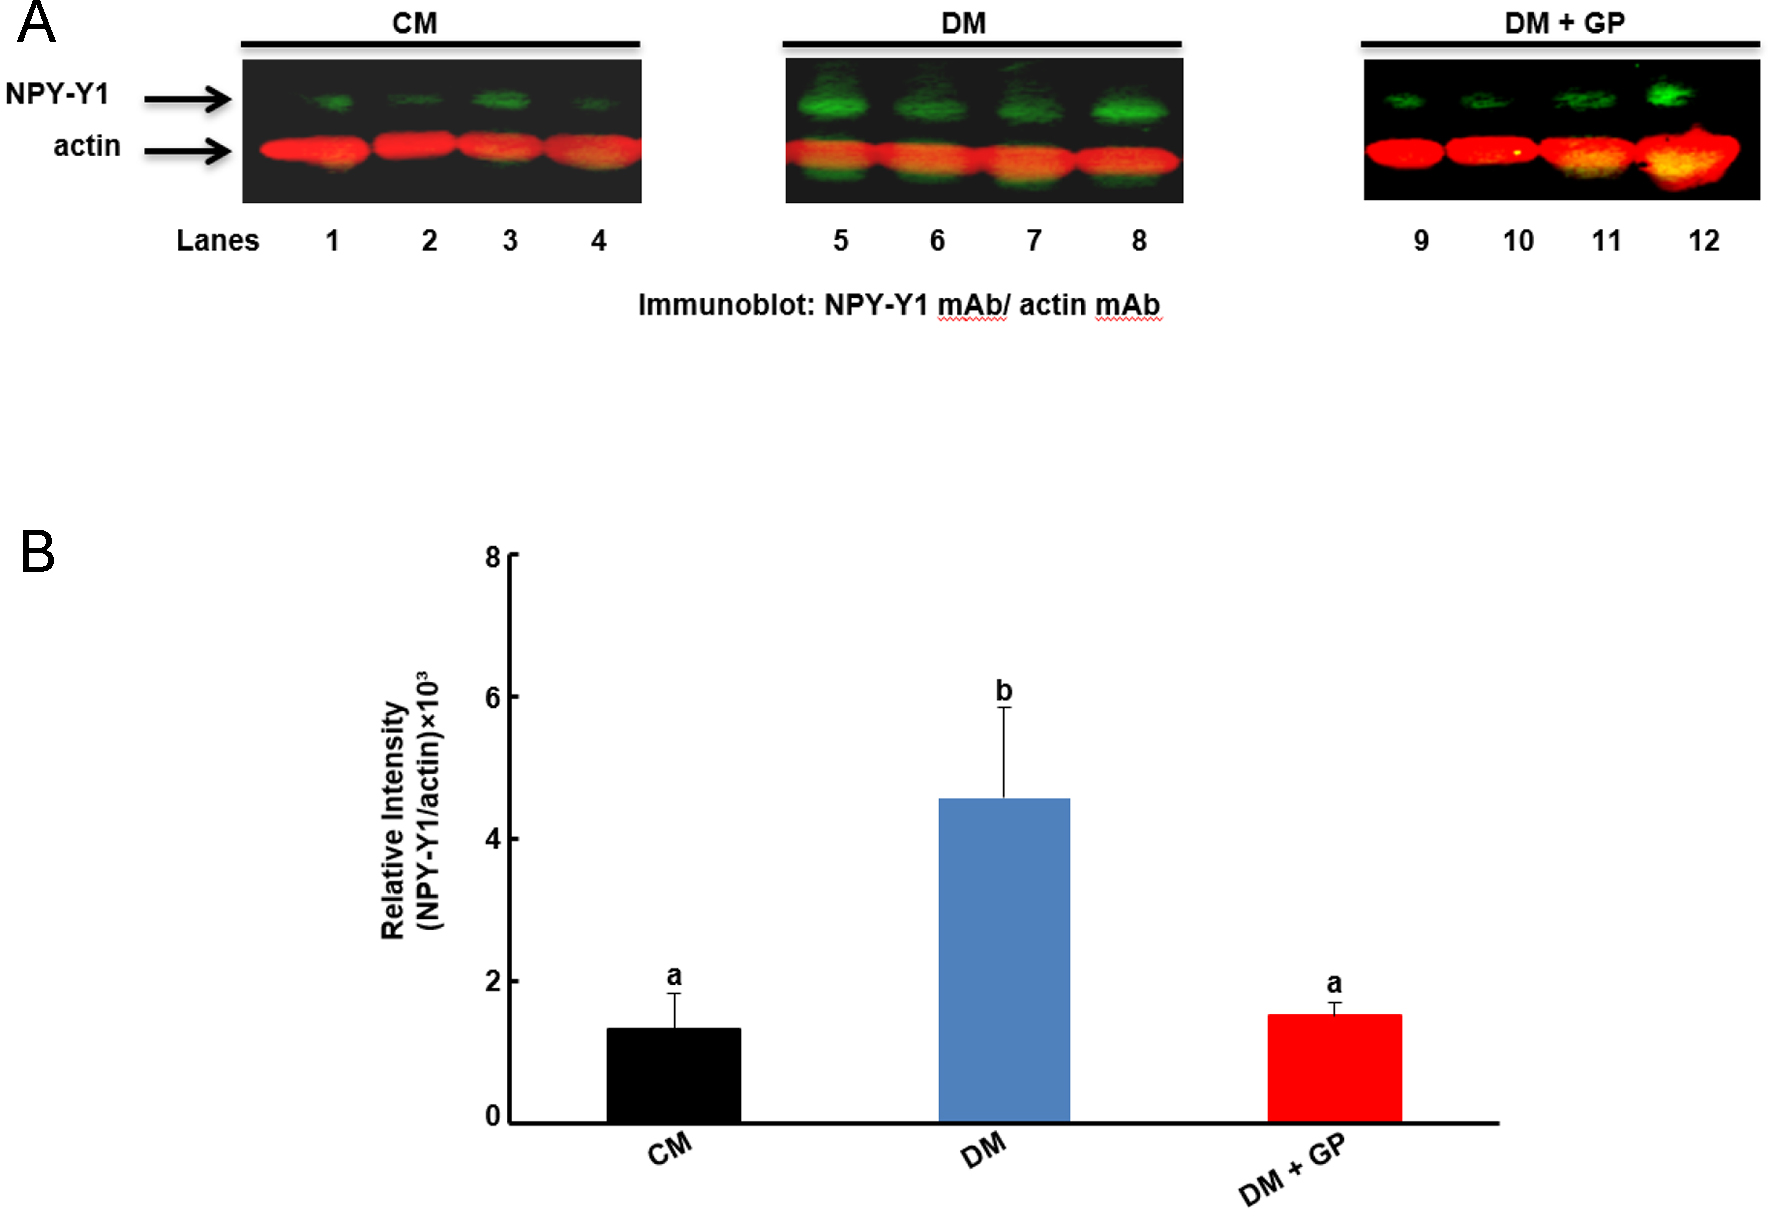
Figure 2. Neuropeptide receptor Y1 (NPY-Y1) level in pyloric tissue. (A) Representative immunoblot (IB) showing the level of NPY-Y1 and actin as indicated by the arrows. (B) The relative intensities of the NPY-Y1 protein were shown to be increased in diabetic (DM, 4.58 ± 1.48) compared to control (CM, 1.31 ± 0.60) and diabetic gastroparesis (DM + GP, 1.15 ± 0.23) rats (analysis of variance (ANOVA), P = 0.0012, Newman Keuls (NK) post hoc comparisons at α = 0.05). Data are expressed as the mean ± standard deviation of four rats per group. “b” indicates significant statistical difference compared to control “a”. Data are expressed as the mean ± standard error (SE) of four rats per group.
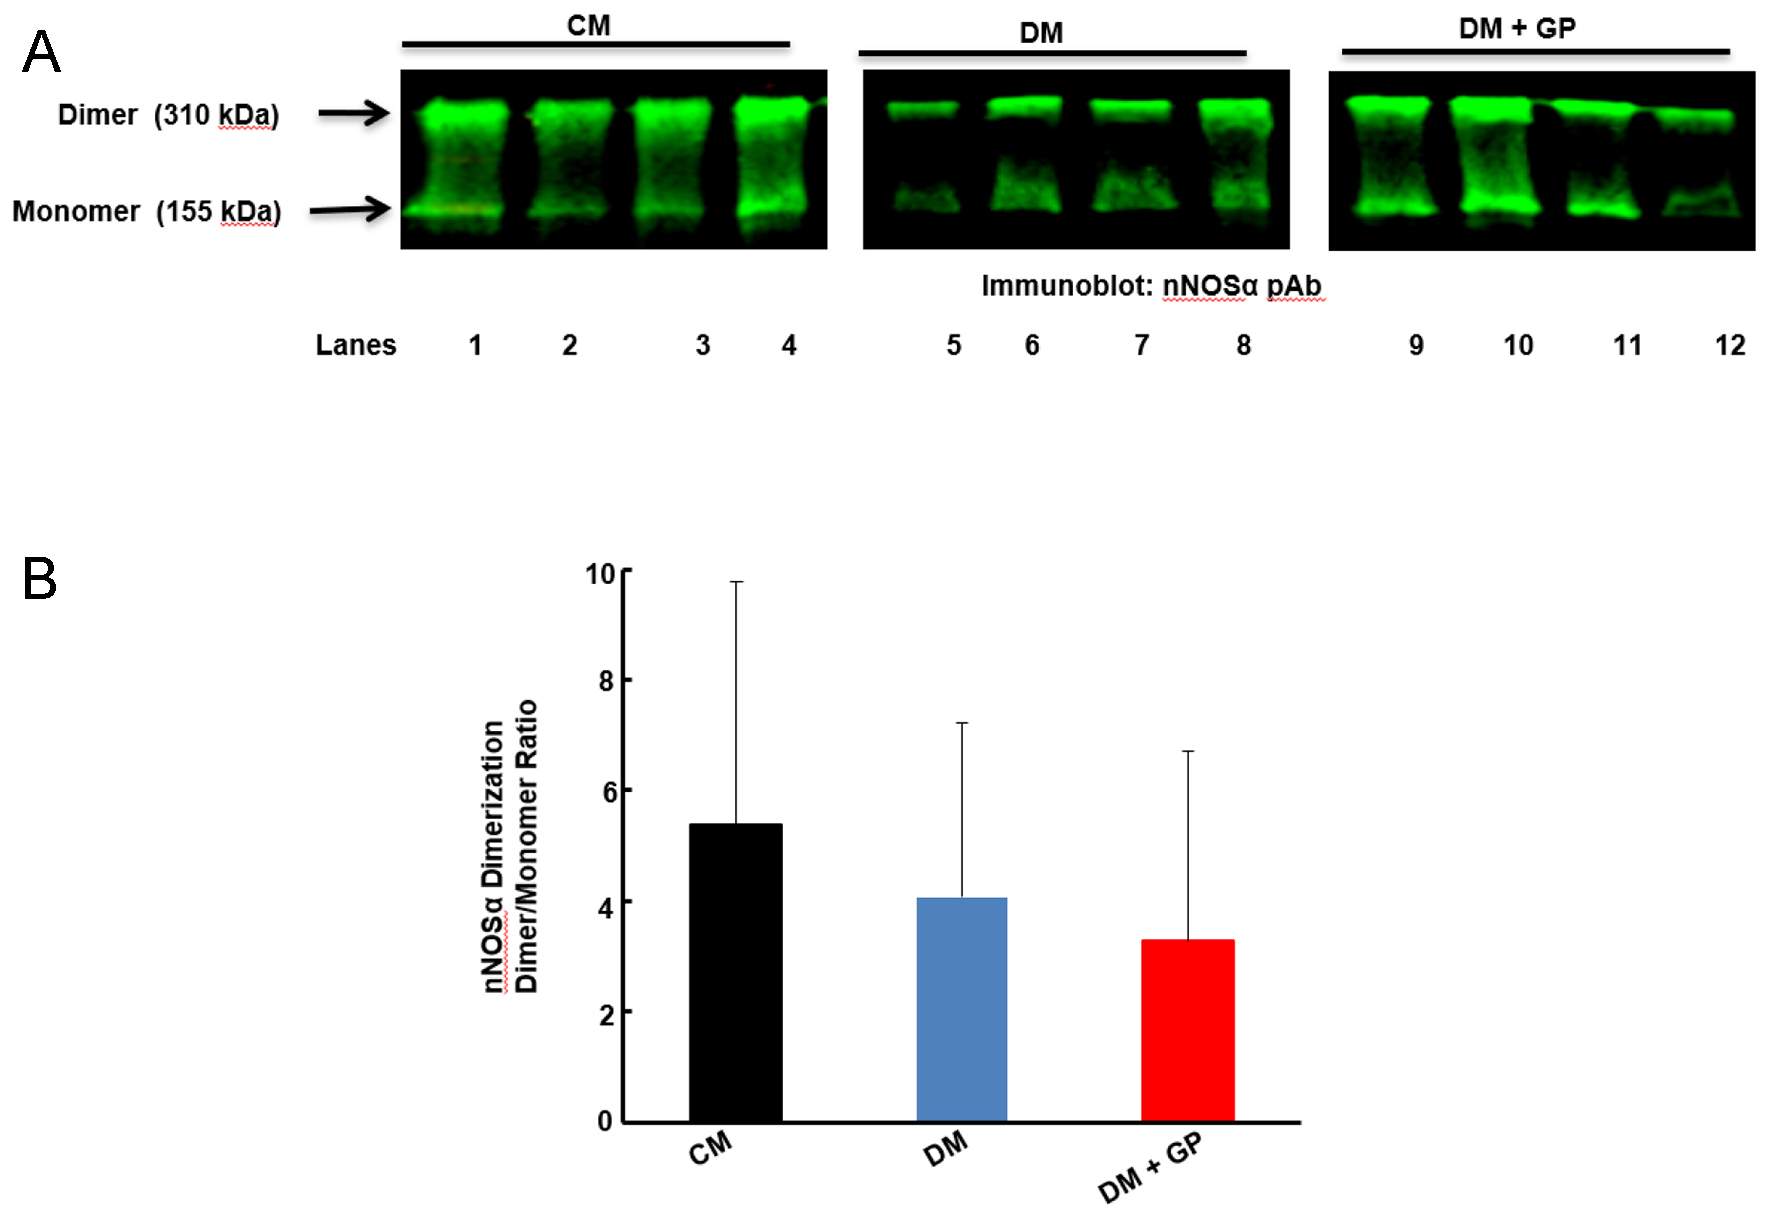
Figure 3. Dimerization of neuronal nitric oxide synthase alpha (nNOSα) in the pylorus of male rats. (A) Representative immunoblot (IB) showing the formation of dimer (310 kDa) and monomer (155 kDa) nNOSα in pylorus tissue. (B) Densitometric analysis data of the dimerization of nNOSα expressed as the ratio of dimer to monomer. Data are expressed as the mean ± standard error (SE) of four rats per group. There are no significant changes in the levels of dimerization of nNOSα in any of the rat groups examined (analysis of variance (ANOVA), P = 0.732).