Gastroenterology Research, ISSN 1918-2805 print, 1918-2813 online, Open Access
Article copyright, the authors; Journal compilation copyright, Gastroenterol Res and Elmer Press Inc
Journal website http://www.gastrores.org

Original Article

Volume 13, Number 2, April 2020, pages 66-72


The Relationship Between Number of Comorbidities and Age of Colorectal Cancer Diagnosis in US Male Veteran Population: A Single-Center Experience

Figure

Figure 1.
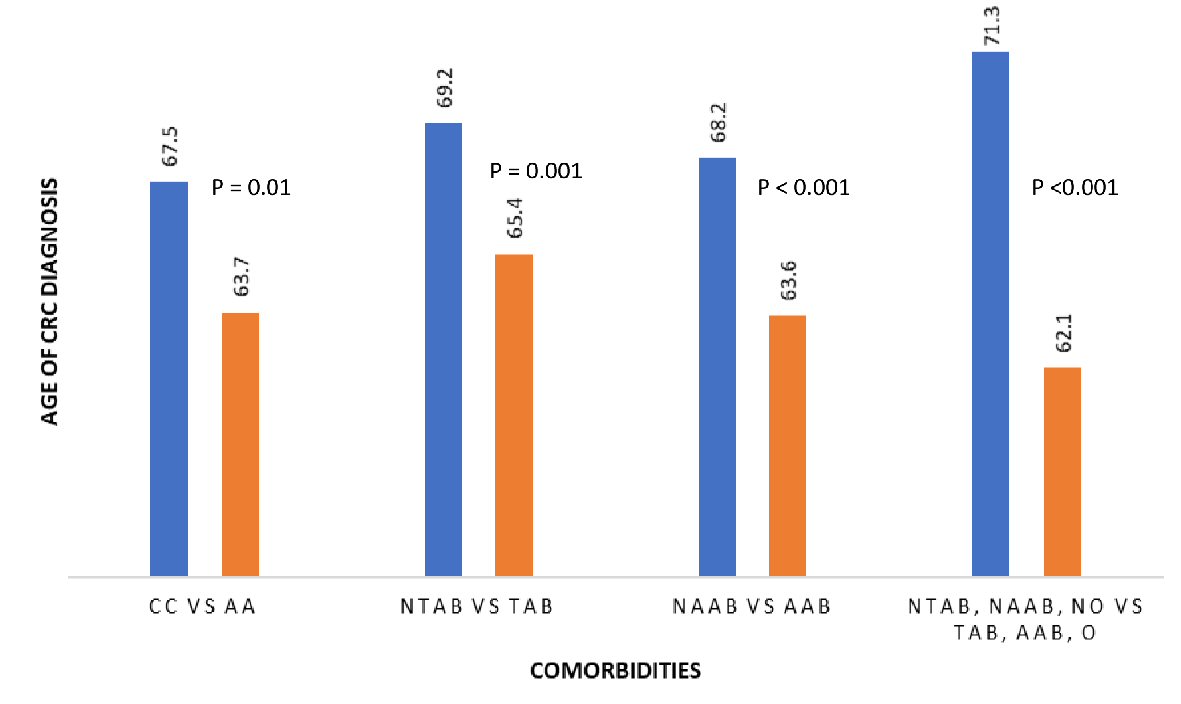
Figure 1. Relationship between race and comorbidity and age of CRC diagnosis. CC: Caucasian; AA: African American; NTAB: non-tobacco abuse; TAB: tobacco abuse; NAAB: non-alcohol abuse; AAB: alcohol abuse; NO: non-obese; O: obese; CRC: colorectal cancer.

Tables

Table 1. Patient Characteristics and Mean Age of Diagnosis (N = 362)
 
VariableLevelN (%)Age at diagnosis: mean (SD)Univariable P value for difference in age
SD: standard deviation; HTN: hypertension; CKD: chronic kidney disease; DM: diabetes mellitus; N/A: not applicable.
RaceCaucasian290 (80.1%)67.5 (10.6)0.01
African American72 (19.9%)63.7 (10.1)
Tobacco abuseYes231 (63.8%)65.4 (10.3)0.001
No131 (36.2%)69.2 (10.6)
Alcohol abuseYes111 (30.7%)63.6 (10.2)< 0.001
No251 (69.3%)68.2 (10.5)
HTNYes264 (72.9%)67.5 (10.4)0.04
No98 (27.1%)64.9 (10.8)
CKDYes56 (15.5%)69.6 (10.4)0.03
No306 (84.5%)66.3 (10.5)
DM I or IIYes147 (40.6%)66.6 (10.0)0.78
No215 (59.4%)66.9 (11.0)
Obesity (BMI ≥ 30)Yes95 (26.2%)65.4 (10.0)0.15
No267 (72.9%)67.3 (10.8)
Total count of tobacco, alcohol, obesity075 (20.7%)71.3 (9.4)< 0.001
1152 (42.0%)67.0 (11.1)
2120 (33.2%)64.2 (10.0)
315 (4.1%)62.1 (7.0)
TotalN/A362 (100%)66.8 (10.6)N/A


Table 2. Multivariable Linear Regression Model for Age at Diagnosis
 
VariableLevelModel coefficienta (SE)P value
aThe adjusted mean difference in age at diagnosis (a negative coefficient indicates a lower age at diagnosis). SE: standard error of estimated coefficient; HTN: hypertension; CKD: chronic kidney disease; DM: diabetes mellitus.
RaceAfrican American-3.8 (1.3)0.01
WhiteReferenceReference
Total count of tobacco, alcohol, obesity0ReferenceReference
1-4.1 (1.4)0.004
2-6.8 (1.5)< 0.001
3-8.9 (2.9)0.002
HTNPresent vs. not3.1 (1.2)0.01
CKDPresent vs. not2.7 (1.6)0.08
DM I or IIPresent vs. not-1.5 (1.1)0.20


Table 3. Breakdown of the Tobacco, Alcohol, and Obesity Comorbidity Combinations
 
Total countTobaccoAlcoholObesityN (%)
3YesYesYes15 (4.1%)
2YesYesNo74 (20.4%)
YesNoYes43 (11.9%)
NoYesYes3 (0.8%)
1YesNoNo99 (27.3%)
NoYesNo19 (5.2%)
NoNoYes34 (9.4%)
0NoNoNo75 (20.7%)