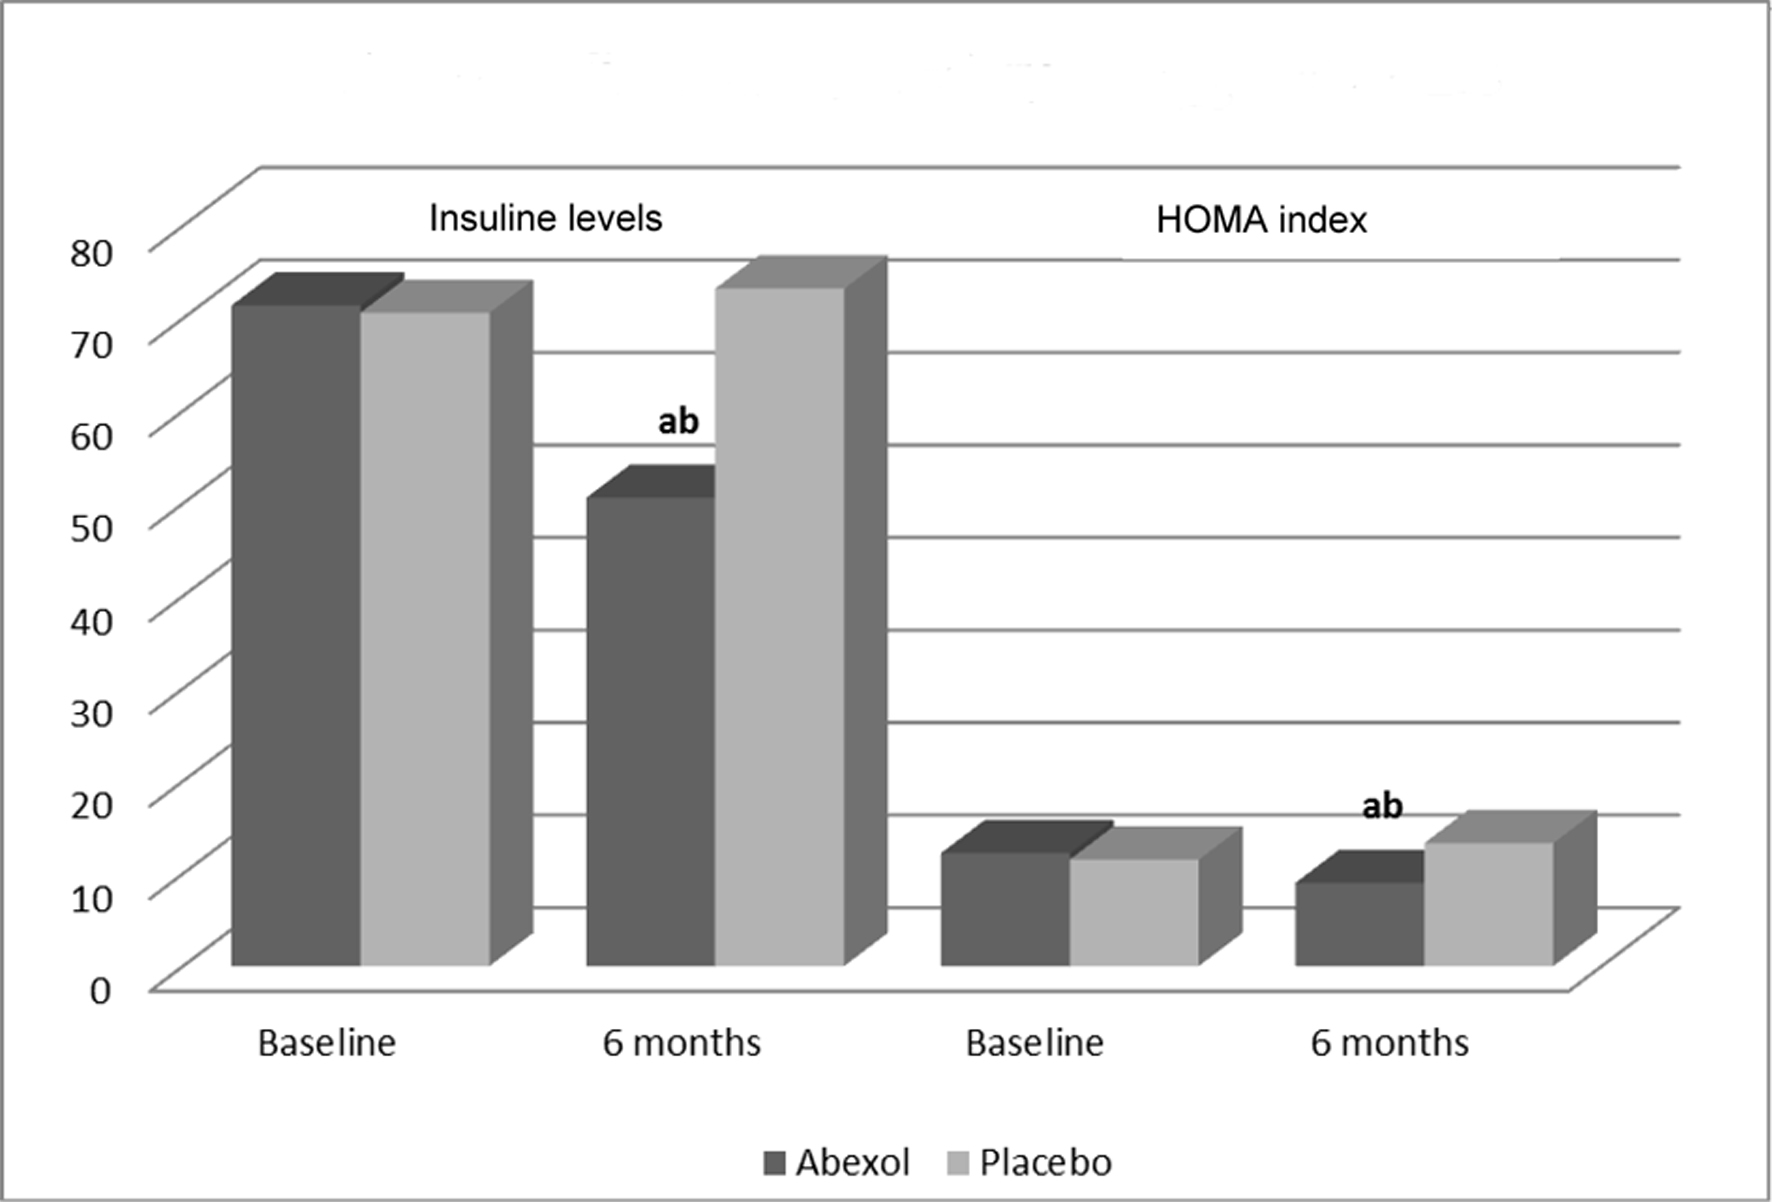
Figure 1. Effects on secondary efficacy outcomes. aP < 0.05 comparison with baseline (t-test for paired samples); bP < 0.05 comparison with placebo (t-test for independent samples).
| Gastroenterology Research, ISSN 1918-2805 print, 1918-2813 online, Open Access |
| Article copyright, the authors; Journal compilation copyright, Gastroenterol Res and Elmer Press Inc |
| Journal website http://www.gastrores.org |
Original Article
Volume 13, Number 2, April 2020, pages 73-80
Benefits of the Therapy With Abexol in Patients With Non-Alcoholic Fatty Liver Disease
Figures
Tables
| Abexol (n = 50) | Placebo (n = 50) | Total (n = 100) | |
|---|---|---|---|
| All comparisons were not significant. The table included CM consumed by ≥ two patients. BMI: body mass index; CM: concomitant medications; X: mean; SD: standard deviation; ACEI: angiotensin converting enzyme inhibitor. | |||
| Age (years) (X ± SD) | 53 ± 9 | 53 ± 8 | 53 ± 9 |
| BMI (kg/m2) (X ± SD) | 29.7 ± 5.3 | 29.1 ± 4.1 | 29.4 ± 4.6 |
| n, % | n, % | n, % | |
| Gender, n (%) | |||
| Female | 28 (56.0%) | 26 (52.0%) | 54 (54.0%) |
| Male | 22 (44.0%) | 24 (48.0%) | 46 (46.0%) |
| Personal history, n (%) | |||
| Hypertension | 30 (60.0%) | 27 (54.0%) | 57 (57.0%) |
| Dyslipidemia | 27 (54.0%) | 26 (52.0%) | 53 (53.0 %) |
| Overweight (BMI ≥ 25, < 30 kg/m2) | 23 (46.0%) | 24 (48.0%) | 47 (47.0 %) |
| Obesity (BMI ≥ 30 kg/m2) | 20 (40.0%) | 19 (38.0%) | 39 (39.0%) |
| Diabetes mellitus | 12 (24.0%) | 10 (20.0%) | 22 (22.0%) |
| Smoking | 11 (22.0%) | 9 (18.0%) | 20 (20.0%) |
| Coronary heart disease | 4 (8.0%) | 5 (10%) | 9 (9.0%) |
| CM, n (%) | |||
| Patients consuming CM | 48 (96.0%) | 47 (94%) | 95 (95.0%) |
| ACEI | 20 (40.0%) | 16 (32.0%) | 36 (36.0%) |
| Lipid-lowering drugs | 15 (30.0%) | 16 (32.0%) | 31 (31.0%) |
| Diuretics | 14 (28.0%) | 14 (28.0%) | 28 (28.0%) |
| Oral hypoglycemic drugs | 12 (24.0%) | 10 (20.0%) | 22 (22.0%) |
| β-blockers | 6 (12.0%) | 4 (8.0%) | 10 (10.0%) |
| Antiplatelet drugs | 4 (8.0%) | 5 (10.0%) | 9 (9.0%) |
| Calcium antagonists | 2 (4.0%) | 4 (8.0%) | 6 (6.0%) |
| Nitrovasodilator | 2 (4.0%) | 2 (4.0%) | 4 (4.0%) |
| Degree of severity | Abexol | Placebo | P value |
|---|---|---|---|
| P < 0.05 comparison with placebo (χ2 test). ns: no significant. | |||
| Baseline | |||
| Normal | 0 | 0 | ns |
| Mild | 17 | 18 | ns |
| Moderate | 23 | 24 | ns |
| Severe | 10 | 8 | ns |
| Six months | |||
| Normal | 14 | 6 | P < 0.05 |
| Mild | 16 | 18 | ns |
| Moderate | 17 | 21 | ns |
| Severe | 3 | 5 | ns |
| Treatment | Baseline | Six months | Changes (%) |
|---|---|---|---|
| aP < 0.05 comparison with baseline (t-test for paired samples); bP < 0.05 comparison with placebo (t-test for independent samples). X: mean; SD: standard deviation. | |||
| Insulin levels (µUI/mL) | |||
| Placebo | 70.6 ± 29.8 | 73.2 ± 30.1 | +3.7 |
| Abexol | 71.4 ± 28.6 | 50.6 ± 31.2a, b | -29.1 |
| HOMA index | |||
| Placebo | 11.5 ± 5.5 | 13.3 ± 8.6 | +15.7 |
| Abexol | 12.2 ± 8.2 | 9.0 ± 5.1a, b | -26.3 |
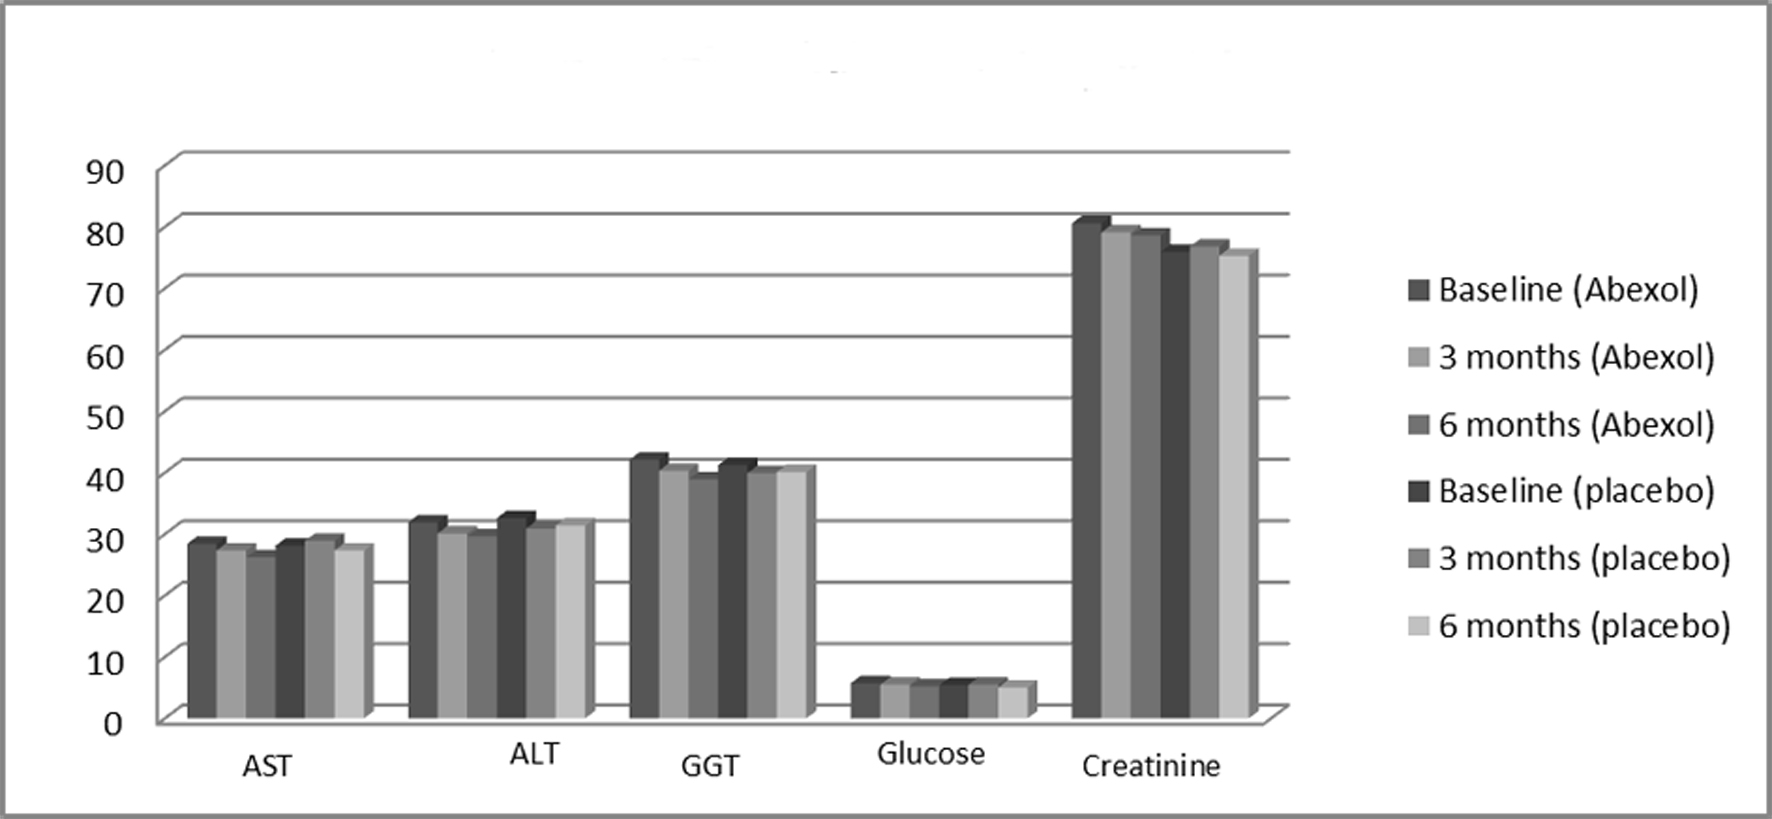
| Treatment | Baseline | Three months | Six months |
|---|---|---|---|
| All comparisons were not significant. X: mean: SD standard deviation; ALT alanine aminotransferase; AST: aspartate aminotransferase; GGT: gamma glutamyl transferase. | |||
| AST (U/L) | |||
| Placebo | 28.1 ± 10.2 | 28.9 ± 10.5 | 27.3 ± 11.1 |
| Abexol | 28.4 ± 11.3 | 27.3 ± 10.8 | 26.2 ± 10.7 |
| ALT (U/L) | |||
| Placebo | 32.6 ± 13.4 | 30.9 ± 12.5 | 31.4 ± 14.7 |
| Abexol | 31.9 ± 14.3 | 30.1 ± 11.9 | 29.6 ± 13.5 |
| GGT (U/L) | |||
| Placebo | 41.2 ± 28.6 | 39.9 ± 25.8 | 40.1 ± 26.7 |
| Abexol | 42.1 ± 26.5 | 40.3 ± 23.7 | 38.9 ± 24.5 |
| Glucose (mmol/L) | |||
| Placebo | 5.4 ± 1.6 | 5.5 ± 1.0 | 5.0 ± 1.7 |
| Abexol | 5.7 ± 1.4 | 5.5 ± 1.2 | 5.2 ± 1.1 |
| Creatinine (μmol/L) | |||
| Placebo | 75.9 ± 13.4 | 76.8 ± 14.2 | 75.3 ± 15.1 |
| Abexol | 80.6 ± 18.6 | 79.1 ± 14.4 | 78.6 ± 14.7 |