Figures
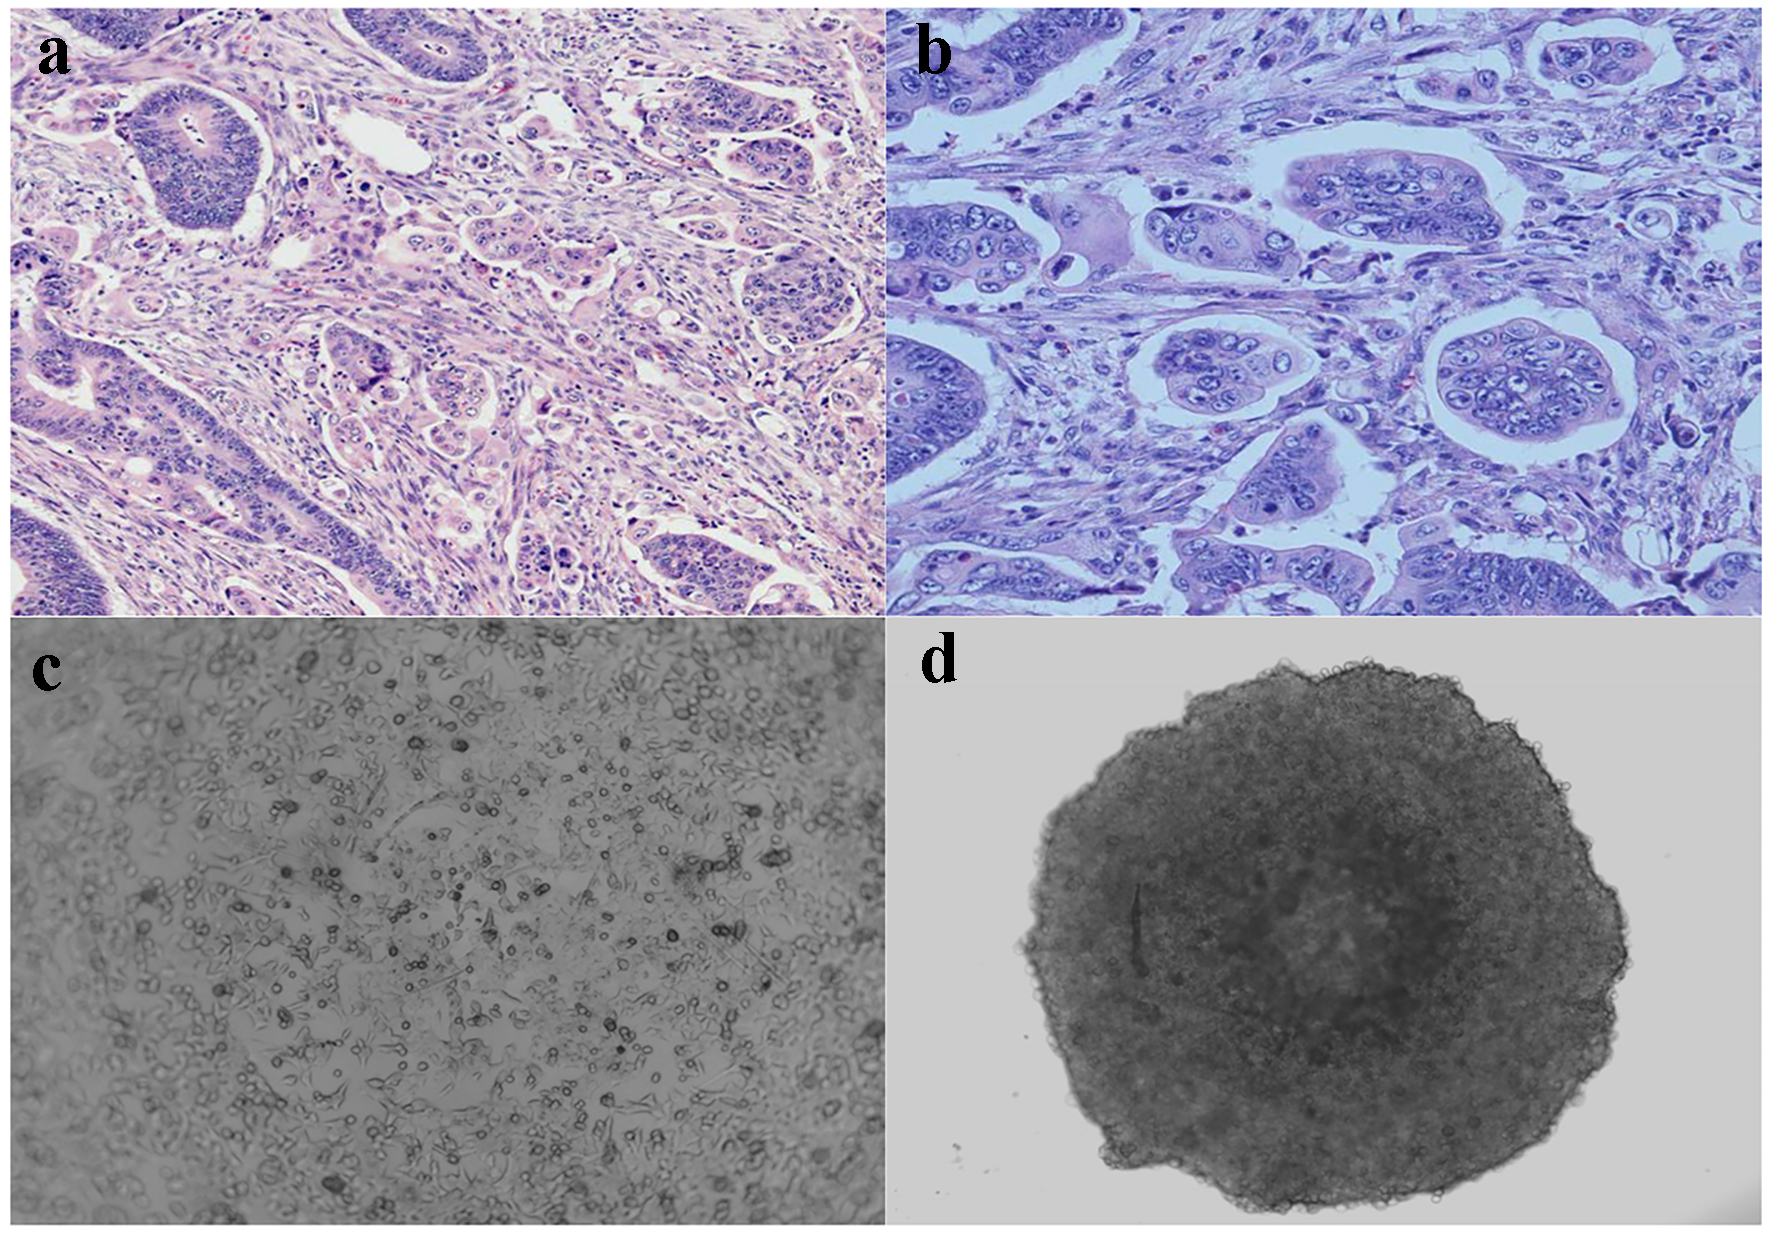
Figure 1. Micropapillary carcinoma and spheroid formation. (a) Characteristic cell clusters surrounded by empty spaces (H&E, × 100). (b) Micropapillary cells displaying a high grade of anaplasia (H&E, × 400). (c) Cultured monolayer HCT116 human colon cancer cells (phase contrast, × 200). (d) 3D spheroid HCT116 human colon cancer cells formed in ULA round-bottom microplate (phase contrast, × 200).
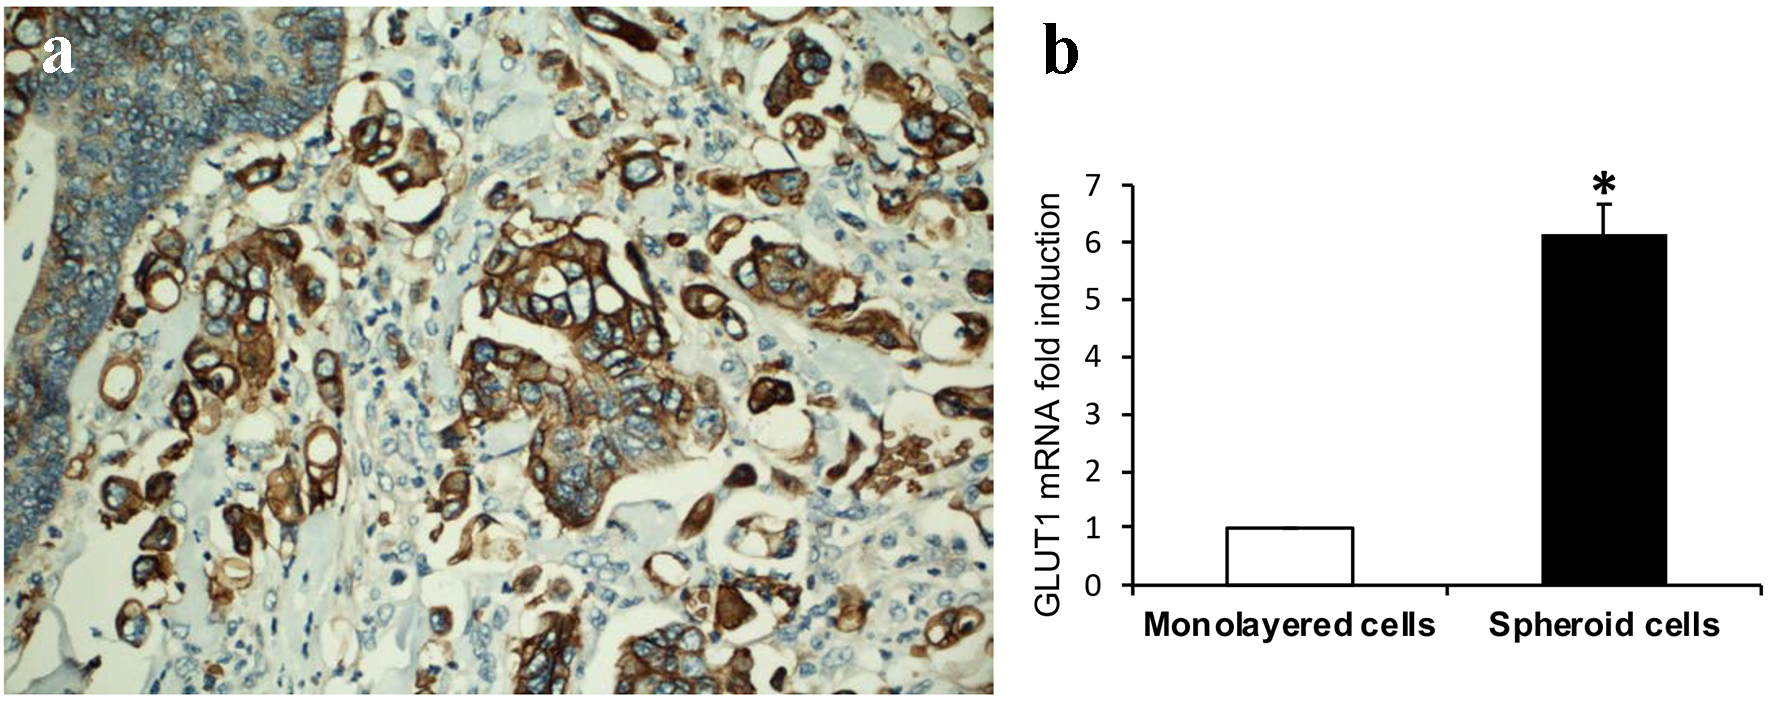
Figure 2. GLUT1 expression. (a) Tumor cells of micropapillary component showing increased immunohistochemical expression of GLUT1 compared to adjacent tumor cells of conventional glandular component (DAB, × 200). (b) GLUT1 expression is significantly increased in 3D spheroids than that of monolayer HCT116 colon cancer cells assayed by real-time RT-PCR (sixfold induction, *P < 0.01).
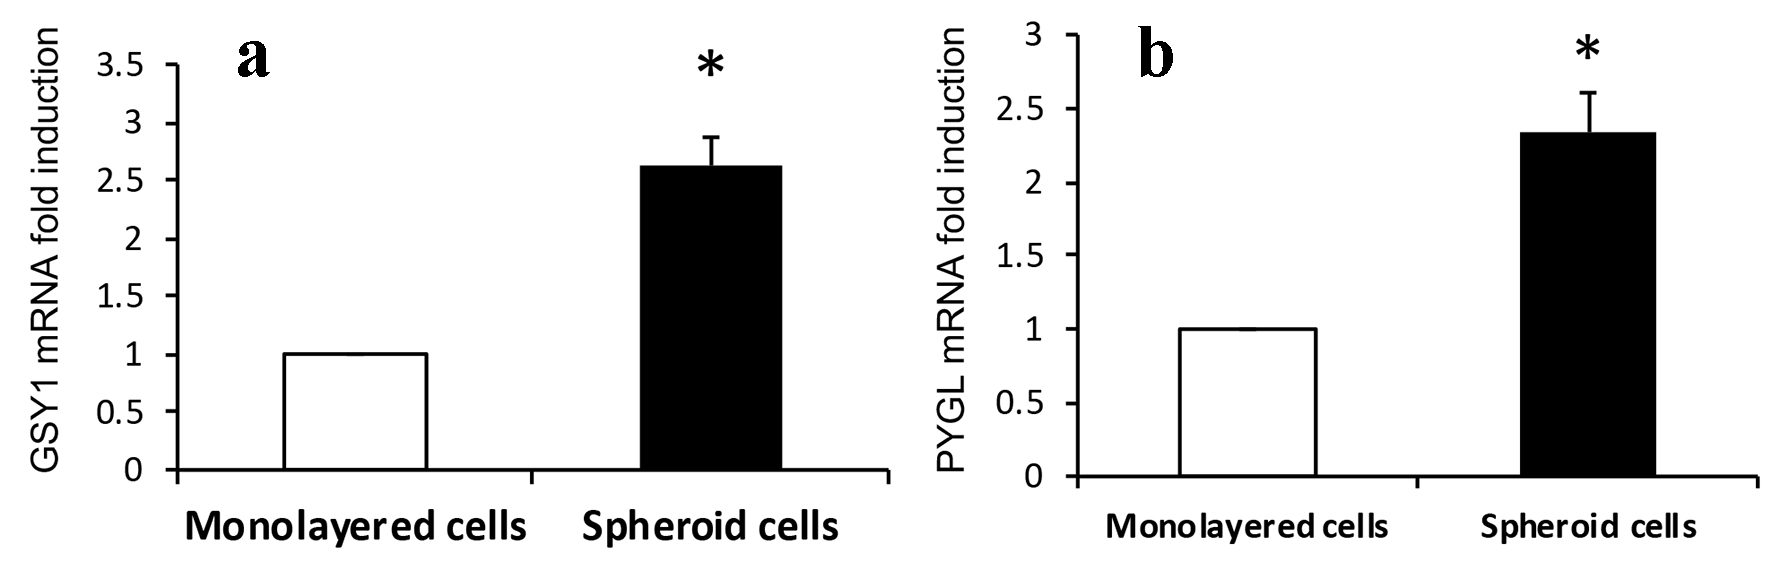
Figure 3. Expression of (a) GSY1 and (b) PYGL. Expressions of GSY1 and PYGL are significantly increased in 3D spheroids than that of monolayer HCT116 colon cancer cells assayed by real-time RT-PCR (2.6- and 2.3-fold induction, respectively, *P < 0.01).
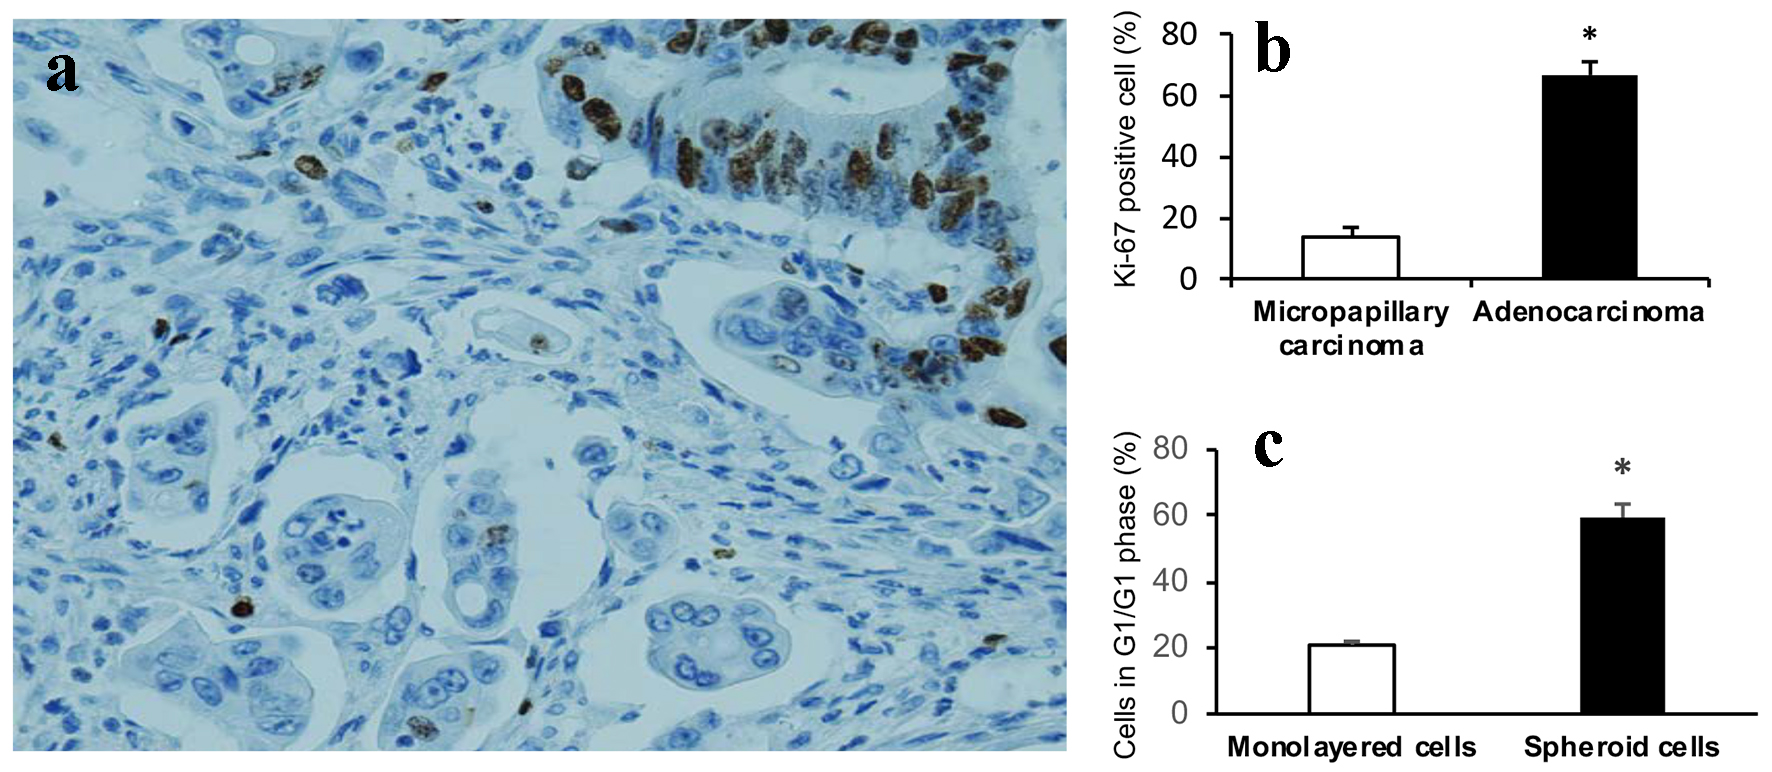
Figure 4. Cell proliferation arrest. (a) Tumor cells of micropapillary component showing significant lower proliferation rate compared to adjacent tumor cells of conventional glandular component assessed by Ki-67 (nuclear expression) (DAB, × 400). (b) Graphical quantitation of Ki-67 positive cells expressed as percent of total cells. Data are expressed as mean ± SD. *P < 0.001. (c) Cells in G0/G1 phase are significantly increased in 3D spheroids than that of monolayer HCT116 colon cancer cells. Data are expressed as mean ± SD. *P < 0.001.