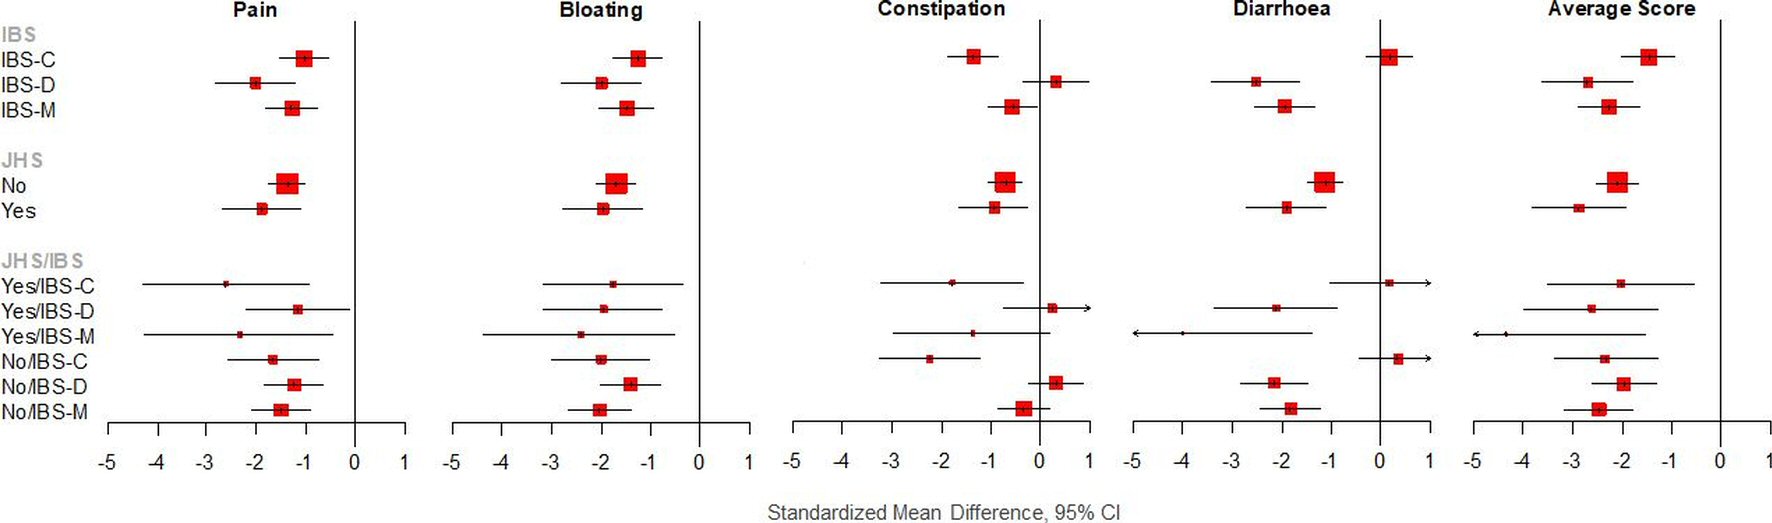
Figure 1. Effect sizes (SMD), according to JHS and IBS and combination.
| Gastroenterology Research, ISSN 1918-2805 print, 1918-2813 online, Open Access |
| Article copyright, the authors; Journal compilation copyright, Gastroenterol Res and Elmer Press Inc |
| Journal website http://www.gastrores.org |
Original Article
Volume 12, Number 1, February 2019, pages 27-36
Joint Hypermobility Syndrome Affects Response to a Low Fermentable Oligosaccharide, Disaccharide, Monosaccharide and Polyol Diet in Irritable Bowel Syndrome Patients: A Retrospective Study
Figures
Tables
| Variables | Total N (%) | JHS | IBS | |||||
|---|---|---|---|---|---|---|---|---|
| JHS (n = 35) | Non-JHS (n = 130) | χ2 P-value | IBS-C (n = 67) | IBS-D (n = 35) | IBS-M (n = 63) | χ2 P-value | ||
| The baseline scores and duration are non-normally distributed according to Kolmogorov’s test and hence median is preferred. | ||||||||
| Gender | ||||||||
| Females | 130 (78.8) | 34 (97.1) | 96 (73.8) | 0.003 | 35 (100.0) | 67 (100.0) | 28 (44.4) | < 0.0001 |
| Males | 35 (21.2) | 1 (2.9) | 34 (26.2) | 0 (0.0) | 0 (0.0) | 35 (55.6) | ||
| Age (years) | ||||||||
| 18 ≤ age < 35 | 52 (32.5) | 17 (48.6) | 35 (28.0) | 0.035 | 9 (25.7) | 26 (40.0) | 17 (28.3) | 0.269 |
| 35 ≤ age < 50 | 56 (35.0) | 12 (34.3) | 44 (35.2) | 17 (48.6) | 16 (24.6) | 23 (38.3) | ||
| 50 ≤ age < 65 | 36 (22.5) | 6 (17.1) | 30 (24.0) | 5 (14.3) | 16 (24.6) | 15 (25.0) | ||
| 65 ≤ age | 16 (10.0) | 0 (0.0) | 16 (12.8) | 4 (11.4) | 7 (10.8) | 5 (8.3) | ||
| IBS subtypes | ||||||||
| IBS-C | 67 (40.6) | 11 (31.4) | 24 (18.5) | 0.074 | --- | --- | --- | --- |
| IBS-D | 35 (21.2) | 16 (45.7) | 51 (29.2) | --- | --- | --- | ||
| IBS-M | 63 (38.2) | 8 (22.9) | 55 (42.3) | --- | --- | --- | ||
| JHS | ||||||||
| Yes | 35 (21.2) | --- | --- | --- | 11 (31.4) | 16 (23.9) | 8 (12.7) | 0.074 |
| No | 130 (78.8) | --- | --- | 24 (68.6) | 51 (76.1) | 55 (87.3) | ||
| Positive lactose breath tests | ||||||||
| No | 67 (65.0) | 17 (85.0) | 50 (60.2) | 0.037 | 13 (59.1) | 24 (60.0) | 30 (73.2) | 0.371 |
| Yes | 36 (35.0) | 3 (15.0) | 33 (39.8) | 9 (40.9) | 16 (40.0) | 11 (26.8) | ||
| Positive fructose breath tests | ||||||||
| No | 48 (64.9) | 8 (53.3) | 40 (67.8) | 0.298 | 9 (60.0) | 19 (63.3) | 20 (69.0) | 0.818 |
| Yes | 26 (35.1) | 7 (46.7) | 19 (32.2) | 6 (40.0) | 11 (36.7) | 9 (31.0) | ||
| FODMAP training | ||||||||
| Individual | 66 (40.0) | 11 (31.4) | 55 (42.3) | 0.244 | 7 (20.0) | 20 (29.9) | 39 (61.9) | < 0.0001 |
| Group | 99 (60.0) | 24 (68.6) | 75 (57.7) | 28 (80.0) | 47 (70.1) | 24 (38.1) | ||
| Median (IQR) | Mann-Whitney P-value | Mann-Whitney P-value | ||||||
| Baseline scores | ||||||||
| Pain | 3.8 (2.5 - 4.0) | 3.8 (3.3 - 5.0) | 3.5 (2.5 - 3.8) | 0.011 | 3.8 (2.5 - 4.8) | 3.8 (2.5 - 3.8) | 3.3 (2.5 - 4.0) | 0.122 |
| Bloating | 3.8 (3.1 - 4.9) | 3.8 (3.5 - 5.0) | 3.8 (2.9 - 4.5) | 0.149 | 3.8 (3.8 - 5.0) | 3.8 (3.3 - 5.0) | 3.8 (2.5 - 4.5) | 0.128 |
| Constipation | 0.5 (0.0 - 1.5) | 1.0 (0.0 - 3.0) | 0.5 (0.0 - 1.3) | 0.329 | 1.0 (1.0 - 5.0) | 0.0 (0.0 - 0.5) | 1.0 (0.0 - 2.0) | < 0.0001 |
| Diarrhea | 1.0 (0.8 - 3.0) | 1.0 (0.0 - 3.0) | 1.0 (1.0 - 3.0) | 0.110 | 0.0 (0.0 - 0.0) | 1.0 (1.0 - 3.0) | 2.5 (1.0 - 3.5) | < 0.0001 |
| Average | 2.4 (2.1 - 2.9) | 2.8 (2.3 - 3.1) | 2.4 (2.0 - 2.8) | 0.023 | 2.4 (2.1 - 2.9) | 2.4 (2.0 - 2.8) | 2.6 (2.1 - 3.2) | 0.102 |
| Duration of FODMAP diet (days) | 63 (56 - 83) | 63 (56 - 84) | 63 (56 - 83) | 0.142 | 63 (56 - 84) | 63 (49 - 71) | 70 (56 - 87) | 0.020 |
| Pain | Bloating | Diarrhea | Constipation | Average score | ||||||
|---|---|---|---|---|---|---|---|---|---|---|
| beta | P | beta | P | beta | P | beta | P | beta | P | |
| JHS # time | ||||||||||
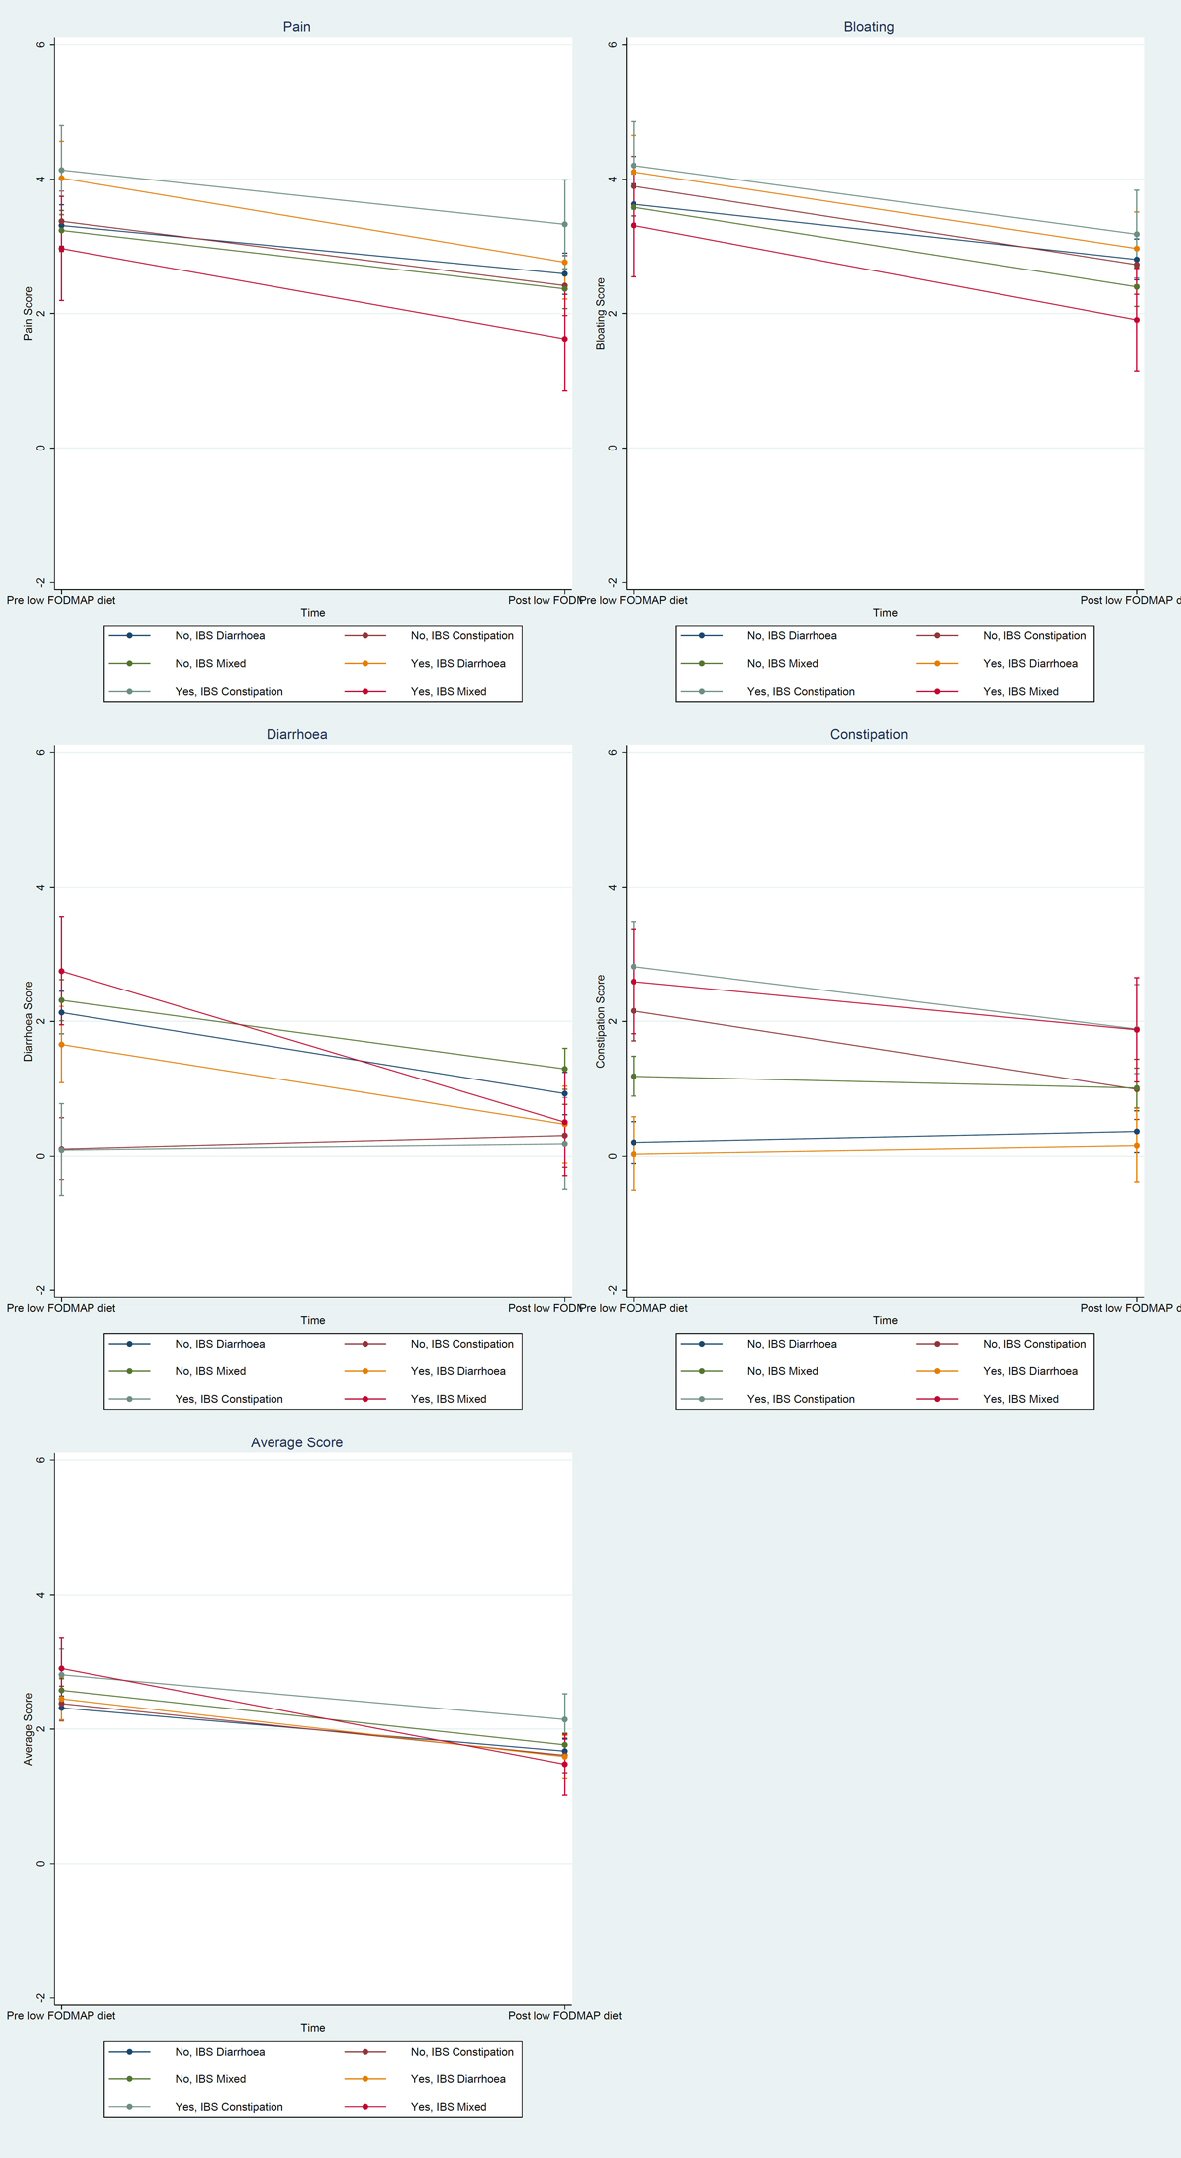
| No # post low FODMAP diet | -0.94 | < 0.0001 | -1.23 | < 0.0001 | -0.84 | < 0.0001 | 0.81 | < 0.0001 | -0.55 | < 0.0001 |
| Yes # pre low FODMAP diet | 0.70 | 0.028 | 0.48 | 0.128 | -0.48 | 0.151 | -0.17 | 0.597 | 0.14 | 0.467 |
| Yes # post low FODMAP diet | -0.77 | 0.064 | -1.07 | 0.009 | -1.3 | 0.003 | 0.60 | 0.154 | -0.63 | 0.009 |
| IBS type # time | ||||||||||
| IBS-D # post low FODMAP diet | 0.22 | 0.225 | 0.41 | 0.057 | -0.37 | 0.102 | -0.65 | 0.003 | -0.10 | 0.449 |
| IBS-C # pre low FODMAP diet | 0.06 | 0.064 | 0.27 | 0.327 | -2.03 | < 0.0001 | 1.96 | < 0.0001 | 0.06 | 0.686 |
| IBS-C # post low FODMAP diet | 0.05 | 0.049 | 0.33 | 0.221 | -0.99 | < 0.0001 | -0.02 | 0.943 | -0.16 | 0.319 |
| IBS-M # pre low FODMAP diet | -0.07 | -0.073 | -0.04 | 0.835 | 0.18 | 0.416 | 0.98 | < 0.0001 | 0.26 | 0.037 |
| IBS-M # post low FODMAP diet | 0 | omitted | 0 | omitted | 0 | omitted | 0 | omitted | 0 | omitted |
| JHS #IBS Type # time | ||||||||||
| Yes # IBS-C # pre low FODMAP diet | 0.06 | 0.912 | -0.17 | 0.735 | 0.46 | 0.388 | 0.83 | 0.109 | 0.29 | 0.326 |
| Yes # IBS-C # post low FODMAP diet | 0.74 | 0.153 | 0.29 | 0.571 | 0.34 | 0.529 | 1.10 | 0.033 | 0.30 | 0.030 |
| Yes # IBS-M # pre low FODMAP diet | -0.97 | 0.067 | -0.75 | 0.152 | 0.91 | 0.097 | 1.58 | 0.003 | 0.19 | 0.535 |
| Yes # IBS-M # post low FODMAP diet | -0.92 | 0.085 | -0.65 | 0.213 | -0.34 | 0.540 | 1.07 | 0.044 | -0.21 | 0.498 |
| Constant | 3.31 | < 0.0001 | 3.63 | < 0.0001 | 1.81 | < 0.0001 | 0.20 | 0.200 | 2.32 | < 0.0001 |
| F test | < 0.0001 | < 0.0001 | < 0.0001 | < 0.0001 | < 0.0001 | |||||
| Pain | Bloating | Diarrhea | Constipation | Average score | ||||||
|---|---|---|---|---|---|---|---|---|---|---|
| Contrast (95% CI) | SMD (95% CI) | Contrast (95% CI) | SMD (95% CI) | Contrast (95% CI) | SMD (95% CI) | Contrast (95% CI) | SMD (95% CI) | Contrast (95% CI) | SMD (95% CI) | |
| *P < 0.05; **P < 0.01; ***P < 0.001. | ||||||||||
| JHS | ||||||||||
| No | -0.85 (-1.06, -0.64)*** | -1.38 (-1.76, -0.99) | -1.06 (-1.27, -0.84)*** | -1.69 (-2.09, -1.29) | -0.68 (-0.88, -0.47)*** | -1.12 (-1.49, -0.75) | -0.39 (-0.59, -0.20)*** | -0.70 (-1.06, -0.35) | -0.74 (-0.87, -0.62)*** | - 2.11 (-2.54, -1.68) |
| Yes | -1.13 (-1.53, -0.74)*** | -1.89 (-2.69, -1.09) | -1.19 (-1.59, -0.79)*** | -1.96 (-2.77, -1.15) | -1.12 (-1.50, -0.73)*** | -1.91 (-2.71, -1.10) | -0.51 (-0.87, -0.15)** | -0.93 (-1.63, -0.23) | -0.99 (-1.21, -0.76)*** | -2.87 (-3.83, -1.92) |
| IBS | ||||||||||
| IBS-C | -0.88 (-1.29, -0.47)*** | -1.03 (-1.54, -0.52) | -1.10 (-1.51, -0.68)*** | -1.26 (-1.78, -0.73) | 0.14 (-0.26, 0.55) | 0.17 (-0.31, 0.65) | -1.05 (-1.42, -0.68)*** | -1.35 (-1.88, -0.81) | -0.76 (-0.94, -0.57)*** | -1.47 (-2.01, -0.92) |
| IBS-D | -0.98 (-1.31, -0.66)*** | -2.01 (-2.84, -1.19) | -0.98 (-1.31, -0.65)*** | -1.98 (-2.80, -1.17) | -1.20 (-1.51, -0.88)*** | -2.51 (-3.41, -1.61) | 0.14 (-0.15, 0.44) | 0.32 (-0.34, 0.99) | -0.72 (-0.96, -0.49)*** | -2.70 (-3.63, -1.77) |
| IBS-M | -1.11 (-1.53, -0.68)*** | -1.28 (-1.82, -0.74) | -1.30 (-1.73, -0.86)*** | -1.48 (-2.04, -0.92) | -1.64 (-2.05, -1.22)*** | -1.94 (-2.54, -1.33) | -0.45 (-0.84, -0.06)* | -0.57 (-1.07, -0.07) | -1.12 (-1.37, -0.88)*** | -2.26 (-2.90, -1.63) |
| Post-pre low FODMAP (time) | -0.99 (-1.22, -0.77)*** | -1.34 (-1.68, -1.01) | -1.12 (-1.35, -0.90)*** | -1.50 (-1.85, -1.16) | -0.90 (-1.12, -0.68)*** | -1.24 (-1.58, -0.91) | -0.45 (-0.66, -0.25)*** | -0.67 (-0.99, -0.36) | -0.87 (-0.99, -0.74)*** | -2.05 (-2.42, -1.67) |
| JHS # IBS type | ||||||||||
| Yes # IBS-C | -0.81 (-1.49, -0.13)* | -2.62 (-4.31, -0.93) | -1.02 (-1.71, -0.33)** | -1.75 (-3.19, -0.32) | 0.09 (-0.57, 0.76) | 0.16 (-1.02, 1.35) | -0.93 (-1.55, -0.31)** | -1.78 (-3.22, -0.34) | -0.67 (-1.06, -0.28)** | -2.03 (-3.53, -0.52) |
| Yes # IBS-D | -1.25 (-1.82,-0.69)*** | -1.16 (-2.23, -0.09) | -1.14 (-1.71, -0.57)*** | -1.96 (-3.17, -0.74) | -1.19 (-1.74, -0.64)*** | -2.11 (-3.36, -0.86) | 0.13 (-0.39, 0.64) | 0.24 (-0.74, 1.22) | -0.86 (-1.19, -0.54)*** | -2.62 (-3.99, -1.24) |
| Yes # IBS-M | -1.34 (-2.14, -0.55)** | -2.33 (-4.25, -0.42) | -1.41 (-2.21, -0.60)** | -2.41 (-4.36, -0.47) | -2.25 (-3.03, -1.47)*** | -4.00 (-6.66, -1.35) | -0.72 (-1.44, 0.01) | -1.37 (-2.96, 0.22) | -1.43 (-1.89, -0.97)*** | -4.33 (-7.15, -1.52) |
| No # IBS-C | -0.96 (-1.42,-0.50)*** | -1.66 (-2.60, -0.72) | -1.17 (-1.63, -0.70)*** | -2.00 (-3.00, -1.01) | 0.20 (-0.25, 0.65) | 0.35 (-0.46, 1.16) | -1.17 (-1.59, -0.75)*** | -2.23 (-3.27, -1.19) | -0.77 (-1.04, -0.51)*** | -2.34 (-3.40, -1.29) |
| No # IBS-D | -0.72 (-1.03, -0.40)*** | -1.25 (-1.85, -0.64) | -0.82 (-1.14, -0.50)*** | -1.41 (-2.02, -0.79) | -1.21 (-1.51, -0.90)*** | -2.14 (-2.84, -1.45) | 0.16 (-0.13, 0.45) | 0.31 (-0.24, 0.86) | -0.65 (-0.83, -0.47)*** | -1.96 (-2.63, -1.29) |
| No # IBS-M | -0.87 (-1.18, -0.57)*** | -1.51 (-2.11, -0.91) | -1.19 (-1.49, -0.88)*** | -2.03 (-2.69, -1.38) | -1.02 (-1.32, -0.72)*** | -1.81 (-2.45, -1.18) | -0.18 (-0.45, 0.10) | -0.33 (-0.87, 0.20) | -0.81 (-0.99, -0.64)*** | -2.46 (-3.17, -1.76) |