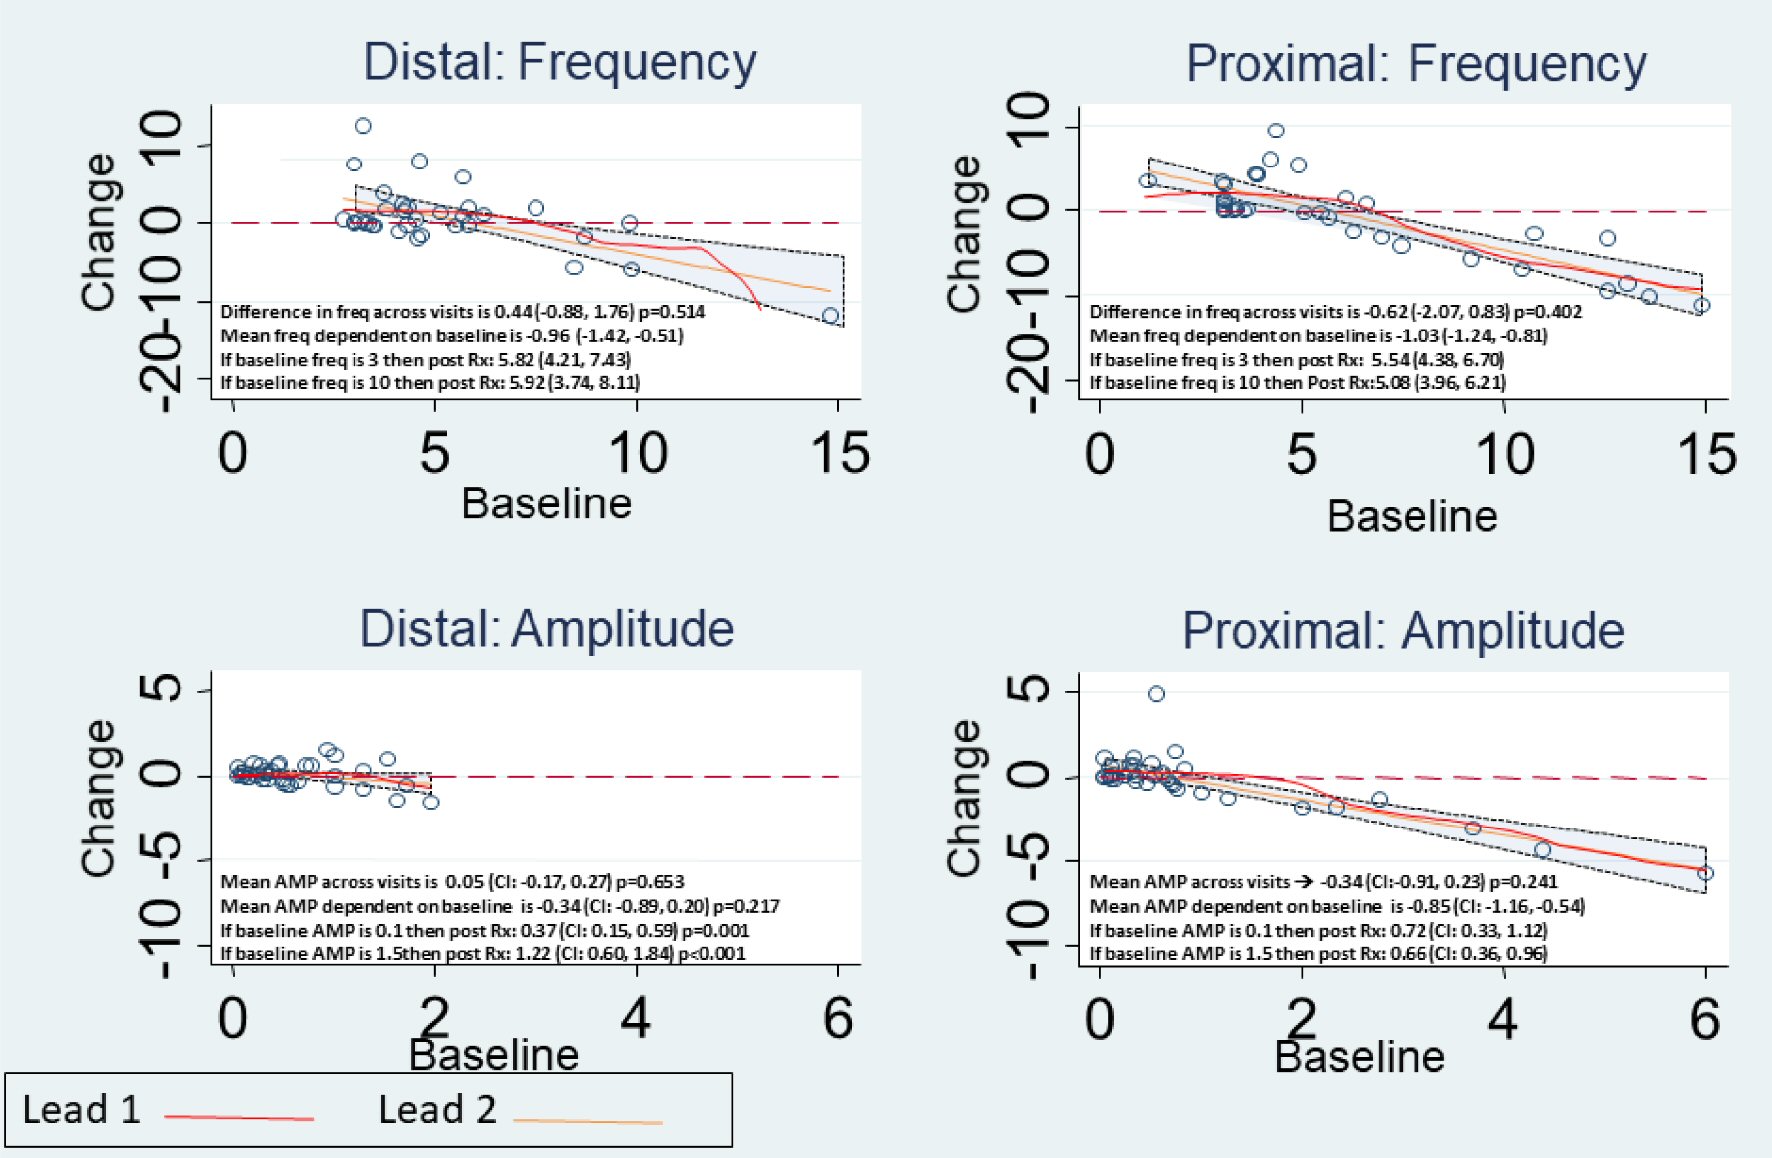
Figure 1. Observed change in Mucosal Frequency and Amplitude for Proximal and Distal Leads, with details as noted in each panel.
| Gastroenterology Research, ISSN 1918-2805 print, 1918-2813 online, Open Access |
| Article copyright, the authors; Journal compilation copyright, Gastroenterol Res and Elmer Press Inc |
| Journal website http://www.gastrores.org |
Original Article
Volume 12, Number 2, April 2019, pages 60-66
Temporary Gastric Stimulation in Patients With Gastroparesis Symptoms: Low-Resolution Mapping Multiple Versus Single Mucosal Lead Electrograms
Figure
Tables
| Age (years), mean ± SD | 45 ± 15 |
| Gender | |
| Male | 8 (19%) |
| Female | 34 (81%) |
| African Americans | 8 (19%) |
| Etiology of gastroparesis | |
| Idiopathic | 24 (57.1%) |
| Diabetes mellitus | 18 (42.9%) |
| Post-Surgical | 0 (0%) |
| Age (years), mean ± SD | 47 ± 14.9 |
| Gender | |
| Male | 16 (23.2%) |
| Female | 53 (76.8%) |
| African Americans | 22 (31%) |
| Etiology of gastroparesis | |
| Idiopathic | 42 (60.8%) |
| Diabetes mellitus | 26 (37.6%) |
| Post-surgical | 1 (1.44%) |
| Gastroparesis patients | Initial frequency | Post-GES frequency | P value | Initial ratio | Post-GES ratio | P value |
|---|---|---|---|---|---|---|
| Frequency reported as cpm and amplitude reported as mV. *The significant P values. | ||||||
| All Patients | 5.42012 | 5.09214 | 0.4776 | 18.7357 | 27.0731 | 0.1987 |
| Low frequency (7) | 3.0957 | 4.9314 | 0.0155* | 11.3829 | 23.6829 | 0.2602 |
| High frequency (35) | 5.885 | 5.12429 | 0.1347 | 20.2063 | 27.7511 | 0.3153 |
| Variable | Visit 1 | Visit 2 | Change (CI) (P value) |
|---|---|---|---|
| TSS: total symptom score; GET total: total gastric emptying time. All “Visit 2” values were recorded 5 days after baseline at visit 1. *The significant P values. | |||
| Nausea | 3.28 | 1.54 | -1.7 (1.25, 2.24) (< 0.001)* |
| Vomiting | 1.96 | 0.51 | -1.44 (0.96, 1.93) (< 0.001)* |
| Anorexia | 2.55 | 1.23 | -1.32 (1.9, 0.01) (0.002)* |
| Bloating | 2.53 | 1.32 | -0.26 (1.72 , 1.86) (< 0.001)* |
| Abdominal pain | 2.35 | 1.32 | -1.03 (0.36, 1.71) (0.004)* |
| TSS | 12.46 | 5.6 | -6.86 (5.02, 8.71) (< 0.001)* |
| GET total | 153.63 | 141.92 | -11.71 (-9.32, 32.73) (0.27) |
| Variable | Visit 1 | Visit 2 | Change (CI) (P value) |
|---|---|---|---|
| Frequency reported as cpm and amplitude reported as mV. TSS: total symptom score; GET Total: total gastric emptying time. All “Visit 2” values were recorded 5 days after baseline at visit 1. *The significant P values. | |||
| Nausea | 3.46 | 1.73 | -1.73 (-2.5, -0.91) (< 0.001)* |
| Vomiting | 2.69 | 1.46 | -1.23 (-2.1, -0.4) (0.003)* |
| Anorexia | 3.04 | 2.08 | -0.96 (-1.9, -0.01) (0.047)* |
| Bloating | 3.21 | 1.69 | -1.52 (-2.6, -0.4) (0.006)* |
| Abdominal pain | 2.75 | 1.38 | -1.36 (-2.7, -0.1) (0.038) |
| TSS | 15.38 | 8.27 | -7.11 (-11.1, -3.1) (< 0.001)* |
| Frequency | 6.45 | 5.96 | -0.49 (-2.9, 1.9) (0.685) |
| Amplitude | 0.69 | 0.99 | 0.30 (-0.3, 0.9) (0.362) |
| Ratio | 26.43 | 11.49 | -14.93 (-26.9, -3.0) (0.014)* |
| GET total | 109.04 | 120.55 | 11.51 (-20.1, 43.2) (0.48) |