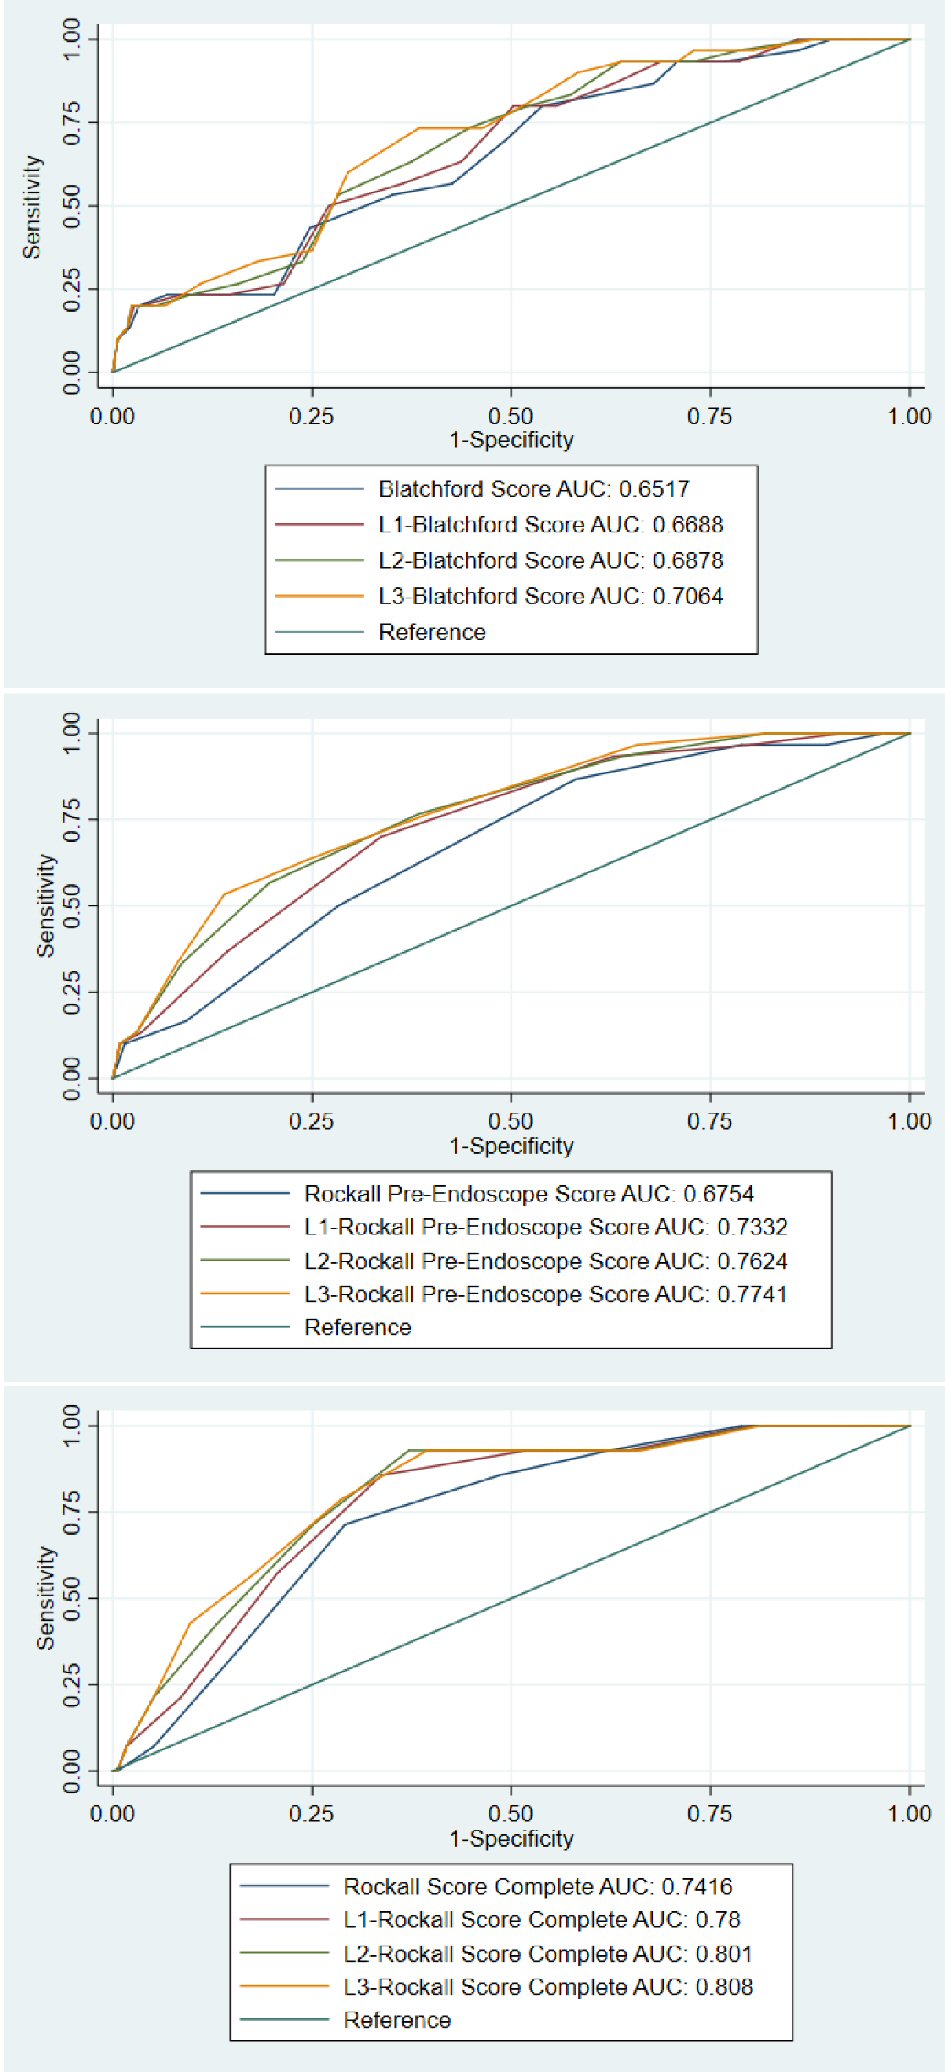
Figure 1. ROC curves comparing the original and modified Blatchford scores (top panel), Rockall pre-endoscope score (middle panel), and Rockall post endoscopic (complete) scores (bottom panel).
| Gastroenterology Research, ISSN 1918-2805 print, 1918-2813 online, Open Access |
| Article copyright, the authors; Journal compilation copyright, Gastroenterol Res and Elmer Press Inc |
| Journal website http://www.gastrores.org |
Original Article
Volume 12, Number 1, February 2019, pages 1-7
Lactic Acid Is an Independent Predictor of Mortality and Improves the Predictive Value of Existing Risk Scores in Patients Presenting With Acute Gastrointestinal Bleeding
Figure
Tables
| Survivors (n = 336) | Non-survivors (n = 30) | All (366) | P value | |
|---|---|---|---|---|
| Age (years) | ||||
| Mean (SD) | 70.5 (15.9) | 76.6 (16.2) | 70.9 (16) | 0.021 |
| Median (IQR) | 72 (20) | 80 (21) | 73 (21) | |
| Gender | 148 (44%) | 14 (46.7%) | 162 (44.3%) | 0.782 |
| Female, n (%) | ||||
| Systolic blood pressure (mm Hg), mean (SD) | 127.3 (27) | 116.0 (28.6) | 123.4 (27.5) | 0.035 |
| Heart rate (beats/min), mean (SD) | 89.5 (21.3) | 86.7 (26.7) | 89.3 (21.8) | 0.747 |
| Melena | 127 (37.8%) | 12 (40%) | 139 (38%) | 0.812 |
| Syncope in last 7 days | 19 (5.7%) | 5 (16.7%) | 24 (6.6%) | 0.037 |
| Altered mentation | 24 (7.1%) | 7 (23.3%) | 31 (8.5%) | 0.008 |
| Comorbidities | ||||
| No major comorbidity | 65 (19.3%) | 2 (6.7%) | 67 (18.3%) | < 0.0001 |
| Renal failure, liver failure, and/or disseminated malignancy | 120 (35.7%) | 22 (73.3%) | 142 (38.8%) | |
| Any comorbidity except renal failure, liver failure, and/or disseminated malignancy | 151 (44.9%) | 6 (20.0%) | 157 (42.9%) | |
| Congestive heart failure | 74 (22%) | 10 (33.3%) | 84 (23%) | 0.158 |
| Hepatic disease | 43 (12.8%) | 8 (26.7%) | 51 (13.9%) | 0.05 |
| Albumin < 3g/dL | 55 (16.4%) | 15 (50%) | 70 (19.1%) | < 0.0001 |
| INR > 1.5 | 73 (21.7%) | 5 (16.7%) | 78 (21.3%) | 0.487 |
| Lactic acid , peak (mmol/L), mean (SD) | 2.2 (1.7) | 5.8 (5.5) | 2.4 (2.2) | < 0.0001 |
| Hemoglobin(g/dL), mean (SD) | 10.4 (3) | 9.7 (2.7) | 10.3 (3) | 0.295 |
| BUN(mg/dL), mean (SD) | 33.3 (22) | 41.5 (27) | 33.8 (22.8) | 0.058 |
| Endoscopic diagnosis (n = 188) | ||||
| No lesion or stigmata of recent bleed | 41 (23.6%) | 2 (14.3%) | 43 (22.9%) | 0.316 |
| Malignancy of upper GI tract | 3 (1.7%) | 1 (7.1%) | 4 (2.1%) | |
| All other diagnosis | 130 (74.7%) | 11 (78.6%) | 141 (75%) | |
| Hemorrhage stigmata (n = 189) | 67 (38.3%) | 11 (78.6%) | 78 (41.3%) | 0.003 |
| Risk scores | Survivors (n = 336) | Non-survivors (n = 30) | P value |
|---|---|---|---|
| *Values are mean score (SD). | |||
| Blatchford score | 8 (4.6) | 10.7 (4.3) | 0.002 |
| Rockall-pre-endoscopy | 3.6 (1.5) | 4.6 (1.3) | 0.001 |
| Rockall-complete* | 5.3 (2.1) | 6.9 (1.3) | 0.004 |
| AIMS65 | 1.87 (0.8) | 1.9 (0.8) | 0.683 |
| Odds ratio (OR) | 95% Confidence interval for OR | P value | ||
|---|---|---|---|---|
| Lower | Upper | |||
| Age | 1.07 | 1.02 | 1.11 | < 0.0001 |
| BP | 1.01 | 0.99 | 1.03 | 0.37 |
| Hepatic disease | 0.41 | 0.09 | 1.87 | 0.25 |
| Charlson score | ||||
| (0) Reference | 0.04 | |||
| (2) | 0.55 | 0.09 | 3.23 | 0.51 |
| (3) | 2.48 | 0.45 | 13.54 | 0.3 |
| Syncope in last 7 days | 0.9 | 0.19 | 4.41 | 0.9 |
| Altered mentation | 3.4 | 0.98 | 11.78 | 0.05 |
| Lactic acid level, peak | 1.51 | 1.26 | 1.82 | < 0.0001 |
| BUN | 0.99 | 0.97 | 1.01 | 0.39 |
| Albumin | 0.28 | 0.12 | 0.64 | < 0.0001 |
| Score | Area | P value | 95% Confidence interval | P value | |
|---|---|---|---|---|---|
| Lower bound | Upper bound | ||||
| Blatchford score | 0.652 | 0.006 | 0.557 | 0.747 | Blatchford score vs. |
| L1-Blatchford | 0.669 | 0.002 | 0.578 | 0.760 | 0.005 |
| L2-Blatchford | 0.688 | 0.001 | 0.600 | 0.775 | 0.004 |
| L3-Blatchford | 0.706 | 0.000 | 0.621 | 0.792 | 0.003 |
| Rockall Pre-Endoscopy | 0.675 | 0.001 | 0.586 | 0.765 | Rockall pre-endoscopy vs. |
| L1-Rockall pre-endoscopy | 0.733 | 0.000 | 0.649 | 0.818 | 0.003 |
| L2-Rockall pre-endoscopy | 0.762 | 0.000 | 0.680 | 0.844 | 0.007 |
| L3-Rockall pre-endoscopy | 0.774 | 0.000 | 0.694 | 0.854 | 0.012 |
| Rockall Score-complete | 0.742 | 0.003 | 0.633 | 0.850 | Rockall score-complete vs. |
| L1-Rockall-complete | 0.780 | 0.000 | 0.677 | 0.883 | 0.040 |
| L2-Rockall-complete | 0.801 | 0.000 | 0.698 | 0.904 | 0.078 |
| L3-Rockall-complete | 0.808 | 0.000 | 0.703 | 0.913 | 0.129 |